
INTRODUCTION
Myocardial infarction (MI), frequently resulting from coronary thrombosis, has been the major cause of death in humans worldwide, and its incidence is still rapidly increasing in low-, moderate-, and high-income countries [1, 2], Finland and Japan have the highest and lowest MI incidence rate worldwide, respectively [3-5]. The World Bank estimates that by 2030, 23 million Chinese patients will experience accurate MI annually [6]. Therefore, this disease is a serious challenge facing the nation’s healthcare system. There are some conventional predisposing factors for the development of MI, involving tobacco use, diabetic diseases, abnormally elevated blood pressure, hypercholesterolemia, and obesity [7]. Aside from these modifiable risk factors, accumulating studies have demonstrated that MI is a complicated polygenic disease, arising from some different causes and impacts, which is believed to be a result of interactions between an individual’s genetic composition and a variety of environmental risk factors [8-10]. Moremore, some patients with MI might have never exposed to any well-established risk factors. On the contrary, only a fraction of individual exposed to risk factors eventually develop this type of disease in the lifetime. Therefore, genetic factors, such as some uncharacterized genetic component may predispose to MI [11]. Abundant studies have identified some molecular pathways that are associated with MI, including Notch [12], MAPK [13], as well as NF-kB [14] signal transduction pathways. Some genetic alterations (e.g., mutation, gene amplification, and genetic variation) within signaling pathways may contribute to MI susceptibility and also serve as druggable targets for the disease. The identification of pathogenic genetic alterations may lead to new understandings of the development of MI.
In the canonical Wnt signaling pathway, Wnt ligands bind to receptors (e.g., the seven-pass transmembrane Frizzled receptor) and lead to the stabilization of intracellular β-catenin, which permits accumulation of β-catenin and its nuclear translocation, subsequently influencing the association of transcription factors (e.g., Tcf/LEF) with transcriptional co-repressors to activate Wnt-dependent target gene expression, such as Wnt-1 inducible signaling protein 1 (WISP1) [15-17]. On the other hand, the secreted frizzled-related protein (SFRP) family (SFRP1-5) can competitively bind to Wnt proteins and block their interactions with Frizzleds, negatively regulating the activation of canonical Wnt signaling pathway and expression of downstream genes [18, 19]. Compelling evidences have indicated that the Wnt signaling pathway is involved in MI [20, 21], but the underlying mechanisms remain to be further clarified.
Thus far, there are few epidemiologic studies evaluating the association between genetic variations in the Wnt pathway genes and the risk of MI. To precisely determine the association of the Wnt pathway gene polymorphisms with MI risk, we investigated the genotype distributions of several single nucleotide polymorphisms (SNPs) in key genes within this important pathway (i.e., rs7832767 C > T in SFRP1 gene, rs2293303 C > T in CTNNB1 gene, rs16893344 C > T in WISP1 gene) in the case-control study with 465 MI cases and 485 controls.
RESULTS
Characteristics of study participants
Demographic and clinical characteristics of all participants were listed in Table 1. In total, 465 patients with MI and 485 healthy controls were enrolled in this study. Of the MI patients, 255 (54.84%) were women and 210 (45.16%) were men, with mean age 67.32±8.57 years (range, 37-89 years). As to the controls, 273 (56.29%) were women and 212 (43.71%) were men, with mean age 66.98±9.07 years (range, 33-91 years). We did not observe significant differences between patients and controls regarding age (P = 0.552), sex (P = 0.653), drinking status (P = 0.742), body mass index (BMI) (P = 0.112), triglycerides (TG) (P = 0.618), high-density lipoprotein cholesterol (HDL-C) (P = 0.719), uric acid (P = 0.185), blood urea nitrogen (BUN) (P = 0.996), and creatinine (Cr) (P = 0.779). The patients and controls differed significantly with regards to systolic blood pressure (SBP) (P < 0.0001), diastolic blood pressure (DBP) (P < 0.0001), fasting plasma glucose (FPG) (P < 0.0001), total cholesterol (TC) (P < 0.0001), low-density lipoprotein cholesterol (LDL-C) (P < 0.0001), the prevalence of hypertension (P < 0.0001), diabetes (P < 0.0001), dyslipidemia (P = 0.017), smoking (P = 0.0002), and obesity (P = 0.028). In terms of these clinical parameters, cases tended to be unhealthier than controls.
Table 1: Demographic and clinical characteristics of study participants
Variables |
Case (n= 465) |
Control (n = 485) |
Pa |
||
No |
% |
No |
% |
||
Age range, yr |
37-89 |
33-91 |
0.552 |
||
Mean ± SD |
67.32 ± 8.57 |
66.98 ± 9.07 |
|||
≤ 60 |
88 |
18.92 |
92 |
18.97 |
|
61-70 |
191 |
41.08 |
192 |
39.59 |
|
71-80 |
161 |
34.62 |
182 |
37.53 |
|
>80 |
25 |
5.38 |
19 |
3.92 |
|
Sex |
0.653 |
||||
Female |
255 |
54.84 |
273 |
56.29 |
|
Male |
210 |
45.16 |
212 |
43.71 |
|
Smoking status |
0.0002 |
||||
Never |
308 |
66.24 |
374 |
77.11 |
|
Ever |
157 |
33.76 |
111 |
22.89 |
|
Drinking status |
0.742 |
||||
Never |
414 |
89.03 |
435 |
89.69 |
|
Ever |
51 |
10.97 |
50 |
10.31 |
|
BMI (kg/m2) |
26.07 ± 4.06 |
25.66 ± 3.83 |
0.112 |
||
<18.5 |
9 |
1.94 |
12 |
2.47 |
|
18.5-23.9 |
147 |
31.61 |
151 |
31.13 |
|
24.0-29.9 |
230 |
49.46 |
264 |
54.43 |
|
≥30.0 |
79 |
16.99 |
58 |
11.96 |
|
Hypertension |
<0.0001 |
||||
No |
312 |
67.10 |
231 |
47.63 |
|
Yes |
153 |
32.90 |
254 |
52.37 |
|
Diabetes |
<0.0001 |
||||
No |
263 |
56.56 |
45 |
9.28 |
|
Yes |
202 |
43.44 |
440 |
90.72 |
|
Dyslipidemia |
0.017 |
||||
No |
198 |
42.58 |
244 |
50.31 |
|
Yes |
267 |
57.42 |
241 |
49.69 |
|
Obesity |
0.028 |
||||
No |
79 |
16.99 |
58 |
11.96 |
|
Yes |
386 |
83.01 |
427 |
88.04 |
|
SBP (mmHg) |
147.04 ± 23.48 |
137.36 ± 19.04 |
<0.0001 |
||
DBP (mmHg) |
90.40 ± 19.34 |
84.86 ± 16.11 |
<0.0001 |
||
FPG (mmol/L) |
6.74 ± 1.74 |
5.36 ± 1.76 |
<0.0001 |
||
TG (mmol/L) |
1.55 ± 1.14 |
1.59 ± 1.28 |
0.618 |
||
TC (mmol/L) |
4.79 ± 1.13 |
4.41 ± 1.21 |
<0.0001 |
||
HDL-C (mmol/L) |
1.24 ± 0.45 |
1.23 ± 0.50 |
0.719 |
||
LDL-C (mmol/L) |
2.95 ± 0.99 |
2.67 ± 0.84 |
<0.0001 |
||
Uric acid (umol/L) |
300.93 ± 93.12 |
293.41 ± 80.81 |
0.185 |
||
BUN (mmol/L) |
5.35 ± 1.62 |
5.34 ± 1.75 |
0.996 |
||
Cr (mmol/L) |
76.64 ± 23.06 |
76.06 ± 38.91 |
0.779 |
||
BMI, body mass index; SBP, systolic blood pressure; DBP, diastolic blood pressure; FPG, fasting plasma glucose; TG, triglyceride; TC, total cholesterol; HDL-C, high density lipoprotein cholesterol; LDL-C, low density lipoprotein cholesterol; BUN, blood urea nitrogen; Cr, creatinine
a The P value of the continuous variables was calculated by the independent-sample t-test. The P value of the categorical variables was calculated by χ2 test
The genotypes distribution of selected polymorphisms in MI cases and controls
The genotypes distribution of the three selected polymorphisms in patients with MI and healthy controls were indicated in Table 2. The genotype freqency distributions of the three SNPs in controls were in accordance with the Hardy-Weinberg equilibrium (P = 0.769 for rs7832767, P = 0.754 for rs2293303, and P = 0.743 for rs16893344).
Overall, we found that, compared to non-carriers, carriers of SFRP1 rs7832767 T allele had a significantly elevated MI risk [TT vs. CC: adjusted odds ratio (AOR) = 3.13, 95% confidence interval (CI) = 1.78-5.51; CT/TT vs. CC: AOR = 1.53, 95% CI = 1.12-2.08; TT vs. CC/CT: AOR = 2.87, 95% CI = 1.66-4.97] after adjustment for age, gender, smoking, drinking status, BMI, SBP, DBP, FPG, TG, TC, Uric acid, HDL-C, LDL-C, BUN, and Cr. We also found that the significant association between CTNNB rs2293303 C > T polymorphism and an increased MI risk (CT vs. CC: AOR = 3.48, 95% CI = 2.28-5.33; TT vs. CC: AOR = 7.37, 95% CI = 2.08-26.16; CT/TT vs. CC: AOR = 3.72, 95% CI = 2.46-5.62; TT vs. CC/CT: AOR = 5.52, 95% CI = 1.58-19.28). Similarly, WISP rs16893344 C > T polymorphism was also shown to significantly increase the risk of MI (CT vs. CC: AOR = 2.43, 95% CI = 1.70-3.47; TT vs. CC: AOR = 5.17, 95% CI = 1.85-14.41; CT/TT vs. CC: AOR = 2.58, 95% CI = 1.83-3.66; TT vs. CC/CT: AOR = 3.88, 95% CI = 1.41-10.64).
Table 2: The distribution of genotypes and alleles of Wnt signaling pathway gene between myocardial infarction patients and controls
Genotype |
Case (n, %) |
Control (n, %) |
P a |
Crude OR (95% CI) |
P |
Adjusted OR (95% CI) b |
P b |
SFRP1 rs7832767 C>T |
|||||||
CC |
231 (49.68) |
286 (58.97) |
1.00 |
1.00 |
|||
CT |
182 (39.14) |
170 (35.05) |
1.33 (1.01-1.74) |
0.042 |
1.27 (0.91-1.76) |
0.167 |
|
TT |
52 (11.18) |
29 (5.98) |
2.22 (1.37-3.61) |
0.001 |
3.13 (1.78-5.51) |
<0.0001 |
|
Additive |
0.002 |
1.42 (1.16-1.73) |
0.0006 |
1.55 (1.23-1.97) |
0.0002 |
||
Dominant |
234 (50.32) |
199 (41.03) |
0.004 |
1.46 (1.13-1.88) |
0.004 |
1.53 (1.12-2.08) |
0.007 |
Recessive |
413 (88.82) |
456 (94.02) |
0.004 |
1.98 (1.23-3.18) |
0.005 |
2.87 (1.66-4.97) |
0.0002 |
CTNNB1 rs2293303 C>T |
|||||||
CC |
358 (76.99) |
407 (83.92) |
1.00 |
1.00 |
|||
CT |
95 (20.43) |
74 (15.26) |
1.46 (1.04-2.04) |
0.027 |
3.48 (2.28-5.33) |
<0.0001 |
|
TT |
12 (2.58) |
4 (0.82) |
3.41 (1.09-10.67) |
0.035 |
7.37 (2.08-26.16) |
0.002 |
|
Additive |
0.009 |
1.55 (1.16-2.08) |
0.003 |
3.25 (2.24-4.71) |
<0.0001 |
||
Dominant |
107 (23.01) |
78 (16.08) |
0.007 |
1.56 (1.13-2.16) |
0.007 |
3.72 (2.46-5.62) |
<0.0001 |
Recessive |
453 (97.42) |
481 (99.18) |
0.036 |
3.19 (1.02-9.95) |
0.046 |
5.52 (1.58-19.28) |
0.007 |
WISP1 rs16893344 C>T |
|||||||
CC |
314 (67.53) |
369 (76.08) |
1.00 |
1.00 |
|||
CT |
136 (29.25) |
109 (22.47) |
1.47 (1.09-1.97) |
0.011 |
2.43 (1.70-3.47) |
<0.0001 |
|
TT |
15 (3.23) |
7 (1.44) |
2.52 (1.01-6.25) |
0.047 |
5.17 (1.85-14.41) |
0.002 |
|
Additive |
0.007 |
1.50 (1.16-1.93) |
0.002 |
2.38 (1.75-3.25) |
<0.0001 |
||
Dominant |
151 (32.47) |
116 (23.92) |
0.003 |
1.53 (1.15-2.03) |
0.004 |
2.58 (1.83-3.66) |
<0.0001 |
Recessive |
450 (96.77) |
478 (98.56) |
0.068 |
2.28 (0.92-5.63) |
0.075 |
3.88 (1.41-10.64) |
0.009 |
a c2 test for genotype distributions between myocardial infarction patients and controls
b Adjusted for age, gender, smoking, drinking status, BMI, SBP, DBP, FPG, TG, TC, Uric acid, HDL-C, LDL-C, BUN, Cr
Stratified analysis
We performed stratification analyses in terms of age, sex, smoking and drinking status, hypertension, diabetic diseases, dyslipidemia, and obesity to evaluate how these variables modified the association between the SNPs (SFRP1 rs7832767 C > T, CTNNB rs2293303 C > T and WISP1 rs16893344 C > T) and MI risk (Table 3). The SFRP1 rs7832767 CT/TT genotypes were shown to significantly increase MI risk in subjects of age≤67 and under (AOR = 2.31, 95% CI = 1.43-3.74), men (AOR = 1.98, 95% CI = 1.21-3.24), smokers (AOR = 3.05, 95% CI = 1.59-5.84), drinkers (AOR = 9.75, 95%CI = 2.64-36.10), subgroup with hypertension (AOR = 5.99, 95% = 3.10-11.56), subgroup with diabetes (AOR = 4.77, 95% CI = 3.09-7.35) and without diabetes (AOR = 0.32, 95% = 0.14-0.73), subgroup with dyslipidemia (AOR = 1.59, 95% CI = 1.04-2.41) as well as obesity (AOR = 1.50, 95% CI = 1.07-2.10). As to the CTNNB rs2293303 C > T polymorphism, we found that the increased risk remained statistically significant in all subgroups except for non-diabetes and non-obesity subgroups. Finally, we found that the association between the WISP1 rs16893344 CT/TT genotype and MI risk was prominent in subjects at age of older than 67 (AOR = 3.58, 95% CI = 2.21-5.81), women (AOR = 2.87, 95% CI = 1.83-4.51), men (AOR = 1.97, 95% CI = 1.12-3.47), non-smokers (AOR = 1.96, 95% CI = 1.32-2.91), smokers (AOR = 6.99, 95% CI = 3.04-16.08), non-drinkers (AOR = 2.29, 95%CI = 1.60-3.29), drinkers (AOR = 13.00, 95%CI = 2.44-69.25), non-hypertension (AOR = 1.88, 95% = 1.22-2.90), hypertension (AOR = 4.58, 95% = 2.38-8.82), diabetes (AOR = 9.83, 95% CI = 6.23-15.51), dyslipidemia (AOR = 2.73, 95% CI = 1.71-4.36) as well as obesity subgroups (adjusted OR = 2.80, 95% CI = 1.91-4.12).
Table 3: Logistic regression analysis for association of SNPs with MI risk in Wnt signaling pathway
Variables |
rs7832767 (Case/Control) |
Adjusted ORa |
Pa |
rs2293303 (Case/Control) |
Adjusted ORa |
Pa |
rs16893344 (Case/Control) |
Adjusted ORa |
Pa |
|||
CC |
CT/TT |
95% CI |
CC |
CT/TT |
95% CI |
CC |
CT/TT |
95% CI |
||||
Median age, yr |
||||||||||||
≤67 |
96/133 |
112/72 |
2.31 (1.43-3.74) |
0.0007 |
159/164 |
49/41 |
2.39 (1.30-4.37) |
0.005 |
142/148 |
66/57 |
1.65 (0.98-2.77) |
0.061 |
>67 |
135/153 |
122/127 |
1.15 (0.75-1.75) |
0.529 |
199/243 |
58/37 |
5.36 (2.98-9.62) |
<0.0001 |
172/221 |
85/59 |
3.58 (2.21-5.81) |
<0.0001 |
Gender |
||||||||||||
Females |
127/155 |
128/118 |
1.20 (0.80-1.82) |
0.379 |
183/232 |
72/41 |
4.36 (2.58-7.39) |
<0.0001 |
162/211 |
93/62 |
2.87 (1.83-4.51) |
<0.0001 |
Males |
104/131 |
106/81 |
1.98 (1.21-3.24) |
0.007 |
175/175 |
35/37 |
2.88 (1.43-5.80) |
0.003 |
152/158 |
58/54 |
1.97 (1.12-3.47) |
0.018 |
Smoking status |
||||||||||||
Never |
159/212 |
149/162 |
1.18 (0.82-1.70) |
0.371 |
230/306 |
78/68 |
3.46 (2.18-5.50) |
<0.0001 |
208/274 |
100/100 |
1.96 (1.32-2.91) |
0.0008 |
Ever |
72/74 |
85/37 |
3.05 (1.59-5.84) |
0.0008 |
128/101 |
29/10 |
5.13 (1.92-13.75) |
0.001 |
106/95 |
51/16 |
6.99 (3.04-16.08) |
<0.0001 |
Drinking status |
||||||||||||
Never |
208/245 |
206/190 |
1.25 (0.90-1.74) |
0.181 |
316/360 |
98/75 |
3.55 (2.31-5.44) |
<0.0001 |
279/323 |
135/112 |
2.29 (1.60-3.29) |
<0.0001 |
Ever |
23/41 |
28/9 |
9.75 (2.64-36.10) |
0.0006 |
42/47 |
9/3 |
11.77 (1.77-78.13) |
0.011 |
35/46 |
16/4 |
13.00 (2.44-69.25) |
0.003 |
Hypertension |
||||||||||||
No |
144/96 |
168/135 |
0.72 (0.49-1.06) |
0.103 |
250/217 |
62/14 |
6.85 (3.49-13.47) |
<0.0001 |
216/179 |
96/52 |
1.88 (1.22-2.90) |
0.004 |
Yes |
87/190 |
66/64 |
5.99 (3.10-11.56) |
<0.0001 |
108/190 |
45/64 |
2.64 (1.39-5.00) |
0.003 |
98/190 |
55/64 |
4.58 (2.38-8.82) |
<0.0001 |
Diabetes |
||||||||||||
No |
185/21 |
78/24 |
0.32 (0.14-0.73) |
0.007 |
244/41 |
19/4 |
1.21 (0.33-4.49) |
0.777 |
237/29 |
26/16 |
0.21 (0.08-0.52) |
0.0007 |
Yes |
46/265 |
156/175 |
4.77 (3.09-7.35) |
<0.0001 |
114/366 |
88/74 |
9.86 (5.91-16.46) |
<0.0001 |
77/340 |
125/100 |
9.83 (6.23-15.51) |
<0.0001 |
Dyslipidemia |
||||||||||||
No |
97/145 |
101/99 |
1.49 (0.93-2.40) |
0.097 |
152/199 |
46/45 |
3.67 (1.96-6.89) |
<0.0001 |
137/183 |
61/61 |
2.45 (1.42-4.23) |
0.001 |
Yes |
134/141 |
133/100 |
1.59 (1.04-2.41) |
0.032 |
206/208 |
61/33 |
3.81 (2.15-6.74) |
<0.0001 |
177/186 |
90/55 |
2.73 (1.71-4.36) |
<0.0001 |
Obesity |
||||||||||||
No |
31/30 |
48/28 |
1.70 (0.73-3.95) |
0.221 |
61/47 |
18/11 |
2.25 (0.78-6.53) |
0.135 |
54/42 |
25/16 |
1.47 (0.58-3.72) |
0.416 |
Yes |
200/256 |
186/171 |
1.50 (1.07-2.10) |
0.020 |
297/360 |
89/67 |
4.00 (2.54-6.32) |
<0.0001 |
260/327 |
126/100 |
2.80 (1.91-4.12) |
<0.0001 |
a Adjusted for age, gender, smoking, drinking status, BMI, SBP, DBP, FPG, TG, TC, Uric acid, HDL-C, LDL-C, BUN, Cr
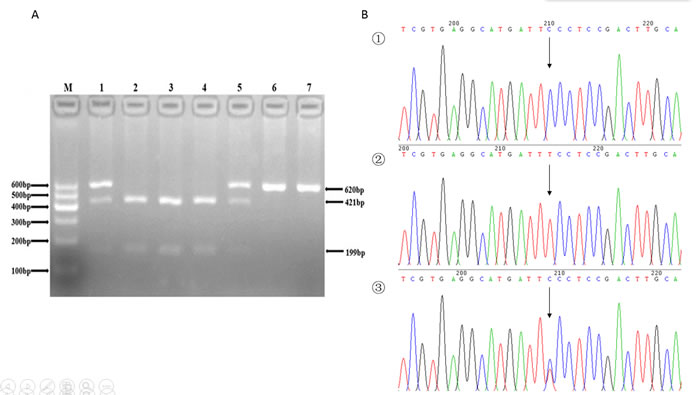
Figure 1: A. The restriction fragment length polymorphism analysis to determine rs7832767 C > T polymorphism, the CC genotype shows three bands at 56, 199, 421 bp (2, 3 and 4); the TT genotype shows two bands at 56 bp and 620 bp (6 and 7); and the CT genotype shows four bands at 56, 199, 421 and 620 bp (1 and 5). B. Nucleotide sequences around rs7832767 C > T polymorphism ((1), CC genotype; (2), TT genotype; (3), CT genotype).
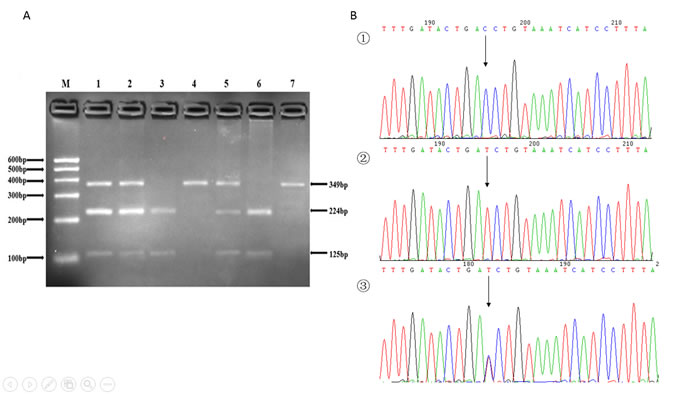
Figure 2: A. The restriction fragment length polymorphism analysis to determine rs2293303 C > T polymorphism, the CC genotype shows one 349 bp band (4 and 7); the TT genotype shows two bands at 125 bp and 224 bp (3 and 6); and the CT genotype shows three bands at 125 bp, 224 bp and 349 bp (1, 2 and 5). B. Nucleotide sequences around rs2293303 C > T polymorphism ((1), CC genotype; (2), TT genotype; (3), CT genotype).
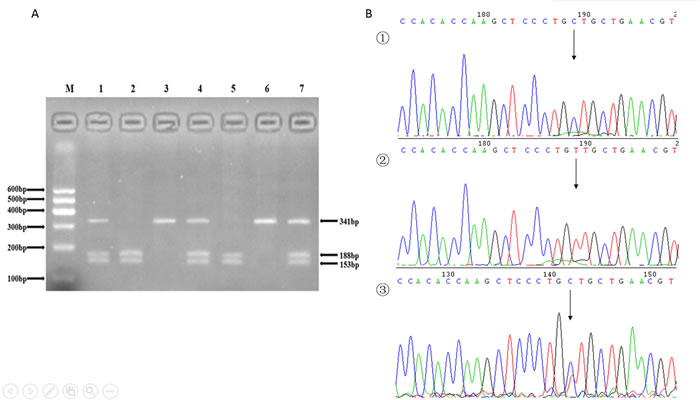
Figure 3: A. The restriction fragment length polymorphism analysis to determine rs16893344 C > T polymorphism, the CC genotype shows two bands at 153 bp and 188 bp (2 and 5); the TT genotype shows one 341 bp band (3 and 6); and the CT genotype shows three bands at 153 bp, 188 bp and 341 bp (1, 4 and 7). B. Nucleotide sequences around rs16893344 C > T polymorphism ((1), CC genotype; (2), TT genotype; (3), CT genotype).
DISCUSSION
Identification of genetic variations that are able to modify individuals’ susceptibility may advance the understanding of the pathophysiological characteristics of MI, and may further facilitate individualized treatment decision making [22]. In this case-control study, we genotyped SNPs in three major Wnt signaling pathway genes (SFRP1, CTNNB1 and WISP1) in Chinese population, and investigated the correlation between these SNPs and MI risk. The results indicated that SFRP1 rs7832767 C > T, CTNNB1 rs2293303 C > T, and WISP1 rs16893344 C > T were all strongly correlated with MI susceptibility.
The Wnt signaling pathway can be competitively inhibited by SFRP1 by sequestrating the Wnt ligands and consequently preventing the activation of downstream signaling cascade. Evidence from transgenic mice overexpressing SFRP1 revealed that overexpression of SFRP1 reduced infarct size and cardiac rupture in a coronary arter lighation-induced MI model and improves cardiac function, when compared to wild-type mice [23]. Previous investigations have revealed the associations of genetic variants in the SFRP1 gene with tuberculosis, inflammation, and cancer susceptibility [24-26]. We explored the rs78332767 C > T polymorphism in the SFRP1gene and found that it was significantly associated with the risk of MI in Chinese Han population. Carriers of SFRP1 rs78332767 TT genotype or CT genotype were at significantly increased risk of MI, suggesting SFRP1 may be a susceptibility gene for the development of MI. To the best of our knowledge, this is the first study to scrutinize of the risk effect of SFRP1 rs7832767 C > T in cardiovascular disease. Larger, well-designed studies, involoving different ethnical populations are warranted to validate our finding, and further functional analysis are also indispensable to provide biological supports for the causal association.
β-catenin encoded by the CTNNB1 gene has multiple functions in the maintenance of cardiac tissue homeostasis. Stabilization of β-catenin has been related to adult cardiac hypertrophy, and down-regulation of this protein initiates heart formation in embryogenesis [27]. Aberrant action and excessively high expression levels of β-catenin have synergistic effects in various diseases. A number of animal experiments confirmed that β-catenin levels were significantly increased in the MI model [28]. There are several lines of evidence showing the contribution of CTNNB1 rs2293303 C > T polymorphism to the risk and prognosis of cancer, elucitating its potential involvment the pathogenesis of human diseases. Wang et al. [29] demonstrated that carriers of polymorphic variant of CTNNB1 rs2293303 C > T polymorphism had significantly increased risk of gastric cancer and survival advantage versus non-carriers in a Chinese population. Jia et al. reported the significant association between CTNNB1 rs2293303 C > T and breast cancer susceptibility [30]. Our results indicated that CTNNB1 rs2293303 C > T was correlated with MI, and carriers of variant T allele had a significantly increased MI risk. Our results suggested that this polymorphism might modify the function of β-catenin, thereby affecting the development and progression of MI. However, the exact underlying mechanism by which this polymorphism conferred MI susceptibility remains to be elucidated.
WISP1 is a gene in the canonical Wnt signaling pathway [31]. Previous studies indicated that mutations in this gene were related to several diseases, involving lung cancer, asthma, hypertension, and spinal osteoarthritis [32-35]. It has been reported recently that genetic variations in the WISP1 gene, including rs16893344 C > T, may confer lung cancer susceptibility [32]. We observed an association of WISP1 rs16893344 C > T polymorphism with MI in Chinese Han population, with TT and CT risk genotype associated with an increase in MI risk. Overall, our findings may help to improve the understanding of the implication of inherited genetic factors in the onset and progression of MI.
Despite the promising findings in this study, several limitations should be mentioned. First of all, the sample size of this study is relatively moderate. The associations of MI risk with SFRP1 rs7832767 C > T, CTNNB1 rs2293303 C > T and WISP1 rs16893344 C > T with MI should be confirmed studies with larger sample size, involving diverse ethnical group. Second, we only drawed conclusions based on a observational association study, and found that in MI patients, the major Wnt signaling pathway genes all had C > T nucleotide polymorphism. These was similar to the previous research about the prevalent C > T nucleotide polymorphism in various human cancers [36, 37], but the researcher further revealed that the C > T nucleotide alteration tends to change an arginine to another amino acid [37]. Thus, mechanistic studies should be performed to explore the functions of the three SNPs in the future. Third, we only investigated three SNPs. Another variants that may also modify MI susceptibility should be also considered, including SNPs positioned in the functional domain. To better understand the impact of genetic factors on the MI susceptibility, genetic analysis on other genes within Wnt pathway should be carried out.
Thus far, this study is the first attempt to explore the relation of MI susceptibility with genetic variants in the Wnt signaling pathway in Chinese Han population. Overall, the studied SNPs (SFRP1 rs7832767 C > T, CTNNB1 rs2293303 C > T, and WISP1 rs16893344 C > T polymorphisms) were shown to significantly increase MI risk. These susceptibility loci in the major Wnt signaling pathway genes can be applied to prediction of individual genetic risk to MI, identify the high-risk subpopulation, and encourage prevention. In the future, large-scale case-control studies and functional analyses are essential to verify these findings.
MATERIALS AND METHODS
Ethical approval of the study protocol
This study was approved by the Ethics Committee of the First Affiliated Hospital in the Xinjiang Medical University, Xinjiang, China. We conducted the study according to the standards of the Declaration of Helsinki. All of the patients provided written informed consents and explicitly provided permission for DNA analyses, as well as the collection of relevant clinical data.
Subjects
All patients with MI and control subjects were recruited from the First Affiliated Hospital of Xinjiang Medical University from 2007 to 2014. We enrolled a total of 465 patients who suffered from first MI. Moreover, 485 sex-and age-matched healthy individual served as control subjects. MI diagnosis was established by the presence of chest pain lasting 20 min combined with ST-segment elevation or pathological Q waves on a surface electrocardiogram [38]. Patients with MI had to exhibit either an angiographically occluded infarct-related artery or regional wall motion abnormalities corresponding to the electrocardiographic infarct localization or both. Patients were excluded if they presented with ascertained congenital hypercoagulable status, a proven disease limiting life expectancy, or declared cocaine abuse. The control subjects were selected from volunteers who had visited our hospital between 2007 and 2014 for regular medical check-ups and were found to be healthy. Individuals would be considered eligible disease-free controls if they had angiographically normal coronary arteries and if they had no history of MI, no symptoms suggestive of MI, no electrocardiographic signs of MI, no regional wall motion abnormalities, and no relevant valvular abnormalities in echocardiograms [39]. Coronary angiography in the control individuals was performed for the evaluation of chest pain. Control subjects with coronary heart disease and any neoplasm, cardiomyopathy or severe illness limiting life expectancy or refusing consent were excluded. The response rates of participants were 100%.
Laboratory examination and definition of cardiovascular risk factors
Serum concentrations of TC, TG, FPG, HDL-C, LDL-C, BUN, Cr and uric acid were measured using standard methods in the Department of Clinical Laboratory of First Affiliated Hospital, Xinjiang Medical University as described previously [40, 41]. Major coronary artery disease (CAD) risk factors were defined based on current national guidelines. Dyslipidemia was defined as TG ≥ 2.26mmol/L, TC ≥ 6.22 mmol/L, LDL -C ≥ 4.14 mmol/L, HDL-C < 1.04 mmol/L, or a prior Dyslipidemia diagnosis and/or receiving a lipid-lowering drug [42]. Hypertension was defined as a SBP ≥ 140 mmHg, DBP ≥ 90 mmHg, or a prior hypertension diagnosis and/or receiving an antihypertensive drug [43]. Obesity was defined as a BMI ≥ 30.0 [44]. Diabetes was defined as FPG ≥ 6.99mmol/L, or a prior diabetes diagnosis and/or using a diabetes drug [45]. Smoking was defined as currently smoking cigarettes.
DNA extraction
Blood samples were collected from all participants using a standard venipuncture technique and EDTA-containing tubes. DNA was extracted from the peripheral blood leukocytes using a whole blood genome extraction kit (Beijing Bioteke Corporation, Beijing, China) as described previously [40, 41].
SNP selection
Candidate genes must be well characterized and key components of the Wnt signaling pathway in terms of functional significance. After carefully literature reviewing [26, 29, 32], we finally included three key genes (SFRP1, CTNNB1 and WISP1) within Wnt signaling pathway. Using Haploview 4.2 software and International HapMap Project website phase I &II database (http: //www.hapmap.org), we obtained one tagging SNP for each candidate gene, rs7832767 C > T in SFRP1, rs2293303 C > T in CTNNB1, and rs16893344 C > T in WISP1. All these SNPs have a minor allele frequency (MAF) of ≥ 0.05 and not in linkage disequilibrium with each other (r2 < 0.8).
Genotyping
The genotyping in the present study was performed via polymerase chain reaction-restriction fragment length polymorphism (PCR-RFLP) analysis. We designed the sequencing primers using Primer Premier 5.0. The primers were synthesize by Shanghai Generay Biological Technology Company Limited (Shanghai, China). The PCR amplification was performed in a 50 μL final reaction volume, containing 25μL of 2*powder Taq PCR master mix (Beijing Biotech, Beijing, China), 50 ng of genomic DNA, 21 μL of distilled water, and 1 μL of each forward and reverse primer. The thermal cycling conditions were as follows: (1) SFRP1: an initial denaturation step at 95°C for 5 min, 35 cycles of 95°C for 30 s, 51°C for 30 s and 72°C for 45 s, followed by a final extension step of 72°C for 10 min; (2) CTNNB1: an initial denaturation step at 95°C for 5 min, 35 cycles of 95°C for 30 s, 49°C for 30 s and 72°C for 45 s, and a final extension step of 72°C for 10 min; (3)WISP1: an initial denaturation step at 95°C for 5 min; 35 cycles of 95°C for 30 s, 53°C for 30 s and 72°C for 45 s, and a final extension step of 72°C for 10 min. The thermal cycling was performed using the GeneAmp 9700 system (Applied Biosystems, Foster City, USA). PCR products were further digested by restriction enzymes according to the manufacturer’s instructions. Sequences of the primer pairs, annealing temperatures, lengths of PCR products, and restriction enzymes for the three SNPs were shown in Table 4. After digestion, resulting fragments were separated on 3% agarose gels and stained with ethidium bromide for further analysis. A total of 10% of the genotyped samples were randomly duplicated and results were 100% concordant, and there were at least one positive and one negative control per 96-well DNA plate in our test. The PCR products were also sequenced by ABI 3730XL sequencer (Applied Biosystems, Foster City, USA) to detect the genotype (Figures 1, 2, 3).
Table 4: The primer sequences for each SNPs in Wnt signaling pathway
Polymorphism |
PCR Primers (5’→3’) |
Denaturation temperature |
Products length |
Restriction endonuclease |
rs7832767 |
Forward: GAGTTCCACCCTCAATCTGT |
51°C |
676bp |
Tfil |
Reverse: TTCCAGGGATGGTCTGTTAT |
||||
rs2293303 |
Forward: TTGTTGACACCCTGACTCTT |
49°C |
349bp |
BsaBI |
Reverse: TACAAATAGCCTAAACCACTC |
||||
rs16893344 |
Forward: AGTCCCTGCCCGACAGAGTT |
53°C |
341bp |
Acel |
Reverse: CTGATACAGGAGGGAGGATG |
SNP, single nucleotide polymorphism; PCR, polymerase chain reaction
Statistical analysis
We analyzed whether genotype frequencies of all studied SNPs in control subjects were in Hardy-Weinberg equilibrium using the goodness-of-fit χ2 analysis. The differences in the continuous variables [shown as mean ± standard deviation (SD)] between the MI patients and the control subjects were assessed using an independent-sample t-test. Categorical variables and distribution of genotypes and alleles were shown as numbers and percentages (%), and the differences between the two groups were tested by χ2 test or Fisher’s exact test. Moreover, logistic regression analysis was performed to assess the contribution of a certain genotype to MI. ORs and 95% CIs were calculated to determine the strength of the association between SNPs and MI. Multivariate analysis was conducted after adjustment for age, gender, smoking, drinking status, BMI, SBP, DBP, FPG, TG, TC, Uric acid, HDL-C, LDL-C, BUN, Cr. All statistical analyses were performed with using SPSS version 22.0 for Windows (SPSS Inc., USA), and statistical significance was established at an alpha level of 0.05.
ACKNOWLEDGMENTS AND FUNDING
This work was supported by grants from Natural science foundation of China grant (81470468), Graduate Research Innovation Project in Xinjiang (XJGRI2015064), Natural science foundation of Xinjiang (2015211C0092), and State Key Laboratory Incubation Base of Xinjiang Major Diseases Research Fund (SKLIB-XJMDR-2012-3).
CONFLICTS OF INTEREST
The authors declare no competing financial interests.
Authors’ contribution
All authors contributed significantly to this work. J.T., Y.-T. W., M. A., Y.-N. W., X.-M. L., B.-D. C., F.L., C.-H. H., and H.-Y. L. performed the research study and collected the data; J.T., and X.X. analyzed the data; J.T. and Y.-T. M. designed the research study; J.T., and Y.-T. M. wrote the paper, and J.T. and Y.-T. W. prepared all the Tables. All authors reviewed the manuscript. In addition, all authors approved the final draft.
REFERENCES
1. Gale CP and Fox KA. International comparisons of acute myocardial infarction. Lancet. 2014; 383:1274-1276.
2. Celermajer DS, Chow CK, Marijon E, Anstey NM and Woo KS. Cardiovascular disease in the developing world: prevalences, patterns, and the potential of early disease detection. J Am Coll Cardiol. 2012; 60:1207-1216.
3. Takii T, Yasuda S, Takahashi J, Ito K, Shiba N, Shirato K and Shimokawa H. Trends in acute myocardial infarction incidence and mortality over 30 years in Japan: report from the MIYAGI-AMI Registry Study. Circ J. 2010; 74:93-100.
4. Ishihara M and Sato H. Thirty years trend in acute myocardial infarction during coronary angiography at a tertiary emergency center in Japan. J Cardiol. 2012; 59:243-248.
5. Havulinna AS, Paakkonen R, Karvonen M and Salomaa V. Geographic patterns of incidence of ischemic stroke and acute myocardial infarction in Finland during 1991-2003. Ann Epidemiol. 2008; 18:206-213.
6. Zhang L, Desai NR, Li J, Hu S, Wang Q, Li X, Masoudi FA, Spertus JA, Nuti SV, Wang S, Krumholz HM and Jiang L. National Quality Assessment of Early Clopidogrel Therapy in Chinese Patients With Acute Myocardial Infarction (AMI) in 2006 and 2011: Insights From the China Patient-Centered Evaluative Assessment of Cardiac Events (PEACE)-Retrospective AMI Study. J Am Heart Assoc. 2015; 4. DOI: 10.1161/JAHA.115.001906
7. Anand SS, Islam S, Rosengren A, Franzosi MG, Steyn K, Yusufali AH, Keltai M, Diaz R, Rangarajan S and Yusuf S. Risk factors for myocardial infarction in women and men: insights from the INTERHEART study. Eur Heart J. 2008; 29:932-940.
8. Marenberg ME, Risch N, Berkman LF, Floderus B and de Faire U. Genetic susceptibility to death from coronary heart disease in a study of twins. N Engl J Med. 1994; 330:1041-1046.
9. Xiang X, Ma YT, Fu ZY, Yang YN, Xiang M, Chen BD, Wang YH and Fen L. Haplotype analysis of the CYP8A1 gene associated with myocardial infarction. Clin Appl Thromb Hemost. 2009; 15:574-580.
10. Kallel A, Sediri Y, Sbai MH, Mourali MS, Feki M, Elasmi M, Taieb SH, Sanhaji H, Souheil O, Mechmeche R, Jemaa R and Kaabachi N. The paraoxonase L55M and Q192R gene polymorphisms and myocardial infarction in a Tunisian population. Clin Biochem. 2010; 43:1461-1463.
11. Yamada Y, Izawa H, Ichihara S, Takatsu F, Ishihara H, Hirayama H, Sone T, Tanaka M and Yokota M. Prediction of the risk of myocardial infarction from polymorphisms in candidate genes. N Engl J Med. 2002; 347:1916-1923.
12. Felician G, Collesi C, Lusic M, Martinelli V, Ferro MD, Zentilin L, Zacchigna S and Giacca M. Epigenetic modification at Notch responsive promoters blunts efficacy of inducing notch pathway reactivation after myocardial infarction. Circ Res. 2014; 115:636-649.
13. Li C, He J, Gao Y, Xing Y, Hou J and Tian J. Preventive effect of total flavones of Choerospondias axillaries on ischemia/reperfusion-induced myocardial infarction-related MAPK signaling pathway. Cardiovasc Toxicol. 2014; 14:145-152.
14. Torina AG, Reichert K, Lima F, de Souza Vilarinho KA, de Oliveira PP, do Carmo HR, de Carvalho DD, Saad MJ, Sposito AC and Petrucci O. Diacerein improves left ventricular remodeling and cardiac function by reducing the inflammatory response after myocardial infarction. PLoS One. 2015; 10:e0121842.
15. Moon RT, Kohn AD, De Ferrari GV and Kaykas A. WNT and beta-catenin signalling: diseases and therapies. Nat Rev Genet. 2004; 5:691-701.
16. Huelsken J and Behrens J. The Wnt signalling pathway. J Cell Sci. 2002; 115:3977-3978.
17. Jones SE and Jomary C. Secreted Frizzled-related proteins: searching for relationships and patterns. Bioessays. 2002; 24:811-820.
18. Akiyama T. Wnt/beta-catenin signaling. Cytokine Growth Factor Rev. 2000; 11:273-282.
19. Neumann J, Schaale K, Farhat K, Endermann T, Ulmer AJ, Ehlers S and Reiling N. Frizzled1 is a marker of inflammatory macrophages, and its ligand Wnt3a is involved in reprogramming Mycobacterium tuberculosis-infected macrophages. FASEB J. 2010; 24:4599-4612.
20. Brade T, Manner J and Kuhl M. The role of Wnt signalling in cardiac development and tissue remodelling in the mature heart. Cardiovasc Res. 2006; 72:198-209.
21. van Gijn ME, Daemen MJ, Smits JF and Blankesteijn WM. The wnt-frizzled cascade in cardiovascular disease. Cardiovasc Res. 2002; 55:16-24.
22. Rahman MF, Hashad IM, Abou-Aisha K, Abdel-Maksoud SM and Gad MZ. Addressing the link between paraoxonase-1 gene variants and the incidence of early onset myocardial infarction. Arch Med Sci. 2015; 11:513-520.
23. Barandon L, Couffinhal T, Ezan J, Dufourcq P, Costet P, Alzieu P, Leroux L, Moreau C, Dare D and Duplaa C. Reduction of infarct size and prevention of cardiac rupture in transgenic mice overexpressing FrzA. Circulation. 2003; 108:2282-2289.
24. Liu Y, El-Serag HB, Jiao L, Lee J, Moore D, Franco LM, Tavakoli-Tabasi S, Tsavachidis S, Kuzniarek J, Ramsey DJ and White DL. WNT signaling pathway gene polymorphisms and risk of hepatic fibrosis and inflammation in HCV-infected patients. PLoS One. 2013; 8:e84407.
25. Rogler A, Hoja S, Socher E, Nolte E, Wach S, Wieland W, Hofstadter F, Goebell PJ, Wullich B, Hartmann A and Stoehr R. Role of two single nucleotide polymorphisms in secreted frizzled related protein 1 and bladder cancer risk. Int J Clin Exp Pathol. 2013; 6:1984-1998.
26. Hu X, Shang M, Zhou J, Ye Y, Lu X, Tao C, Ying B and Wang L. Association of genetic variants in Wnt signaling pathway with tuberculosis in Chinese Han population. PLoS One. 2014; 9:e93841.
27. Baurand A, Zelarayan L, Betney R, Gehrke C, Dunger S, Noack C, Busjahn A, Huelsken J, Taketo MM, Birchmeier W, Dietz R and Bergmann MW. Beta-catenin downregulation is required for adaptive cardiac remodeling. Circ Res. 2007; 100:1353-1362.
28. Zhao X, Hua Y, Chen H, Yang H, Zhang T, Huang G, Fan H, Tan Z, Huang X, Liu B and Zhou Y. Aldehyde dehydrogenase-2 protects against myocardial infarction-related cardiac fibrosis through modulation of the Wnt/beta-catenin signaling pathway. Ther Clin Risk Manag. 2015; 11:1371-1381.
29. Wang S, Tian Y, Wu D, Zhu H, Luo D, Gong W, Zhou Y, Zhou J and Zhang Z. Genetic variation of CTNNB1 gene is associated with susceptibility and prognosis of gastric cancer in a Chinese population. Mutagenesis. 2012; 27:623-630.
30. Jia YM, Xie YT, Wang YJ, Han JY, Tian XX and Fang WG. Association of Genetic Polymorphisms in CDH1 and CTNNB1 with Breast Cancer Susceptibility and Patients’ Prognosis among Chinese Han Women. PLoS One. 2015; 10:e0135865.
31. Xu L, Corcoran RB, Welsh JW, Pennica D and Levine AJ. WISP-1 is a Wnt-1- and beta-catenin-responsive oncogene. Genes Dev. 2000; 14:585-595.
32. Chen J, Yin JY, Li XP, Wang Y, Zheng Y, Qian CY, He H, Fang C, Wang Z, Zhang Y, Xiao L, Wang SY, Zhang W, Zhou HH and Liu ZQ. Association of Wnt-Inducible Signaling Pathway Protein 1 Genetic Polymorphisms With Lung Cancer Susceptibility and Platinum-Based Chemotherapy Response. Clin Lung Cancer. 2015; 16:298-304 e291-292.
33. Urano T, Narusawa K, Shiraki M, Usui T, Sasaki N, Hosoi T, Ouchi Y, Nakamura T and Inoue S. Association of a single nucleotide polymorphism in the WISP1 gene with spinal osteoarthritis in postmenopausal Japanese women. J Bone Miner Metab. 2007; 25:253-258.
34. Yamada Y, Ando F and Shimokata H. Association of polymorphisms of SORBS1, GCK and WISP1 with hypertension in community-dwelling Japanese individuals. Hypertens Res. 2009; 32:325-331.
35. Sharma S, Tantisira K, Carey V, Murphy AJ, Lasky-Su J, Celedon JC, Lazarus R, Klanderman B, Rogers A, Soto-Quiros M, Avila L, Mariani T, Gaedigk R, Leeder S, Torday J, Warburton D, et al. A role for Wnt signaling genes in the pathogenesis of impaired lung function in asthma. Am J Respir Crit Care Med. 2010; 181:328-336.
36. Alexandrov LB, Nik-Zainal S, Wedge DC, Aparicio SA, Behjati S, Biankin AV, Bignell GR, Bolli N, Borg A, Borresen-Dale AL, Boyault S, Burkhardt B, Butler AP, Caldas C, Davies HR, Desmedt C, et al. Signatures of mutational processes in human cancer. Nature. 2013; 500:415-421.
37. Tan H, Bao J and Zhou X. Genome-wide mutational spectra analysis reveals significant cancer-specific heterogeneity. Sci Rep. 2015; 5:12566.
38. Koch W, Hoppmann P, Pfeufer A, Schomig A and Kastrati A. Toll-like receptor 4 gene polymorphisms and myocardial infarction: no association in a Caucasian population. Eur Heart J. 2006; 27:2524-2529.
39. Ruiz-Narvaez EA, Yang Y, Nakanishi Y, Kirchdorfer J and Campos H. APOC3/A5 haplotypes, lipid levels, and risk of myocardial infarction in the Central Valley of Costa Rica. J Lipid Res. 2005; 46:2605-2613.
40. Xie X, Ma YT, Yang YN, Fu ZY, Li XM, Huang D, Ma X, Chen BD and Liu F. Polymorphisms in the SAA1/2 gene are associated with carotid intima media thickness in healthy Han Chinese subjects: the Cardiovascular Risk Survey. PLoS One. 2010; 5:e13997.
41. An Y, Wang YT, Ma YT, Wulasihan M, Huang Y, Adi D, Yang YN, Ma X, Li XM, Xie X, Huang D, Liu F and Chen BD. IL-10 genetic polymorphisms were associated with valvular calcification in Han, Uygur and Kazak populations in Xinjiang, China. PLoS One. 2015; 10:e0128965.
42. Chobanian AV, Bakris GL, Black HR, Cushman WC, Green LA, Izzo JL, Jr., Jones DW, Materson BJ, Oparil S, Wright JT, Jr. and Roccella EJ. Seventh report of the Joint National Committee on Prevention, Detection, Evaluation, and Treatment of High Blood Pressure. Hypertension. 2003; 42:1206-1252.
43. Clinical Guidelines on the Identification, Evaluation, and Treatment of Overweight and Obesity in Adults—The Evidence Report. National Institutes of Health. Obes Res. 1998; 6 Suppl 2:51S-209S.
44. Diagnosis and classification of diabetes mellitus. Diabetes Care. 2010; 33 Suppl 1:S62-69.
45. Bild DE, Bluemke DA, Burke GL, Detrano R, Diez Roux AV, Folsom AR, Greenland P, Jacob DR, Jr., Kronmal R, Liu K, Nelson JC, O’Leary D, Saad MF, Shea S, Szklo M and Tracy RP. Multi-Ethnic Study of Atherosclerosis: objectives and design. Am J Epidemiol. 2002; 156:871-881.