
INTRODUCTION
Colorectal cancer (CRC) is the third most commonly diagnosed cancer (1.36 million cases) and the fourth highest cause of cancer deaths (0.7 million) worldwide [1]. Approximately three quarters of patients newly diagnosed with CRC exhibit localized disease that is amenable to curative surgical resection, whereas the remaining patients present with unresectable metastatic disease [2]. Furthermore, a substantial proportion of patients experience disease recurrence or metastatic disease after surgical resection. The prognosis of CRC patients with metastasis and/or recurrence has been improved by the use of various types of chemotherapeutic drugs including 5-fluorouracil, leucovorin, irinotecan, and oxaliplatin [2, 3]. However, the median overall survival (OS) still remains about 2 years [2]. Thus, an additional treatment modality is required for advanced CRC.
Accumulating evidence indicates the crucial involvement of inflammation in cancer progression and metastasis [3]. Inflammation is pathologically characterized by the presence of inflammatory cell infiltration, fibrosis ensuing from fibroblast accumulation, and angiogenesis [4]. Angiogenesis is presumed to promote cancer progression and metastasis by supplying cancer cells with oxygen and nutrients, which are indispensable for cancer cell growth [5]. As a consequence, an anti-vascular endothelial growth factor (VEGF) antibody is used to supplement cytotoxic chemotherapy for CRC [6]. However, the antibody can prolong OS of patients with metastatic CRC by only a few months [2]; therefore, additional targets need to be identified for the establishment of a therapy for advanced CRC.
Fibroblasts present in tumor tissues, designated as cancer-associated fibroblasts (CAFs), can provide cancer cells with scaffolds and growth factors to promote cancer cell growth [7]. For example, the contribution of CAF-derived growth factors has been documented in a mouse colitis-associated CRC model [8, 9]. We further revealed that in this model, a chemokine, CCL3, induces the accumulation of fibroblasts that express CCR5, a specific receptor for CCL3 [10]. Additionally, genetic deletion of the Ccr5 gene or in vivo overexpression of a dominant negative form of the CCR5 ligand, CCL5, attenuated tumor formation in this model together with reduced fibroblast accumulation. Furthermore, we observed that CCR5-deficient mice exhibited slower tumor growth than wild-type mice when a syngeneic mouse CRC cell line was injected either subcutaneously or orthotopically into the cecal wall [10]. Therefore, in this study we investigated the potential of a clinically utilized CCR5 antagonist, maraviroc, for the treatment of CRC in mouse pre-clinical models.
RESULTS
Orthotopic injection of a murine CRC cell line forms tumors in association with CCR5-expressing fibroblasts and CCL3-expressing granulocytes and macrophages
We previously demonstrated that tumor formation was significantly reduced in CCR5-deficient mice compared with WT mice when colon 26 cells were injected into the cecal wall [10]. These observations imply the possible involvement of the CCR5 axis in colon tumor progression. Hence, in the current study we inoculated colon 26 cells into the cecal wall of WT mice in order to delineate the molecular and cellular mechanisms underlying this phenomenon in more detail. Tumors were macroscopically evident 7 days after the injection and grew progressively (Figure 1A and 1B). We next determined the expression of CCR5 and its ligands in the tumor sites by quantitative reverse transcription-polymerase chain reaction (qRT-PCR) analysis. The expression of Ccr5 and its ligands, Ccl3 and Ccl4, but not Ccl5, were markedly increased in tumor sites 7 days after the injection (Figure 1C). Intratumoral CCL3 and CCL4 contents were also significantly increased at the protein level 15 days after the injection (Figure 1D). Furthermore, a double-color immunofluorescence analysis demonstrated that CCR5 was detected mainly in α-smooth muscle actin (SMA)-positive fibroblasts (Figure 1E). Flow cytometric analysis illustrated that CCL3 proteins were expressed in Ly6G-positive granulocytes and F4/80-positive macrophages but not in T cell receptor β chain (TCRβ)-positive T cells (Figure 1F).
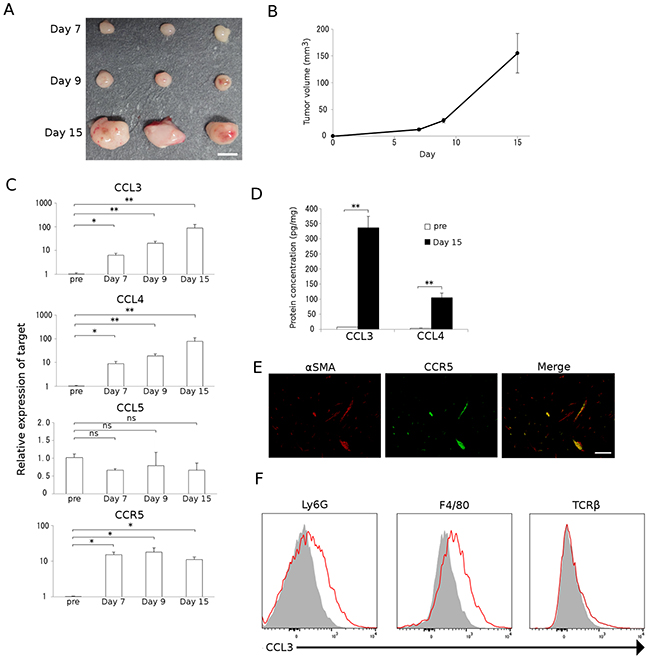
Figure 1: Colon carcinoma progression with CCL3-expressing resident stromal cell accumulation. A and B. A mouse colon adenocarcinoma cell line, colon 26, was injected into the cecal wall of WT mice as described in Materials and Methods. Tumors were resected at the indicated time intervals from the injection. Representative macroscopic appearance of tumors is shown in A. Tumor volumes were determined at the indicated time intervals. Mean and SD were calculated and are shown in B (n = 8). C. Expression of Ccr5 and its ligands in tumor tissues. Total RNAs were extracted from the tumor tissues obtained at the indicated time intervals and subjected to qRT-PCR to determine the mRNA expression of CCR5 and its ligands, CCL3, CCL4, and CCL5. Data represent the means and SEM (n = 5). Statistical significance was evaluated using one-way ANOVA, followed by Dunnett’s test. *p<0.05; **p<0.01; ns, not significant. D. CCL3 and CCL4 protein expression in tumor tissues. Tumor tissues were obtained at the indicated time intervals and the levels of CCL3 and CCL4 protein in the tumor tissue extracts were quantified using ELISA. Data represent the means and SEM (n = 6). p values were calculated using Mann-Whitney’s U test. **p<0.01. E. Double-color immunofluorescence analysis of CCR5-expressing cells using the combination of anti-CCR5 and anti-α-SMA antibodies. Representative results from 5 independent experiments are shown. The scale bar indicates 50 μm. F. Flow cytometry data of CCL3 expression by Ly6G-positive granulocytes, F4/80-positive macrophages, and TCRβ-positive T cells isolated from tumor tissues. Single cell suspensions were obtained from tumor tissues at 15 days after tumor inoculation and were subjected to flow cytometric analysis to determine the proportion of CCL3-expressing cells. Red lines and gray-filled histograms indicate the CCL3 expression and isotype-matched control, respectively. Representative results from three independent experiments are shown.
Maraviroc suppresses the tumor formation of a murine CRC cell line
The potential involvement of the CCR5 axis in colon tumor progression prompted us to investigate the effects of a CCR5 antagonist, maraviroc, on colon tumor progression induced by the injection of colon 26 cells into the cecal wall. Maraviroc treatment reduced tumor sizes by approximately half (Figure 2A and 2B). However, maraviroc treatment failed to induce massive necrosis and apoptosis in tumor cells (Figure 2C). Similar observations were obtained when maraviroc administration was instituted beginning at 8 days after the tumor injection (data not shown). Consistent with these findings, maraviroc exhibited few effects on the in vitro cell proliferation of colon 26 cells up to 100 μM (Figure 2D). These observations suggest that maraviroc might act on other types of cells present in tumor tissues rather than on the cancer cells themselves.
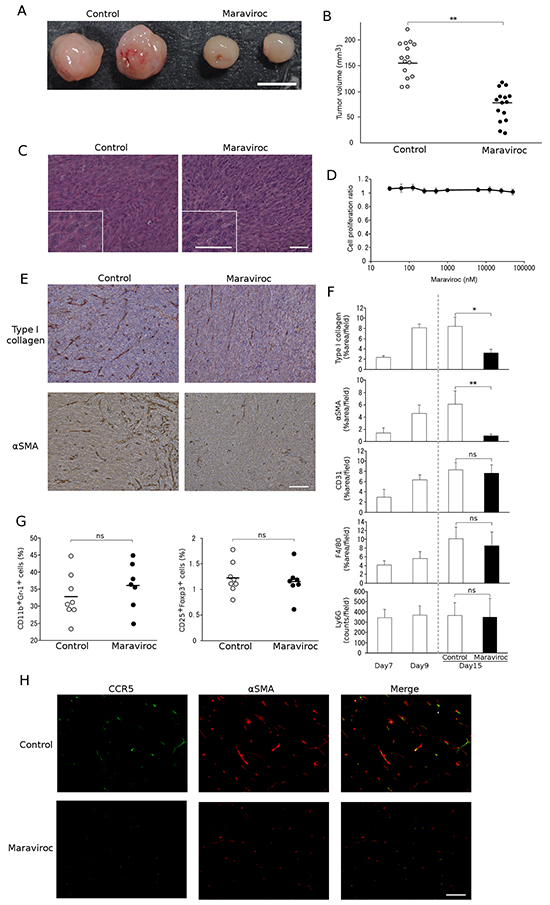
Figure 2: Effects of maraviroc on colon 26 cell tumor formation. A. and B. Maraviroc was orally administered to mice that had received an injection of colon 26 cells into the cecal wall as described in Materials and Methods. Tumors were resected at day 15 after the injection. Representative macroscopic appearances of tumors are shown in A. Tumor volumes were determined and each symbol in B indicates the tumor volume of each mouse. The mean value was calculated for each group (n = 15) and is shown with a bar. p values were calculated using Mann-Whitney’s U test. **p<0.01. C. Microscopic appearance of tumors. Tumors were resected at day 15 after the injection and were subjected to hematoxylin and eosin staining. Insets indicate high power magnification. Representative results from 5 individual animals are shown. The scale bar indicates 50 μm. D. Effects of maraviroc on the in vitro cell proliferation of colon 26 cells. In vitro cell proliferation was conducted in quadruplicate as described in Materials and Methods. The means and SD values were calculated and are as shown. E. and F. Tumor tissues were obtained at day 15 and subjected to immunohistochemical analysis using anti-Ly6G, anti-F4/80, anti-CD31, anti-type I collagen, or anti-α-SMA antibodies. Representative microscopic appearances of CAFs in tumor tissues are shown in E. The scale bar indicates 50 μm. Positive areas were determined as described in Materials and Methods. The means and SD values were calculated from 5 animals and are shown in F. Statistical significance was evaluated using one-way ANOVA, followed by Tukey-Kramer’s posthoc test. *p<0.05; **p<0.01; ns, not significant. G. Immunosuppressive cell infiltration into inoculated tumors. Single cell suspensions were obtained from tumor tissues at 15 days after tumor inoculation and subjected to flow cytometric analysis to determine the populations of CD11b+Gr-1+ MDSCs and CD25+Foxp3+ Tregs among the CD45 cells. Each symbol indicates a separate mouse. The mean value was calculated for each group (control: n = 8, Maraviroc: n = 7) and is shown with a bar. p values were calculated using Mann-Whitney’s U test. ns, not significant. H. Double-color immunofluorescence analysis of CCR5-expressing cells using anti-CCR5 and anti-α-SMA antibodies. Representative results from 5 independent experiments are shown. The scale bar indicates 50 μm.
Maraviroc suppresses fibroblast accumulation in tumors arising from the orthotopic injection of a murine CRC cell line
We next evaluated the effects of maraviroc on non-cancer cells present in tumor tissues, such as endothelial cells, fibroblasts, and leukocytes. Immunohistochemical analysis demonstrated that tumor tissues additionally contained CD31-positive endothelial cells and type I collagen- or α-SMA-positive fibroblasts. Furthermore, maraviroc significantly reduced type I collagen- and α-SMA-positive areas but not CD31-positive areas (Figure 2E and 2F). Infiltrating leukocytes were comprised mainly of Ly6G-positive granulocytes and F4/80-positive macrophages with a small number of CD3-positive lymphocytes (data not shown); however, maraviroc had few effects on these infiltrating leukocyte percentages (Figure 2F). Although CCR5 was detected in immunosuppressive cells [11, 12], maraviroc failed to change the intratumoral percentages of myeloid-derived suppressor cells (MDSCs) and regulatory T cells (Tregs), two major immunosuppressive cell types (Figure 2G). On the contrary, a double-color immunofluorescence analysis demonstrated that maraviroc reduced CCR5-expressing α-SMA-positive fibroblasts (Figure 2H). These observations imply that maraviroc reduced tumor formation mainly by acting on fibroblasts.
Maraviroc suppresses the migration of fibroblasts expressing epidermal growth factor (EGF)
Accumulating evidence indicates that CAFs are a rich source of various growth factors including hepatocyte growth factor (HGF), EGF, heparin-binding epidermal growth factor-like growth factor (HB-EGF), and epiregulin (EREG). Among these, only Egf mRNA expression was reduced by maraviroc treatment in tumor tissues (Figure 3A). In addition, a double-color immunofluorescence analysis revealed that EGF proteins were detected in α-SMA-positive cells and that maraviroc treatment reduced EGF-expressing and α-SMA-positive cells (Figure 3B). Furthermore, in vitro exposure to CCL3 enhanced cell migration and EGF expression in a mouse fibroblast cell line; this enhancement was abrogated by maraviroc treatment (Figure 3C and 3D). Although CCL3 marginally increased EGF expression, the effect of CCL3 on fibroblast migration was evident. These observations suggest that maraviroc primarily blocked the CCR5-induced intratumoral accumulation and subsequent activation of fibroblasts expressing EGF, an essential growth factor for CRC cells [13].
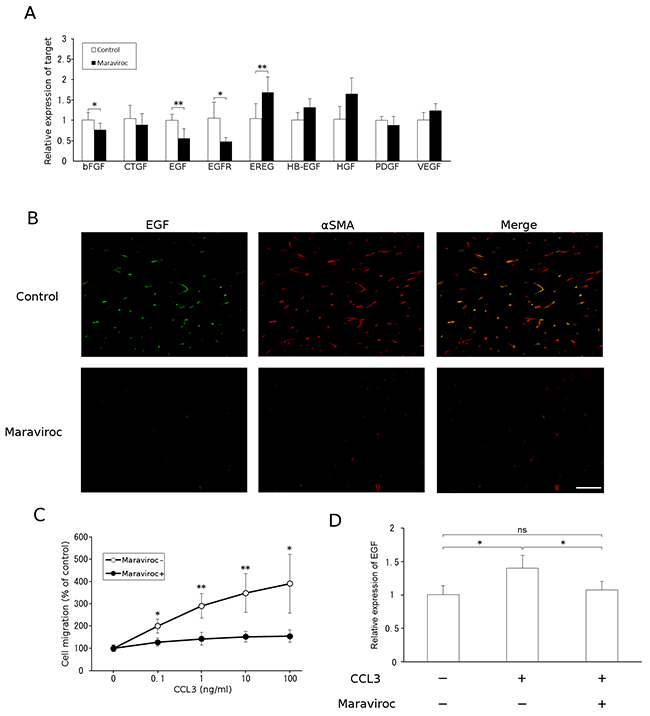
Figure 3: EGF expression by CAFs. A. Total RNAs were extracted from tumor tissues obtained at day 15 after the injection and subjected to qRT-PCR analysis to determine the expression of growth factors. The means and SD values were calculated from 5 animals and are as shown. p values were calculated using Mann-Whitney’s U test. *p<0.05; **p<0.01. B. Double-color immunofluorescence analysis of EGF-expressing cell was conducted with anti-EGF and anti-α-SMA antibodies. Representative results from 5 independent experiments are shown. The scale bar indicates 50 μm. C. Migration of fibroblasts in response to CCL3. Each value represents the means and SEM (n = 5). p values were calculated using Mann-Whitney’s U test. *p<0.05; **p<0.01. D. Effects of CCL3 on fibroblast EGF expression. NIH3T3 cells were treated with CCL3 in the presence or absence of maraviroc, as described in Materials and Methods. Total RNAs were extracted to determine Egf mRNA levels using qRT-PCR. The means and SD values were calculated from 8 independent experiments and are as shown. Statistical significance was evaluated using one-way ANOVA followed by Tukey-Kramer’s posthoc test. *p<0.05; ns, not significant.
Maraviroc suppresses the tumor formation of a human CRC cell line
To generalize the results obtained in the murine model, we next examined the effects of maraviroc on tumor formation induced by the injection of a human CRC cell line, KM12C, into the cecal wall. As for colon 26 cells, maraviroc treatment reduced xenotransplant tumor formation without inducing apparent necrosis in the tumor cells (Figure 4A and 4B). Consistent with these findings, maraviroc failed to inhibit the in vitro cell proliferation of KM12C cells up to 100 μM (Figure 4C), similarly to its observed lack of effect on colon 26 cells.
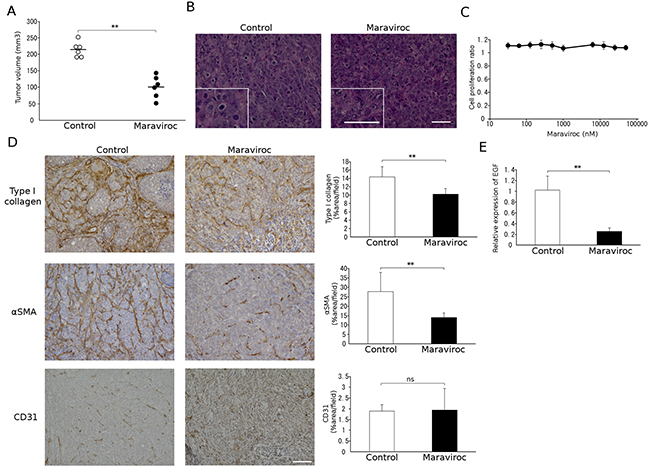
Figure 4: Effects of maraviroc on KM12C cell tumor formation. A. and B. Maraviroc was administered orally to mice that had received an injection of KM12C cells into the cecal wall. Tumors were resected at day 28 after the injection to determine tumor volumes. Each symbol indicates the tumor volume of an animal and the means of each group (n = 6) is indicated with a bar. p values were calculated using Mann-Whitney’s U test. **p<0.01. Representative microscopic appearance of hematoxylin and eosin-stained tumor tissues is shown in B; the insets indicate high power magnification. The scale bar indicates 50 μm. C. Effects of maraviroc on the in vitro cell proliferation of KM12C cells. In vitro cell proliferation was conducted in quadruplicate as described in Materials and Methods. The means and SD values were calculated and are as shown. D. Tumor tissues were obtained at day 28 after the injection and subjected to immunohistochemical analysis using anti-CD31, anti-type I collagen, or anti-α-SMA antibodies. Positive areas were determined. The means and SD values were calculated from 5 animals and are as shown. p values were calculated using Mann-Whitney’s U test. **p<0.01; ns, not significant. E. Total RNAs were extracted from tumor tissues obtained at day 28 after the injection and subjected to qRT-PCR analysis to detect Egf mRNA expression. The means and SD values were calculated from 5 animals and are as shown. The data were analyzed statistically using Mann-Whitney’s U test. **p<0.01.
Maraviroc suppresses fibroblast accumulation in tumors arising from the orthotopic injection of a human CRC cell line
We next examined the effects of maraviroc on the cell components in tumors arising from the injection of KM12C into the cecal wall. Maraviroc reduced intratumoral type I collagen- or α-SMA-positive fibroblast areas with few effects on CD31-positive areas (Figure 4D) or on Ly6G-positive granulocyte and F4/80-positive macrophage percentages in the tumor sites (data not shown). Furthermore, maraviroc treatment significantly attenuated mouse Egf mRNA expression (Figure 4E). Thus, maraviroc likely inhibits the tumor formation induced by the injection of a human CRC cell line into the cecal wall mainly by acting on CAFs.
DISCUSSION
Fibroblasts are a major cell component of the tumor microenvironment in various types of solid tumors [7]. Under homeostatic conditions, fibroblasts can act as a sentinel cell to restrict pre-malignant cell growth [14]. In contrast, CAFs can also contribute to tumor progression by providing cancer cells with growth factors [8, 9] and pro-inflammatory tumor-promoting microenvironments [15], and by inducing neovascularization [16]. Furthermore, stromal markers are robustly associated with disease relapse in human CRC, which can arise from an increased frequency of tumor-initiating cells enhanced by CAFs [17]. Thus, drug dampening CAFs might be able to supplement currently used anti-cancer treatments. We previously unraveled the crucial role of the CCL3-CCR5 axis in CAF accumulation in colitis-associated carcinogenesis and tumor formation arising from injection of the mouse CRC cell line colon 26 either underneath the skin or into the cecal wall [10]. Hence, in the current study we investigated the therapeutic effects of a CCR5 antagonist, maraviroc, on preclinical models using a mouse or a human CRC cell lines and demonstrated that maraviroc markedly attenuated tumor formation as well as CAF accumulation with few effects on infiltrating leukocyte numbers.
The identification of CCR5 as a crucial co-receptor for human immunodeficiency virus (HIV) [18] promoted the development of a CCR5 antagonist to be applied to the treatment of HIV infection. Maraviroc, the only CCR5 antagonist currently approved in various countries [19], binds to a site that is distinct from the proposed recognition sites for chemokines and the HIV glycoprotein gp120 [20]. The maraviroc binding site consists of 16 amino acids, 15 of which are common between mouse and human CCR5 proteins. Furthermore, several independent groups have successfully used maraviroc to inhibit the mouse CCR5 axis [21–27]. These observations incited us to utilize maraviroc in these pre-clinical studies.
Initial immunofluorescence analysis detected CCR5 expression in a subpopulation of T lymphocytes associated with certain immune reactions, particularly Th1 type reactions [28]. In addition, the interaction between CCR5 and its ligand, CCL5, recruits Tregs [11] and tumor-associated macrophages [29, 30] as well as increases the generation of MDSCs [12]. Thus, CCR5 blockade can counteract these immune suppressive cells to enhance tumor immunity and to eventually reduce tumor growth. However, CCR5 expression was barely detected in infiltrating lymphocytes and macrophages in our model and maraviroc did not markedly change the macrophage, Treg, and MDSC numbers. Thus, it is unlikely that maraviroc acted by reducing the infiltrating immunosuppressive cells to retard tumor growth in this model.
Several independent groups have observed that CCR5 was expressed by some types of cancer cells including breast [31], prostate [32], and gastric cancer [33]. Furthermore, in these studies, maraviroc directly inhibited the in vivo invasiveness of these cancer cells and reduced subsequent tumor progression. In contrast, CCR5 blockade was reported to enhance the in vivo proliferation of breast cancer cells bearing wild-type p53 [34]. Thus, the functionality of the CCR5 expressed by cancer cells remains elusive. Nevertheless, the lack of CCR5 expression in colon 26 or KM12C cells argues against the direct actions of maraviroc on cancer cells in our present preclinical models.
Another potential mechanism for the observed maraviroc-mediated tumor reduction in our model is suggested by the results from Ohshio et al., who administered a clinically used anti-fibrotic agent, tranilast, to tumor-bearing mice [35]. Several lines of evidence indicate that tranilast mainly interferes with the transforming growth factor (TGF)-β-mediated signaling pathway to inhibit fibrosis [36]. Tranilast was shown to significantly reduce CAFs but had only marginal effects on in vivo tumor growth [35]. Conversely, maraviroc treatment attenuated tumor growth as well as CAF number. In addition, maraviroc has been found to be well tolerated by patients with acquired immune deficiency syndrome without increasing the incidence of severe adverse effects [37]. Thus, several groups have proposed the use of maraviroc for the treatment of other diseases wherein CCR5 was presumed to be implicated [19]. Given the crucial roles of the CCR5 axis in CAF accumulation and function, maraviroc application might therefore also be useful in the treatment of cancers with an abundant number of CAFs.
MATERIALS AND METHODS
Mice
Specific pathogen-free female 7-week-old BALB/c mice (wild-type; WT mice) and male 7-week-old BALB/c-nu mice (nude mice) were purchased from Charles River Japan (Yokohama, Japan). All mice were maintained under specific pathogen-free conditions. All the animal experiments in this study were approved by the Committee on Animal Experimentation of Kanazawa University and complied with the Guideline for the Care and Use of Laboratory Animals of Kanazawa University.
Reagents and antibodies
Maraviroc was obtained from Sigma-Aldrich (St. Louis, MO, USA) (for in vitro experiments) or GlaxoSmithKline (Brentford, UK) (for in vivo experiments). Mouse CCL3 was obtained from Peprotech (Rocky Hill, NJ, USA). The following antibodies were used as the primary antibodies for immunohistochemical analyses: goat anti-CCR5 antibody (Santa Cruz Biotechnology, Dallas, TX, USA), rat anti-Ly6G antibody (BD Biosciences, San Jose, CA, USA), rat anti-F4/80 antibody (Serotec, Kidlington, UK), mouse anti-α-SMA antibody (Dako, Glostrup, Denmark), rabbit anti-type I collagen antibody, rabbit anti-CD31 antibody and rabbit anti-EGF antibody (Abcam, Cambridge, UK). The following rat anti-mouse antibodies were used as the primary antibodies for the flow cytometric analysis: anti-CD11b antibody (BD Biosciences), anti-CD25 antibody (BioLegend, San Diego, CA, USA), anti-CD45 antibody (eBioscience, San Diego, CA, USA), anti-F4/80 antibody (eBioscience), anti-Foxp3 antibody (eBioscience), anti-Ly6G antibody (Gr-1) (Tonbo Biosciences, San Diego, CA, USA), anti-MIP-1α antibody (R&D Systems, Minneapolis, MN, USA), anti-CCR5 antibody (BioLegend), and isotype-matched control IgGs for individual rat antibodies (BD Biosciences).
Cell lines
A murine CRC cell line, colon 26 (CRL-2638; American Type Culture Collection (ATCC), Manassas, VA, USA) and a human CRC cell line, KM12C (a gift from Dr. I. J. Fidler, M.D. Anderson Cancer Center) were maintained in RPMI 1640 medium supplemented with 10% fetal bovine serum (FBS). A mouse fibroblast cell line, NIH3T3 (CRL-6361; ATCC) was maintained in Dulbecco’s modified Eagle’s medium supplemented with 10% FBS. These cells were cultured at 37°C under 5% CO2.
In vitro cell proliferation of CRC cell lines
Cell suspensions (2 × 10³ cells /100 μl) were added to each well of 96-multi-well plates and incubated at 37°C for 24 h. The cells were then treated with the indicated concentrations of maraviroc for 72 h. The cell viability was determined using the cell counting kit-8 (Dojindo Co. Ltd., Kumamoto, Japan), which is based on the determination of the extracellular WST-8 reduction by NADH produced in the mitochondria resulting in soluble formazan. The ratios of cell proliferation were determined by comparison to the number of untreated cells.
In vitro experiments using NIH3T3 cells
Sub-confluent NIH3T3 cells were seeded at a cell density of 3 × 10⁵ cells/ml in each well of a 24-multi-well plate. After 24 h later, the cells were treated with 100 nM maraviroc for 1 h. Thereafter, mouse CCL3 was added to each well at 100 ng/ml. The cells were harvested to extract total RNA at 6 h after the addition of CCL3 as described below. The resultant total RNA was subjected to qRT-PCR. For in vitro cell migration analysis, the indicated concentrations of mouse CCL3 and 50,000 cells were placed in the lower and upper chambers of 24-well trans-well chambers (8 μM pore size; Costar, Cambridge, MA, USA), respectively, in the presence or absence of 100 nM maraviroc, and were incubated at 37°C for 24 h in 5% CO2. After gently removing the upper chambers, the numbers of cells that had passed to the lower chambers were counted.
Orthotopic tumor formation
Subconfluent colon 26 and KM12C cells were collected and resuspended in Hank’s balanced salt solution at a cell density of 1.25 × 10⁶ and 2.5 × 10⁷ cells/ml, respectively. The cell viability was confirmed to be always >95% using a trypan blue exclusion test. Prior to surgery, mice were anesthetized by an intraperitoneal injection of reagent containing medetomidine (0.3 mg/kg), midazolam (4 mg/kg), and butorphanol (5 mg/kg). A small incision was made along the midline of the abdomen and the cecum was exteriorized. Then, 40 μl cell suspensions of colon 26 and KM12C cells were injected into the cecal wall of WT and nude mice, respectively, using a 30-gauge needle. After surgery, the abdominal muscle wall was closed using surgical silk sutures. Mice also received an intraperitoneal injection of the anti-medetomidine inhibitor, atipamezole (0.3 mg/kg). From 2 days after the tumor injection, mice were administered maraviroc at a dose of 30 mg/kg every 2 days. At the indicated time intervals from the inoculation, cecum was removed for the determination of tumor volume, immunohistochemical analysis, and total RNA extraction followed by qRT-PCR. Tumor volumes were calculated according to the following equation: π × a × b × c/6, where a, b, and c indicate the width, depth, and height of the tumor, respectively.
Histological and immunohistochemical analysis
Resected tumor tissues were fixed in 10% formaldehyde and embedded in paraffin. The sections were cut at 4-μm thickness and stained with hematoxylin and eosin solution. In parallel, 5-μm-thick sections were generated for immunohistochemical analysis. For antigen retrieval of paraffin sections, the deparaffinized slides were either autoclaved in 10 μM citrate buffer (pH 6.0) for 15 min at 121°C (for staining with anti-type I collagen, anti-CD31 or anti-α-SMA), treated with 0.1% proteinase K solution for 15 min at 37°C (for staining with anti-EGF or anti-CCR5), or treated with 0.1% trypsin solution for 15 min at 37°C (for staining with anti-F4/80 or anti-Ly6G). Endogenous peroxidase activity was blocked using 0.3% H2O2 for 15 min, followed by incubation with Blocking One Histo (Dako Japan, Kyoto) for 15 min. The sections were further incubated with the optimal dilution of the antibodies overnight in a humidified box at 4°C. The resultant immune complexes were detected by the ABC Elite kit (Vector Laboratories, Burlingame, CA, USA) and peroxidase substrate 3-3′-diaminobenzidine kit (Vector), according to the manufacturer’s instructions. Positive signals or areas were measured on 5 randomly chosen visual fields at ×100 magnification by means of Image J (National Institutes of Health, Bethesda, MD, USA). For double-color immunofluorescence analysis, Alexa Fluor 594 donkey anti-mouse, Alexa Fluor 488 donkey anti-goat antibody, or Alexa Fluor 488 donkey anti-rabbit antibody (Invitrogen, Carlsbad, CA, USA) were used as secondary antibodies. Immunofluorescence was visualized on a KEYENCE BZ-X710 fluorescence microscope (Osaka, Japan).
qRT-PCR analysis
Total RNAs were extracted from the cell lines or tumors using the RNeasy Mini Kit (Qiagen, Venlo, The Netherlands). After treatment with RNase-free DNase I (Qiagen), 2 μg total RNA was reverse-transcribed using the SuperScript III First-Strand Synthesis System (Invitrogen) to obtain cDNA. qPCR was performed on the obtained cDNA using the StepOne real-time PCR system (Applied Biosystems, Foster City, CA, USA) using the Quantifast SYBR Green PCR Master mix (Applied Biosystems) and the primers listed in Table 1. Expression levels of the target genes were analyzed using the ΔΔCT comparative threshold method. The glyceraldehyde-3-phosphate dehydrogenase (Gapdh) gene was used as an internal control.
Table 1: Nucleotide sequence of the primers used for qRT-PCR
Gene name |
Species |
Size |
Forward primer (5′-3′) |
Reverse primer (5′-3′) |
Gapdh |
mouse |
55 |
catggccttccgtgttccta |
gcggcacgtcagatcca |
Ccr5 |
mouse |
61 |
catccgttccccctacaaga |
ggaactgacccttgaaaatcca |
Ccl3 |
mouse |
57 |
gctgacaagctcaccctctgt |
ggcagtggtggagaccttca |
Ccl4 |
mouse |
57 |
cagcaccaatgggctctga |
gccgggaggtgtaagagaaac |
Ccl5 |
mouse |
80 |
tccaatcttgcagtcgtgtttg |
tctgggttggcacacacttg |
Fgfb |
mouse |
127 |
gacccacacgtcaaactacaactc |
ctgtaacacacttagaagccagcag |
Ctgf |
mouse |
232 |
ggtgagtccttccaaagcag |
ggccaaatgtgtcttccagt |
Egf |
mouse |
111 |
tgcctcagaaggagtgggtta |
gtgttccaagcgttcctgaga |
Egfr |
mouse |
204 |
gaactgggcttagggaactgc |
cattgggacagcttggatcac |
Ereg |
mouse |
166 |
taccgccttagttcagatgg |
acatcgcagaccagtgtagc |
Hb-egf |
mouse |
111 |
gcaaatgcctccctggttac |
ctacagccaccacagccaaga |
Hgf |
mouse |
57 |
tcggataggagccacaagga |
ccgaggccagctgcaat |
Pdgf |
mouse |
154 |
gcaccaacgccaacttcct |
atgggcttctttcgcacaat |
Vegf |
mouse |
234 |
ctactgccgtccgattgaga |
catctgctgtgctgtaggaag |
Flow cytometry
Tumor tissues were obtained from the cecum. After removing the epithelial cells, the tissues were further cut into small pieces and incubated with RPMI 1640 containing 1 mg/ml collagenase type I and 40 μg/ml DNase I for 20 min at 37°C with shaking for 180 rpm. The resulting digestion mixtures were filtered through a 100-μm cell strainer (Corning, Cambridge, MA, USA) to achieve single cell suspensions. Isolated single cell suspensions were stained with various combinations of fluorescent dye-conjugated antibodies in MACS buffer. For intracellular MIP-1α/CCL3 staining, isolated single cell suspensions were incubated in serum-free RPMI 1640 medium supplemented with 0.1% GolgiStop reagent (BD) for 4 h. Subsequently, intracellular CCL3 was stained with PE-conjugated anti-CCL3 antibody assisted by an Intracellular Cytokine Staining Starter kit (BD). Intracellular staining for Foxp3 was performed using a Foxp3 Staining kit (BD). Expression of each molecule was determined using FACSCanto II (BD) and analyzed with FlowJo software (Tree Star, Ashland, OR, USA).
Enzyme-linked immunosorbent assay (ELISA)
The tissues collected at the indicated time intervals were homogenized with a lysis buffer (20 mM Tris-HCl, pH 7.6; 150 mM NaCl; 1% Triton; and 1 mM EDTA) containing Complete Protease Inhibitor Cocktail (Roche-Diagnostics, Roswell, GA, USA). Homogenates were centrifuged to obtain protein lysates. After the determination of protein concentration using the BCA Protein Assay kit (Pierce, Rockford, IL, USA), CCL3 and CCL4 levels were measured in the protein lysates using the specific ELISA kits (R&D Systems), according to the manufacturer’s instructions.
Statistical analysis
The data were statistically analyzed using the methods indicated in each figure legend. p values less than 0.05 were considered statistically significant.
CONFLICTS OF INTEREST
No potential conflicts of interest were disclosed.
GRANT SUPPORT
This work was supported by a Grant-in-Aid for Young Scientists (B) 15K18406 from the Japan Society for the Promotion of Science (JSPS).
REFERENCES
1. Ferlay J, Soerjomataram I, Dikshit R, Eser S, Mathers C, Rebelo M, Parkin DM, Forman D and Bray F. Cancer incidence and mortality worldwide: sources, methods and major patterns in GLOBOCAN 2012. Int J Cancer. 2015; 136:E359-386.
2. Gustavsson B, Carlsson G, Machover D, Petrelli N, Roth A, Schmoll HJ, Tveit KM and Gibson F. A review of the evolution of systemic chemotherapy in the management of colorectal cancer. Clin Colorectal Cancer. 2015; 14:1-10.
3. Hanahan D and Weinberg RA. Hallmarks of cancer: the next generation. Cell. 2011; 144:646-674.
4. Stockmann C, Schadendorf D, Klose R and Helfrich I. The impact of the immune system on tumor: angiogenesis and vascular remodeling. Front Oncol. 2014; 4:69.
5. Folkman J. Angiogenesis. Annu Rev Med. 2006; 57:1-18.
6. Pietrantonio F, Orlandi A, Inno A, Da Prat V, Spada D, Iaculli A, Di Bartolomeo M, Morosi C and de Braud F. Bevacizumab-based neoadjuvant chemotherapy for colorectal cancer liver metastases: Pitfalls and helpful tricks in a review for clinicians. Crit Rev Oncol Hematol. 2015; 95:272-281.
7. Servais C and Erez N. From sentinel cells to inflammatory culprits: cancer-associated fibroblasts in tumour-related inflammation. J Pathol. 2013; 229:198-207.
8. Koliaraki V, Roulis M and Kollias G. Tpl2 regulates intestinal myofibroblast HGF release to suppress colitis-associated tumorigenesis. J Clin Invest. 2012; 122:4231-4242.
9. Neufert C, Becker C, Tureci O, Waldner MJ, Backert I, Floh K, Atreya I, Leppkes M, Jefremow A, Vieth M, Schneider-Stock R, Klinger P, Greten FR, Threadgill DW, Sahin U and Neurath MF. Tumor fibroblast-derived epiregulin promotes growth of colitis-associated neoplasms through ERK. J Clin Invest. 2013; 123:1428-1443.
10. Sasaki S, Baba T, Shinagawa K, Matsushima K and Mukaida N. Crucial involvement of the CCL3-CCR5 axis-mediated fibroblast accumulation in colitis-associated carcinogenesis in mice. Int J Cancer. 2014; 135:1297-1306.
11. Schlecker E, Stojanovic A, Eisen C, Quack C, Falk CS, Umansky V and Cerwenka A. Tumor-infiltrating monocytic myeloid-derived suppressor cells mediate CCR5-dependent recruitment of regulatory T cells favoring tumor growth. J Immunol. 2012; 189:5602-5611.
12. Zhang Y, Lv D, Kim HJ, Kurt RA, Bu W, Li Y and Ma X. A novel role of hematopoietic CCL5 in promoting triple-negative mammary tumor progression by regulating generation of myeloid-derived suppressor cells. Cell Res. 2013; 23:394-408.
13. Dube PE, Yan F, Punit S, Girish N, McElroy SJ, Washington MK and Polk DB. Epidermal growth factor receptor inhibits colitis-associated cancer in mice. J Clin Invest. 2012; 122:2780-2792.
14. Flaberg E, Markasz L, Petranyi G, Stuber G, Dicso F, Alchihabi N, Olah E, Csizy I, Jozsa T, Andren O, Johansson JE, Andersson SO, Klein G and Szekely L. High-throughput live-cell imaging reveals differential inhibition of tumor cell proliferation by human fibroblasts. Int J Cancer. 2011; 128:2793-2802.
15. Erez N, Truitt M, Olson P, Arron ST and Hanahan D. Cancer-Associated Fibroblasts Are Activated in Incipient Neoplasia to Orchestrate Tumor-Promoting Inflammation in an NF-kappaB-Dependent Manner. Cancer Cell. 2010; 17:135-147.
16. Orimo A, Gupta PB, Sgroi DC, Arenzana-Seisdedos F, Delaunay T, Naeem R, Carey VJ, Richardson AL and Weinberg RA. Stromal fibroblasts present in invasive human breast carcinomas promote tumor growth and angiogenesis through elevated SDF-1/CXCL12 secretion. Cell. 2005; 121:335-348.
17. Calon A, Lonardo E, Berenguer-Llergo A, Espinet E, Hernando-Momblona X, Iglesias M, Sevillano M, Palomo-Ponce S, Tauriello DV, Byrom D, Cortina C, Morral C, Barcelo C, et al. Stromal gene expression defines poor-prognosis subtypes in colorectal cancer. Nat Genet. 2015; 47:320-329.
18. Samson M, Libert F, Doranz BJ, Rucker J, Liesnard C, Farber CM, Saragosti S, Lapoumeroulie C, Cognaux J, Forceille C, Muyldermans G, Verhofstede C, Burtonboy G, et al. Resistance to HIV-1 infection in caucasian individuals bearing mutant alleles of the CCR-5 chemokine receptor gene. Nature. 1996; 382:722-725.
19. Woollard SM and Kanmogne GD. Maraviroc: a review of its use in HIV infection and beyond. Drug Des Devel Ther. 2015; 9:5447-5468.
20. Tan Q, Zhu Y, Li J, Chen Z, Han GW, Kufareva I, Li T, Ma L, Fenalti G, Li J, Zhang W, Xie X, Yang H, et al. Structure of the CCR5 chemokine receptor-HIV entry inhibitor maraviroc complex. Science (New York, NY). 2013; 341:1387-1390.
21. Cipriani S, Francisci D, Mencarelli A, Renga B, Schiaroli E, D’Amore C, Baldelli F and Fiorucci S. Efficacy of the CCR5 antagonist maraviroc in reducing early, ritonavir-induced atherogenesis and advanced plaque progression in mice. Circulation. 2013; 127:2114-2124.
22. Ochoa-Callejero L, Perez-Martinez L, Rubio-Mediavilla S, Oteo JA, Martinez A and Blanco JR. Maraviroc, a CCR5 antagonist, prevents development of hepatocellular carcinoma in a mouse model. PLoS One. 2013; 8:e53992.
23. Perez-Martinez L, Perez-Matute P, Aguilera-Lizarraga J, Rubio-Mediavilla S, Narro J, Recio E, Ochoa-Callejero L, Oteo JA and Blanco JR. Maraviroc, a CCR5 antagonist, ameliorates the development of hepatic steatosis in a mouse model of non-alcoholic fatty liver disease (NAFLD). J Antimicrob Chemother. 2014; 69:1903-1910.
24. Amsellem V, Lipskaia L, Abid S, Poupel L, Houssaini A, Quarck R, Marcos E, Mouraret N, Parpaleix A, Bobe R, Gary-Bobo G, Saker M, Dubois-Rande JL, et al. CCR5 as a treatment target in pulmonary arterial hypertension. Circulation. 2014; 130:880-891.
25. Ward ST, Li KK, Hepburn E, Weston CJ, Curbishley SM, Reynolds GM, Hejmadi RK, Bicknell R, Eksteen B, Ismail T, Rot A and Adams DH. The effects of CCR5 inhibition on regulatory T-cell recruitment to colorectal cancer. Br J Cancer. 2015; 112:319-328.
26. Marciniak E, Faivre E, Dutar P, Alves Pires C, Demeyer D, Caillierez R, Laloux C, Buee L, Blum D and Humez S. The Chemokine MIP-1alpha/CCL3 impairs mouse hippocampal synaptic transmission, plasticity and memory. Sci Rep. 2015; 5:15862.
27. Baba T, Tanabe Y, Yoshikawa S, Yamanishi Y, Morishita S, Komatsu N, Karasuyama H, Hirao A and Mukaida N. MIP-1alpha/CCL3-expressing basophil-lineage cells drive the leukemic hematopoiesis of chronic myeloid leukemia in mice. Blood. 2016; 127:2607-2617.
28. Qin S, Rottman JB, Myers P, Kassam N, Weinblatt M, Loetscher M, Koch AE, Moser B and Mackay CR. The chemokine receptors CXCR3 and CCR5 mark subsets of T cells associated with certain inflammatory reactions. J Clin Invest. 1998; 101:746-754.
29. Robinson SC, Scott KA, Wilson JL, Thompson RG, Proudfoot AE and Balkwill FR. A chemokine receptor antagonist inhibits experimental breast tumor growth. Cancer Res. 2003; 63:8360-8365.
30. Laubli H, Spanaus KS and Borsig L. Selectin-mediated activation of endothelial cells induces expression of CCL5 and promotes metastasis through recruitment of monocytes. Blood. 2009; 114:4583-4591.
31. Velasco-Velazquez M, Jiao X, De La Fuente M, Pestell TG, Ertel A, Lisanti MP and Pestell RG. CCR5 antagonist blocks metastasis of basal breast cancer cells. Cancer Res. 2012; 72:3839-3850.
32. Sicoli D, Jiao X, Ju X, Velasco-Velazquez M, Ertel A, Addya S, Li Z, Ando S, Fatatis A, Paudyal B, Cristofanilli M, Thakur ML, Lisanti MP and Pestell RG. CCR5 receptor antagonists block metastasis to bone of v-Src oncogene-transformed metastatic prostate cancer cell lines. Cancer Res. 2014; 74:7103-7114.
33. Mencarelli A, Graziosi L, Renga B, Cipriani S, D’Amore C, Francisci D, Bruno A, Baldelli F, Donini A and Fiorucci S. CCR5 Antagonism by Maraviroc Reduces the Potential for Gastric Cancer Cell Dissemination. Translational oncology. 2013; 6:784-793.
34. Manes S, Mira E, Colomer R, Montero S, Real LM, Gomez-Mouton C, Jimenez-Baranda S, Garzon A, Lacalle RA, Harshman K, Ruiz A and Martinez AC. CCR5 expression influences the progression of human breast cancer in a p53-dependent manner. J Exp Med. 2003; 198:1381-1389.
35. Ohshio Y, Teramoto K, Hanaoka J, Tezuka N, Itoh Y, Asai T, Daigo Y and Ogasawara K. Cancer-associated fibroblast-targeted strategy enhances antitumor immune responses in dendritic cell-based vaccine. Cancer Sci. 2015; 106:134-142.
36. Darakhshan S and Pour AB. Tranilast: a review of its therapeutic applications. Pharmacol Res. 2015; 91:15-28.
37. Gagliardini R, Rossetti B, Bianco C, Rusconi S, Colafigli M, Prinapori R, Francisci D, Fantauzzi A, Orofino G, Vignale F, Di Giambenedetto S and De Luca A. Safety and therapeutic efficacy of the switch to maraviroc+darunavir/ritonavir in HIV/HCV coinfected patients: initial results from GUSTA study. J Int AIDS Soc. 2014; 17:19818.