
INTRODUCTION
Acute myeloid leukemia (AML) is the most common type of myeloid leukemia characterized by uncontrollable heterogeneous clonal disorder and accumulation of malignant haemopoietic progenitor cells in bone marrow and blood [1]. Currently, cytogenetics, molecular genetics and clinical studies, which are associated with pathogenesis of AML, provide useful guides for identifying patients’ prognosis information and better approaches to therapy [2, 3]. Identifying molecular markers contributes to differentiating patients’ risk and refining the prognosis of patients with AML [4].
Recently, significant attention has been paid to non-coding RNAs (ncRNAs), including microRNAs, long non-coding RNAs (LncRNAs), small interfering RNAs (siRNAs), pseudogenes, etc. [5]. It is being increasingly clear that ncRNAs play a functional role in diverse cellular processes, with their dysregulation already associated with origination and progression of cancers [6]. Pseudogenes were initially defined as unnecessary copies of coding genes by the fact that they lost the ability of coding functional protein due to gene mutations, a lack of transcription, or their inability to encode RNA [7]. Nowadays, accumulating evidence reveals that pseudogenes are associated with various diseases and functions, one of which is cancer development [7–9]. Pseudogenes may be strongly linked to oncogenic development and can be used as diagnostic and prognostic biomarkers in different human cancers [10]. Patients with gastric cancer (GC) are characterized by lower serum levels of PTENP1 pseudogene, which shows a diagnostic ability (AUC > 0.8) when compared with healthy controls [11]. Over-expression of SUMO1P3 pseudogene has also shown its ability for discriminating GC patients from patients with benign gastric disease [12], and its over-expression was also positively correlated with the state of bladder cancer [13]. Analogously, pseudogene INTS6P1 expression is high and steady in normal people compared with hepatocellular carcinoma (HCC) patients. Thepseudogene diagnostic value may be equal to that of alpha-fetal protein (AFP), the most common biomarker used in the diagnosis of HCC [14]. Besides being accurate diagnostic markers, pseudogenes also can be used as valuable prognostic markers to stratify cancer patients. For example, Hayashi et al. [15] showed that over-expressed OCT4-pg1 combined with genomic amplification like c-MYC can promote tumor cells’ proliferation and angiogenesis while inhibiting apoptosis. OCT4-pg1 amplification was positively correlated with associated with a decreased overall survival in gastric cancer. As another example, the pseudogene PTENP1 affected the post-transcriptional regulation of its parental gene (PTEN) through competition for PTEN-targeting miRNAs, and patients who did express PTENP1 showed a more favorable outcome compared to those who did not express PTENP1 in clear cell renal cell carcinoma [16]. Previous works strongly suggested that pseudogenes did not only help us to understand the cancer pathogenesis but also could serve as a new panel of useful biomarkers for cancers. Until now, several pseudogenes have been identified in normal and malignant hematopoietic cell [17, 18], but the function and the regulatory mechanisms of these pseudogenes for AML have not been defined in any studies yet.
BMI1 (Moloney murine leukemia virus integration site 1) is a polycomb ring finger oncogene involved in the regulation of p16 and p19, which are inhibitor genes for cell cycle progression [19]. Its expression plays a critical role in several signaling including wnt, akt, notch, hedgehog and receptor tyrosine kinase (RTK) pathway [20]. BMI1 is essential for efficient self-renewing and reconstituting activity of hematopoietic stem cells as well as leukemic stem cells and neural progenitors [21, 22]. Over-expression of BMI1 has been reported in a number of human malignancies, such as bladder, skin, prostate, breast, ovarian, colorectal as well as hematopoietic malignances [23], and its over-expression is associated with poor prognostic in these malignancies. BMI1 pseudogene, namely BMI1P1, located on human chromosomal band Xq12, which has high homology with BMI1, has barely been studied in any cancers. This study was aimed to investigate the BMI1P1 expression in de novo AML patients and to analyze its clinical relevance, whether it might serve as a biomarker for predicting disease prognostic.
RESULTS
BMI1P1 expression in normal controls and AML patients
In our experiment, the BMI1P1 mRNA level in normal controls ranges from 0.000 to 660.68 with a median level of 9.825. The level of BMI1P1 expression in AML cases (0–83.090, median 0.039) appears significantly down-regulated than control subjects (P < 0.001, Figure 1). In addition, down-regulated level of BMI1P1 expression, which is compared with its level in control subjects (P < 0.05 for each subtype, Table 1), was found in different AML subtypes. The typical electrophoresis results of RQ-PCR products are shown in Figure 2.
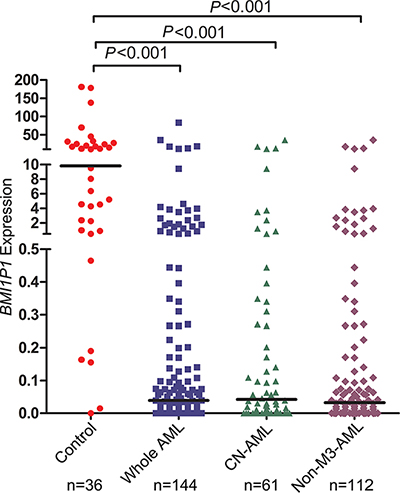
Figure 1: Relative expression levels of BMI1P1 in AML and controls. Expression of BMI1P1 in BMNCs was measured via using RQ-PCR in healthy controls, whole AML, CN-AML and non-M3-AML samples. Horizontal lines represent the median, and each dot represents an individual sample. Statistical analysis was performed using Wilcoxon tests, and significance was defined as P < 0.05.
Table 1: BMI1P1 expression level in different AML subtypes
Groups |
Subtypes and stages |
Subjects |
BMI1P1 expression |
P |
||
|---|---|---|---|---|---|---|
Number |
% |
Median |
Range |
|||
Total AML |
Total |
144 |
100 |
0.039 |
0–83.090 |
< 0.001 |
N = 144 |
FAB |
|
|
|
|
|
|
M0 |
1 |
0.7 |
0.000 |
— |
— |
|
M1 |
10 |
6.9 |
0.025 |
0–3.491 |
< 0.001 |
|
M2 |
52 |
36.1 |
0.040 |
0–12.191 |
< 0.001 |
|
M3 |
32 |
22.2 |
0.079 |
0–83.092 |
< 0.001 |
|
M4 |
29 |
20.1 |
0.030 |
0–35.430 |
< 0.001 |
|
M5 |
15 |
10.4 |
0.016 |
0–2.697 |
< 0.001 |
|
M6 |
5 |
3.5 |
0.169 |
0–17.308 |
0.018 |
WHO |
||||||
|
AML with t(8;21) |
9 |
6.3 |
0.031 |
0–3.833 |
< 0.001 |
|
APL with t(15;17) |
30 |
20.8 |
0.079 |
0–83.092 |
< 0.001 |
|
AML with 11q23 translocation |
1 |
0.7 |
0.013 |
— |
— |
|
AML without maturation |
9 |
6.3 |
0.021 |
0–3.491 |
< 0.001 |
|
AML with maturation |
42 |
29.2 |
0.046 |
0–12.791 |
< 0.001 |
|
Acute myelomonocytic leukemia |
29 |
20.1 |
0.030 |
0–35.430 |
< 0.001 |
|
Acute monoblastic and monocytic leukemia |
13 |
9.0 |
0.036 |
0–2.697 |
< 0.001 |
|
Acute erythroid leukemia |
4 |
2.8 |
0.101 |
0–17.308 |
0.046 |
Control |
|
36 |
100 |
9.825 |
0–660.68 |
— |
P: significance versus control.
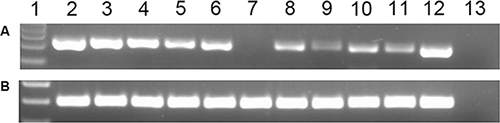
Figure 2: Electrophoresis results of RQ-PCR products in AML patients. lane 1: Gene RulerTM 100 bp DNA ladder; lane 2–3: The representative electrophoresis results of RQ-PCR products, which were randomly selected from 36 healthy controls, were loaded on lane 2–3; lane 4–11: The representative electrophoresis results of RQ-PCR products, which were randomly selected from 144 AML patients, were loaded on lane 4–11; lane 12: The cloned plasmid carrying BMI1P1 cDNA was constructed as positive control and the result was loaded on lane 12.; lane13: negative control. (A) BMI1P1; (B) ABL.
Differentiating value of BMI1P1 expression
A receiver operating characteristic curve was constructed to analyze the diagnostic accuracy of BMI1P1 expression. It revealed that BMI1P1 expression could serve as a valuable biomarker for distinguishing whole AML patients from control subjects (AUC = 0.895, 95% CI: 0.835–0.954, P < 0.001) (Figure 3A). At the cut-off value of 0.159, the sensitivity and the specificity were 71% and 92%, respectively. Moreover, the level of BMI1P1 expression might also function as a valuable biomarker in non-M3 AML (AUC = 0.906, 95% CI: 0.848–0.964, P < 0.001) (Figure 3B) and CN-AML (AUC = 0.886, 95% CI: 0.818–0.955, P < 0.001) (Figure 3C) according to ROC curves analysis.
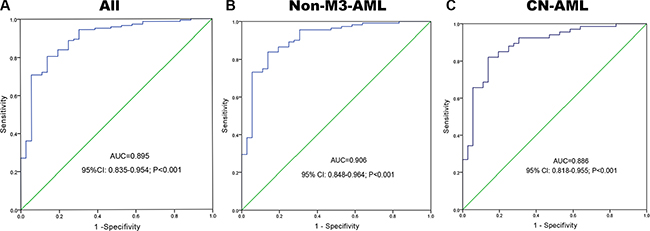
Figure 3: BMI1P1 expression offers a powerful diagnostic tool in identification of AML patients. (A) All patients; (B) non-M3-AML; (C) CN-AML. ROC analysis showed that the area under the curve (AUC) of BMI1P1 was 0.895 (P < 0.001), 0.906 (P < 0.001) and 0,886 (P < 0.001) in whole AML, non-M3-AML and CN-AML, respectively.
Clinical and laboratory characteristics of AML
This cohort of 144 AML patients was divided into low-expressed group (< 0.159) and high-expressed group (≥ 0.159) according to the cut off value of 0.159. Age, white blood cells (WBC), hemoglobin (HB), platelets (PLT), FAB or WHO classifications and karyotypes did not differ significantly between BMI1P1 low-expressed group and high-expressed group. We further investigated whether the level of BMI1P1 was associated with patients’ gene mutations. To test this hypothesis, we detected several gene mutations, such as C/EBPA, NPM1, FLT3 ITD, C-KIT, IDH1/2, DNMT3A and U2AF1. But we failed to find a significant correlation of gene mutations with BMI1P1 in these patients (data not shown). However, the rate of over-expression of BMI1P1 in female patients was significantly higher than that in male patients (P = 0.043). Also, the percentage of blasts in bone marrow (BM) was significantly lower in BMI1P1 high-expressed group versus low-expressed group (P = 0.008). BMI1P1 high-expressed cases had significantly higher complete remission (CR) than low-expressed cases (P = 0.023) (Table 2).
Table 2: Correlation between BMI1P1 expression and patients parameters
Patient’s parameters |
Status of BMI1P1 expression |
||
|---|---|---|---|
Low (n = 102) |
High (n = 42) |
P |
|
Sex, male/female |
63/39 |
18/24 |
0.043 |
Median age, years (range) |
55.5 (10–93) |
54.5 (15–85) |
0.919 |
Median hemoglobin, g/L (range) |
75.0 (34–142) |
74 (32–119) |
0.916 |
Median WBC, ×109/L (range) |
17.7 (0.8–528.0) |
8.2 (0.3–203.6) |
0.131 |
Median platelets, ×109/L (range) |
36.0 (3–447) |
47.5 (4–190) |
0.351 |
BM blasts, % (range) |
48.5 (3–97.5) |
28.0 (1–94) |
0.008 |
FAB |
|
|
0.339 |
M0 |
1 (1%) |
0 (0%) |
|
M1 |
6 (6%) |
4 (10%) |
|
M2 |
38 (37%) |
14 (33%) |
|
M3 |
20 (20%) |
12 (29%) |
|
M4 |
22 (22%) |
7 (17%) |
|
M5 |
13 (13%) |
2 (5%) |
|
M6 |
2 (2%) |
2 (5%) |
|
WHO |
|
|
0.800 |
AML with t(8;21) |
7 (7%) |
2 (5%) |
|
APL with t(15;17) |
19 (19%) |
11 (26%) |
|
AML with 11q23 translocation |
1 (1%) |
0 (0%) |
|
AML without maturation |
6 (6%) |
3 (7%) |
|
AML with maturation |
30 (29%) |
12 (29%) |
|
Acute myelomonocytic leukemia |
22 (22%) |
7 (17%) |
|
Acute monoblastic and monocytic leukemia |
11 (11%) |
2 (5%) |
|
Acute erythroid leukemia |
2 (2%) |
2 (5%) |
|
No data |
4 (4%) |
3 (7%) |
|
Karyotype classification |
|
|
0.707 |
Favorable |
25 (25%) |
13 (31%) |
|
Intermediate |
55 (54%) |
22 (52%) |
|
Poor |
13 (13%) |
4 (10%) |
|
No data |
9 (9%) |
3 (7%) |
|
Karyotype |
|
|
0.518 |
normal |
41 (40%) |
20 (48%) |
|
t(8;21) |
7 (7%) |
2 (5%) |
|
t(15;17) |
19 (19%) |
11 (26%) |
|
11q23 |
1 (1%) |
0 (0%) |
|
complex |
11 (11%) |
4 (10%) |
|
others |
15 (15%) |
2 (5%) |
|
No data |
8 (8%) |
3 (7%) |
|
Gene Mutation* |
|
|
|
C/EBPA (+/−) |
10/82 |
7/28 |
0.242 |
NPM1 (+/−) |
11/81 |
3/32 |
0.756 |
FLT3 ITD (+/−) |
15/77 |
1/34 |
0.068 |
C-KIT (+/−) |
3/89 |
0/35 |
0.561 |
CR(+/−) |
34/54 |
21/12 |
0.023 |
BMI1P1 transcript |
0.01 (0–0.14) |
1.48 (0.17–83.09) |
< 0.001 |
WBC, white blood cells; FAB, French-American-British classification; AML, acute myeloid leukaemia; CR, complete remission; *, percentage was equal to the number of mutated patients divided by total cases in each group.
Correlation between BMI1P1 expression and clinical outcome
115 AML patients with mean follow-up time of 7 months (range, 1–92 months) were included in survival analysis. Our research showed that the high level of BMI1P1 exhibited a positive impact on patients’ survival. Kaplan–Meier demonstrated that patients with low-expressed BMI1P1 had significantly shorter leukemia free survival (LFS, median 0 vs 6.5 months, respectively, P = 0.002) and overall survival (OS, median 5 vs 13 months, respectively, P < 0.001) than BMI1P1 high-expressed patients in the whole cohort of AML patients (Figure 4A, 4B). This favorable prognosis associated with BMI1P1 over-expression was also observed in the non-M3 cohort of AML patients (LFS, median 0 vs 3 months, respectively, P = 0.01; OS, median 10.5 vs 4 months, respectively, P = 0.011) (Figure 4C, 4D). However, we did not find that LFS and OS were obviously altered in the CN-AML group (Figure 4E, 4F). Multivariate analysis, applying age (≤ 60 y vs > 60 y), sex (male vs female), WBC (≥ 30 × 109/L vs < 30 × 109/L), HB (< 110 g/L vs ≥110 g/L), PLT (100×109/L vs 100 × 109/L), karyotype classifications (favorable vs intermediate vs poor), gene mutations (mutant vs wild-type) and BMI1P1 expression status (high vs low) as covariates, also showed that BMI1P1 over-expression was an independent favorable prognostic factor for OS in both whole and non-M3 cohort of AML patients (HR = 0.462, 95% CI = 0.243–0.879, P = 0.019 and HR = 0.483, 95% CI = 0.254–0.919, P = 0.027, Table 3). However, we failed to find that BMI1P1 was an independent favorable prognostic factor for LFS in the two above groups (data not shown). To further investigated whether levels of BMI1P1 factored in patients’ response to therapy, we monitored BMI1P1 levels of 26 patients with AML from the initial diagnosis to complete remission (Figure 5A). As we expected, the levels of BMI1P1 increased significantly from initial diagnosis to the post-CR (P < 0.001) (Figure 5B).
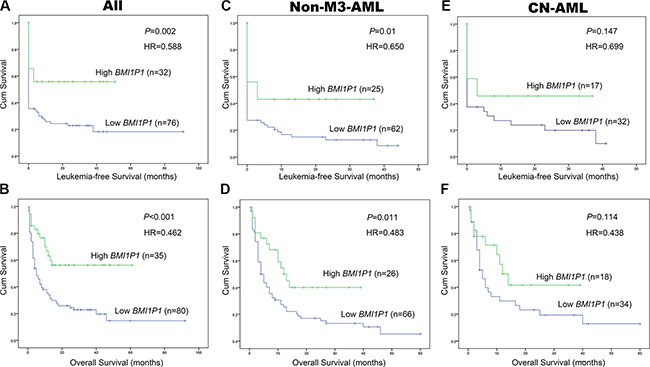
Figure 4: High level of BMI1P1 predicts favorable prognosis in AML. (A) LFS were investigated for whole AML patients according to expression of BMI1P1. (B) OS was investigated for whole AML patients according to expression of BMI1P1. (C) LFS was investigated for non-M3-AML patients according to expression of BMI1P1. (D) OS was investigated for non-M3-AML patients according to expression of BMI1P1. (E) LFS was investigated for CN-AML patients according to expression of BMI1P1. (F) OS was investigated for CN-AML patients according to expression of BMI1P1. Survival analysis was performed via Kaplan–Meier survival analysis, with differences between curves analyzed via a log-rank test. Significance was defined as P < 0. 05.
Table 3: Multivariate analyses of prognostic factors for overall survival in whole AML and non-M3 AML cases
Covariates |
whole AML |
non-M3 AML |
||
|---|---|---|---|---|
Hazard ratio (95% CI) |
P |
Hazard ratio (95% CI) |
P |
|
Sex |
1.246 (0.688–2.257) |
0.467 |
1.360 (0.764–2.423) |
0.296 |
Age |
1.346 (0.724–2.501) |
0.347 |
1.205 (0.614–2.364) |
0.588 |
WBC |
1.591 (0.966–2.623) |
0.068 |
1.406 (0.839–2.358) |
0.196 |
HB |
0.889 (0.355–2.225) |
0.801 |
0.862 (0.323–2.305) |
0.768 |
PLT |
1.132 (0.535–2.393) |
0.746 |
1.159 (0.551–2.439) |
0.697 |
Karyotype classifications |
4.049 (1.942–8.439) |
0.000 |
3.119 (1.113–8.738) |
0.030 |
BMI1P1 expression |
0.462 (0.243–0.879) |
0.019 |
0.483 (0.254–0.919) |
0.027 |
FLT3 mutation |
0.645 (0.299–1.393) |
0.265 |
0.654 (0.263–1.625) |
0.360 |
NPM1 mutation |
1.967 (0.837–4.622) |
0.121 |
1.473 (0.665–3.261) |
0.340 |
C/EBPA mutation |
0.634 (0.274–1.468) |
0.287 |
0.665 (0.280–1.582) |
0.357 |
C-KIT mutation |
1.876 (0.243–14.462) |
0.546 |
4.037 (0.519–31.406) |
0.183 |
IDH1 and IDH2 mutation |
7.663 (2.177–26.982) |
0.002 |
10.512 (2.914–37.916) |
0.000 |
DNMT3A mutation |
0.730 (0.276–1.930) |
0.526 |
0.783 (0.290–2.111) |
0.629 |
U2AF1 mutation |
1.727 (0.510–5.848) |
0.380 |
2.334 (0.702–7.758) |
0.166 |
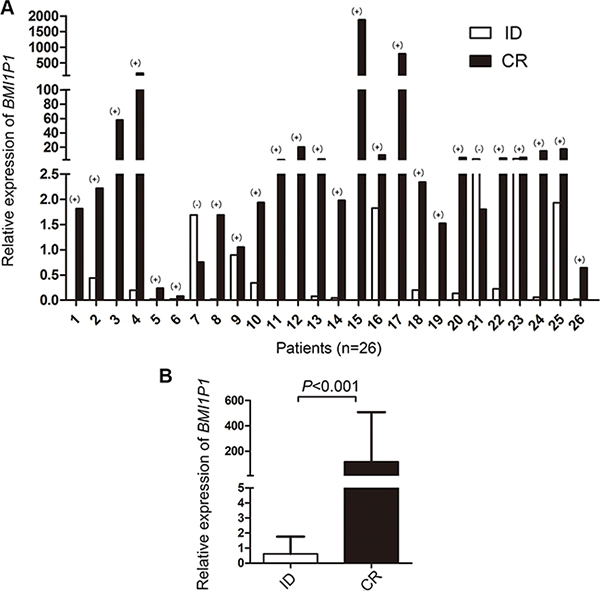
Figure 5: Changes of BMI1P1 expression in 26 AML patients. (A) The differential BMI1P1 levels in AML patients (n = 26) were measured by RQ-PCR from the initial diagnosis to complete remission. (+) and (–) indicates up-regulation and down-regulation, respectively. (B) BMI1P1 was up-regulated in 92% (24/26) of post-CR versus ID (P < 0.001), the statistical significance was found by using Wilcoxon tests. Significance was defined as P < 0.05.
DISCUSSION
Standard chemotherapy and hematopoietic stem cell transplantation are common therapeutic protocols for patients with AML. Approximately 90% of both t (8; 21) and inv (16) AML patients achieve a complete remission by accepting anthracycline- and cytarabine-based induction chemotherapy [24]. However, these therapeutic protocols on the elderly population or some special subtypes of AML are less well defined. In the present, personalized medicine in cancer treatment is favored and admired progressively. Patients who harbor different variation of the human genome in the cancer can be treated accordingly. A more detailed classification of the cancer genome and epigenome, thus, needs to be achieved in AML. To this end, karyotypes are frequently referred to as an essential tool for the recognition of distinct subtypes of AML and have helped to identify prognostic group. What is more, molecular markers like FLT3, C/EBPA, and NPM1 gene mutations also show strong correlation with prognosis as well as some common molecular lesions, such as DNA methyltransferase 3 alpha (DNMT3A) and isocitrate dehydrogenase 1/2 (IDH1/IDH2) [25, 26]. However, a classification solely based on karyotypes and pathological features has shown its limitations, and there are less than 30% AML patients owning gene mutations [27]. Similarly, our findings on gene mutations agree with this point, for the percentage of gene mutations including C/EBPA, NPM1, FLT3-ITD, C-KIT, IDH1/2, DNMT3A and U2AF1 was 13.4%, 11.0%, 12.6%, 2.4%, 5.6%, 7.9% and 3.9% in these patients, respectively. Therefore, more useful biomarkers are needed in clinical practices to divide this heterogeneous cohort of AML patients into multiple subtypes and offer guidance and evaluation in the treatment of each patient. Pseudogenes, which are highly homologous with their parental genes, are ideal candidates to sustain the expression of their parental genes by serving as competing endogenous RNAs (ceRNAs) which compete for the binding site of the same mRNAs [16, 28]. In addition, some could regulate the expression of functional genes by producing endogenous small interference RNAs (siRNAs) [29, 30] and antisense RNAs (asRNAs) [31, 32], and some even could encode functional proteins [33, 34]. It is speculated that pseudogenes can be the supplement to their parental genes via gene mutation in a particular position. Aberrant expression of pseudogenes can be used as diagnostic and prognostic biomarkers in human cancers [14–16]. In some cases, it has shown its higher diagnostic and prognostic trend than microRNAs and mRNAs [35]. Nevertheless, the expression levels and functions of pseudogenes in AML have been less studied.
BMI1(the parental gene of BMI1P1), a stem cell factor, was observed to be highly expressed in various types of human cancers [23, 36], including AML [37]. It was reported that BMI1 was essential for leukemic reprogramming of myeloid progenitor cells (BM blasts) into leukemic stem cells [38] and played a crucial role in regulating the proliferative activity of leukemic stem and progenitor cells [21]. In this study, BMI1P1 was found to be significantly down-regulated in de novo AML compared with healthy controls. This down-regulated level of BMI1P1 was also observed in different AML subtypes. To our knowledge, this is the first report about BMI1P1 expression in cancers. Our results also indicated that low BMI1P1 expression might be a prospective biomarker for screening AML, especially CN-AML and non-M3-AML from healthy controls by ROC curves analysis. Furthermore, our results indicated that patients with lower BMI1P1 expression had significantly higher BM blasts when compared with those with higher BMI1P1. BMI1P1 may be involved in the negatively regulation of BMI1 and leads to a decline of BM blasts in turn. More researches are needed to confirm this conjecture.
Our study further demonstrated that BMI1P1 high-expressed patients achieved significantly better OS, LFS and CR in both the entire AML cohort and non-M3-AML patients. We also revealed that the expression of BMI1P1 was an independent prognostic factor for OS in both whole and non-M3 cohort of AML patients according to multivariate analyses. As prognosis guides therapy, BMI1P1 may be a future therapeutic target. As we know, assessment of gene mutations in AML contributes to identifying subgroups with markedly superior outcome (e.g, mutant N PM1 [39] or C/EBPA [40]) and inferior outcome (e.g, mutant C-KIT [41], DNMT3A [27], FLT3 ITD [42], MLL/KMT2A [27] or WT1 [43]). To determine whether BMI1P1 correlates with gene mutations in patients with AML, we tested 7 kinds of these gene mutations. However, the differences in the impact of mutations of FLT3, NPM1, C/EBPA, C-KIT on outcome were not found, and we also failed to find a significant correlation of gene mutations with BMI1P1 in these patients. Interestingly, dynamic monitoring BMI1P1 level in 26 cases of patients revealed that BMI1P1 levels were significantly increased from the initial diagnosis to complete remission by mentioned therapeutic protocols. From the results above, we concluded that determination of BMI1P1 levels could be used as an important indicator of disease prognosis and evaluation of curative effect. Obviously, prospective studies on larger series of AML patients are needed to confirm and expand our findings.
Unfortunately, limited information is available to describe the function of BMI1P1, which has never been reported as a tumor suppressor in any human cancer. However, we showed that AML patients with a high BMI1P1 expression have a favorable outcome, suggesting that pseudogene BMI1P1 might be a tumor suppressor. Pseudogene transcripts can serve as competing endogenous RNAs (ceRNAs) to regulate its parental coding genes’ expression [44]. Because of their striking sequence homology, pseudogenes are the sequences that share multiple microRNA responsive elements (MREs) with their parental genes and that can compete with their parental coding genes for the binding site of shared microRNA molecules [10, 44]. Taken all together, BMI1P1 may be functional by mediating miRNA expression in AML. Over-expression of BMI1P1 transcripts may be expected to arrest the functions of oncomiRs targeting essential genes to cellular repression, through competitive binding to the oncomiRs and somehow resulting in suppression of AML. The next step is to design more additional studies, including in vitro and in vivo functional assays, stem cell-associated assays and the relationship between BMI1P1 and its parental coding gene, to assess mechanisms for potentially effects of pseudogene BMI1P1 for AML. In the future, prospective screening for BMI1P1 expression and BMI1P1-targeted intervention may shed new light on the classification and treatment of AML.
In conclusion, our study showed that pseudogene BMI1P1 was down-expressed in AML. Pseudogene BMI1P1 may serve a biomarker for detection of AML. Interestingly, BMI1P1 may serve as an important prognostic and initial treatment marker for AML.
MATERIALS AND METHODS
Patients and samples
The bone marrows collected from 180 samples, including 144 patients with de novo AML treated in the Affiliated People’ Hospital of Jiangsu University and 36 healthy donors regarded as normal controls after obtaining the written informed consent. All the patients were standardly diagnosed according to the French-America-British (FAB) and the World Health Organization (WHO) criteria [45, 46]. Treatment protocol was described in our previously reported work [47]. The main clinical and laboratory characteristics of the patient cohort were summarized in Table 1.
RNA isolation, reverse transcription and real-time quantitative PCR
Mononuclear cells from bone marrow samples were separated by Ficoll-Hypaque gradient. Total RNA from bone marrow mononuclear cells (BMNCs) was isolated by using Trizol reagent (Invitrogen, Carlsbad, CA, USA) according to the manufacturer’s instructions. Reverse transcription was performed on iCycler Thermal Cycler (Eppendorf, Hamburg, Germany) using reaction mixture containing 2 μg of total RNA, dNTPs 10 mM, random hexamers 10 μM, RNAsin 80 units, and 200 units of MMLV reverse transcriptase (MBI Fermentas, Hanover, USA) to synthesize cDNA. The system of reverse transcription was incubated for 10 min at 25°C, 60 min at 42°C, and then stored at –20°C.
BMI1P1 was amplified using the primers 5′-AGTGGTATCTGCTCACT-3′ (forward) and 5′-CCTCC ACAAAGCACACACAT-3′ (reverse) with expected products of 210 bp. Real-time quantitative PCR (RQ-PCR) reactions were performed on a 7500 Thermocycler (Applied Biosystems, CA, USA). Reactions mixture of 20 μL in each tube consisting of 0.25 μM of primers, 10 μL SYBR Premix Ex Taq II, 0.4 μL 50×ROX (TaKaRa, Japan) and 50 ng of cDNA. RQ-PCR was carried out at 95°C for 30 s, followed by 40 cycles at 95°C for 5 s, 63°C for 30 s, 72°C for 30 s, and 80°C for 30 s to collect fluorescence, finally followed by the melting program at 95°C for 15 s, 60°C for 60 s, 99°C for 15 s, and 60°C for 15 s. Negative and positive controls were involved in all assays. The abundance of BMI1P1 mRNA was estimated by housekeeping gene ABL (non-receptor tyrosine kinase). Relative levels of BMI1P1 expression were calculated according to the following equation: NBMI1P1 = (EBMI1P1) ΔCT BMI1P 1(control-sample) ÷ (EABL) ΔCT ABL (control-sample) ×1000‰. The parameter efficiency (E) derived from the formula E=10(-1/slope) (the slope referred to CT versus cDNA concentration plot).
Gene mutation detection
IDH1/2, DNMT3A and U2AF1 mutations were detected according to the literatures reported previously [48–51]. The detection of nucleophosmin (NPM1) and C-KIT mutations was performed by using PCR and high-resolution melting analysis (HRMA). All positive samples were confirmed by direct DNA sequencing. FLT3-ITD and C/EBPA were detected by direct DNA sequencing.
Statistical analysis
Statistical analyses were performed using the SPSS 18.0 software package (SPSS, Chicago, IL). Chi square test or Fisher exact test was used to compare the difference of qualitative data between patients groups. For comparison of quantitative data between groups; Kruskal-Wallis test (multiple groups) and Mann-Whitney U-test (two groups) were used. Receiver operating characteristic (ROC) curve and area under the ROC curve (AUC) were designed to assess the diagnostic value of BMI1P1 expression in discriminating AML patients from normal controls. Kaplan–Meier test and Cox regression analysis were applied to analyze the impact of BMI1P1 level on the prediction of survival in AML cases. For all analyses, a P value less than 0.05 (two-tail) was considered statistically significant.
ACKNOWLEDGMENTS AND FUNDING
This study was supported by National Natural Science foundation of China (81172592, 81270630), Science and Technology Special Project in Clinical Medicine of Jiangsu Province (BL2012056), 333 Project of Jiangsu Province (BRA2011085).
The authors thank Ziyue Zhang (Faculty of Applied Science, University of British Columbia) for editing the manuscript.
CONFLICTS OF INTEREST
None.
REFERENCES
1. Estey E, Dohner H. Acute myeloid leukaemia. Lancet. 2006; 368:1894–1907.
2. Showel MM, Levis M. Advances in treating acute myeloid leukemia. F1000Prime Rep. 2014; 6:96.
3. Brewin J, Horne G, Chevassut T. Genomic landscapes and clonality of de novo AML. N Engl J Med. 2013; 369:1472–1473.
4. Yohe S. Molecular Genetic Markers in Acute Myeloid Leukemia. J Clin Med. 2015; 4:460–478.
5. Groen JN, Capraro D, Morris KV. The emerging role of pseudogene expressed non-coding RNAs in cellular functions. Int J Biochem Cell Biol. 2014; 54:350–355.
6. Yang Q, Zhang RW, Sui PC, He HT, Ding L. Dysregulation of non-coding RNAs in gastric cancer. World J Gastroenterol. 2015; 21:10956–10981.
7. Xiao-Jie L, Ai-Mei G, Li-Juan J, Jiang X. Pseudogene in cancer: real functions and promising signature. J Med Genet. 2015; 52:17–24.
8. Pink RC, Wicks K, Caley DP, Punch EK, Jacobs L, Carter DR. Pseudogenes: pseudo-functional or key regulators in health and disease? RNA. 2011; 17:792–798.
9. De Martino M, Forzati F, Arra C, Fusco A, Esposito F. HMGA1-pseudogenes and cancer. Oncotarget. 2016; doi: 10.18632/oncotarget.7427.
10. Poliseno L, Marranci A, Pandolfi PP. Pseudogenes in Human Cancer. Front Med (Lausanne). 2015; 2:68.
11. Dong L, Qi P, Xu MD, Ni SJ, Huang D, Xu QH, Weng WW, Tan C, Sheng WQ, Zhou XY, Du X. Circulating CUDR, LSINCT-5 and PTENP1 long noncoding RNAs in sera distinguish patients with gastric cancer from healthy controls. Int J Cancer. 2015; 137:1128–1135.
12. Mei D, Song H, Wang K, Lou Y, Sun W, Liu Z, Ding X, Guo J. Up-regulation of SUMO1 pseudogene 3 (SUMO1P3) in gastric cancer and its clinical association. Med Oncol. 2013; 30:709.
13. Zhan Y, Kapur N, Mir H, Singh N, Lillard Jr J, Singh S, Zhuang C, Liu L, Xu W, Zhou Q. Increased expression of SUMO1P3 predicts poor prognosis and promotes tumor growth and metastasis in bladder cancer. Oncotarget. 2016; doi: 10.18632/oncotarget.6946.
14. Lui KY, Peng HR, Lin JR, Qiu CH, Chen HA, Fu RD, Cai CJ, Lu MQ. Pseudogene integrator complex subunit 6 pseudogene 1 (INTS6P1) as a novel plasma-based biomarker for hepatocellular carcinoma screening. Tumour Biol. 2015.
15. Hayashi H, Arao T, Togashi Y, Kato H, Fujita Y, De Velasco MA, Kimura H, Matsumoto K, Tanaka K, Okamoto I, Ito A, Yamada Y, Nakagawa K, et al. The OCT4 pseudogene POU5F1B is amplified and promotes an aggressive phenotype in gastric cancer. Oncogene. 2015; 34:199–208.
16. Yu G, Yao W, Gumireddy K, Li A, Wang J, Xiao W, Chen K, Xiao H, Li H, Tang K, Ye Z, Huang Q, Xu H. Pseudogene PTENP1 functions as a competing endogenous RNA to suppress clear-cell renal cell carcinoma progression. Mol Cancer Ther. 2014; 13:3086–3097.
17. Guo X, Tang Y. OCT4 pseudogenes present in human leukemia cells. Clinical and experimental medicine. 2012; 12:207–216.
18. Staege MS, Müller K, Kewitz S, Volkmer I, Mauz-Körholz C, Bernig T, Körholz D. Expression of Dual-Specificity Phosphatase 5 Pseudogene 1 (DUSP5P1) in Tumor Cells. PloS one. 2014; 9:e89577.
19. Molofsky AV, Pardal R, Iwashita T, Park I-K, Clarke MF, Morrison SJ. Bmi-1 dependence distinguishes neural stem cell self-renewal from progenitor proliferation. nature. 2003; 425:962–967.
20. Takebe N, Harris PJ, Warren RQ, Ivy SP. Targeting cancer stem cells by inhibiting Wnt, Notch, and Hedgehog pathways. Nature reviews Clinical oncology. 2011; 8:97–106.
21. Lessard J, Sauvageau G. Bmi-1 determines the proliferative capacity of normal and leukaemic stem cells. Nature. 2003; 423:255–260.
22. Molofsky AV, He S, Bydon M, Morrison SJ, Pardal R. Bmi-1 promotes neural stem cell self-renewal and neural development but not mouse growth and survival by repressing the p16Ink4a and p19Arf senescence pathways. Genes Dev. 2005; 19:1432–1437.
23. Cao L, Bombard J, Cintron K, Sheedy J, Weetall ML, Davis TW. BMI1 as a novel target for drug discovery in cancer. J Cell Biochem. 2011; 112:2729–2741.
24. Paschka P, Dohner K. Core-binding factor acute myeloid leukemia: can we improve on HiDAC consolidation? Hematology Am Soc Hematol Educ Program. 2013; 2013:209–219.
25. Marcucci G, Haferlach T, Dohner H. Molecular genetics of adult acute myeloid leukemia: prognostic and therapeutic implications. J Clin Oncol. 2011; 29:475–486.
26. Shih AH, Abdel-Wahab O, Patel JP, Levine RL. The role of mutations in epigenetic regulators in myeloid malignancies. Nat Rev Cancer. 2012; 12:599–612.
27. Kihara R, Nagata Y, Kiyoi H, Kato T, Yamamoto E, Suzuki K, Chen F, Asou N, Ohtake S, Miyawaki S, Miyazaki Y, Sakura T, Ozawa Y, et al. Comprehensive analysis of genetic alterations and their prognostic impacts in adult acute myeloid leukemia patients. Leukemia. 2014; 28:1586–1595.
28. Wang L, Guo ZY, Zhang R, Xin B, Chen R, Zhao J, Wang T, Wen WH, Jia LT, Yao LB, Yang AG. Pseudogene OCT4-pg4 functions as a natural micro RNA sponge to regulate OCT4 expression by competing for miR-145 in hepatocellular carcinoma. Carcinogenesis. 2013; 34:1773–1781.
29. Tam OH, Aravin AA, Stein P, Girard A, Murchison EP, Cheloufi S, Hodges E, Anger M, Sachidanandam R, Schultz RM, Hannon GJ. Pseudogene-derived small interfering RNAs regulate gene expression in mouse oocytes. Nature. 2008; 453:534–538.
30. Chan WL, Yuo CY, Yang WK, Hung SY, Chang YS, Chiu CC, Yeh KT, Huang HD, Chang JG. Transcribed pseudogene psiPPM1K generates endogenous siRNA to suppress oncogenic cell growth in hepatocellular carcinoma. Nucleic Acids Res. 2013; 41:3734–3747.
31. Hawkins PG, Morris KV. Transcriptional regulation of Oct4 by a long non-coding RNA antisense to Oct4-pseudogene 5. Transcription. 2010; 1:165–175.
32. Zhou BS, Beidler DR, Cheng YC. Identification of antisense RNA transcripts from a human DNA topoisomerase I pseudogene. Cancer Res. 1992; 52:4280–4285.
33. Jeter CR, Badeaux M, Choy G, Chandra D, Patrawala L, Liu C, Calhoun-Davis T, Zaehres H, Daley GQ, Tang DG. Functional evidence that the self-renewal gene NANOG regulates human tumor development. Stem Cells. 2009; 27:993–1005.
34. Liu Y, Wang Z, Li H, Wu Z, Wei F, Wang H. Role of the ERas gene in gastric cancer cells. Oncol Rep. 2013; 30:50–56.
35. Han L, Yuan Y, Zheng S, Yang Y, Li J, Edgerton ME, Diao L, Xu Y, Verhaak RG, Liang H. The Pan-Cancer analysis of pseudogene expression reveals biologically and clinically relevant tumour subtypes. Nat Commun. 2014; 5:3963.
36. Siddique HR, Saleem M. Role of BMI1, a stem cell factor, in cancer recurrence and chemoresistance: preclinical and clinical evidences. Stem Cells. 2012; 30:372–378.
37. Saudy NS, Fawzy IM, Azmy E, Goda EF, Eneen A, Abdul Salam EM. BMI1 gene expression in myeloid leukemias and its impact on prognosis. Blood Cells Mol Dis. 2014; 53:194–198.
38. Yuan J, Takeuchi M, Negishi M, Oguro H, Ichikawa H, Iwama A. Bmi1 is essential for leukemic reprogramming of myeloid progenitor cells. Leukemia. 2011; 25:1335–1343.
39. Thiede C, Koch S, Creutzig E, Steudel C, Illmer T, Schaich M, Ehninger G. Prevalence and prognostic impact of NPM1 mutations in 1485 adult patients with acute myeloid leukemia (AML). Blood. 2006; 107:4011–4020.
40. Pastore F, Kling D, Hoster E, Dufour A, Konstandin NP, Schneider S, Sauerland MC, Berdel WE, Buechner T, Woermann B, Braess J, Hiddemann W, Spiekermann K. Long-term follow-up of cytogenetically normal CEBPA-mutated AML. J Hematol Oncol. 2014; 7:55.
41. Cairoli R, Beghini A, Grillo G, Nadali G, Elice F, Ripamonti CB, Colapietro P, Nichelatti M, Pezzetti L, Lunghi M, Cuneo A, Viola A, Ferrara F, et al. Prognostic impact of c-KIT mutations in core binding factor leukemias: an Italian retrospective study. Blood. 2006; 107:3463–3468.
42. Whitman SP, Archer KJ, Feng L, Baldus C, Becknell B, Carlson BD, Carroll AJ, Mrozek K, Vardiman JW, George SL, Kolitz JE, Larson RA, Bloomfield CD, et al. Absence of the wild-type allele predicts poor prognosis in adult de novo acute myeloid leukemia with normal cytogenetics and the internal tandem duplication of FLT3: a cancer and leukemia group B study. Cancer Res. 2001; 61:7233–7239.
43. Krauth MT, Alpermann T, Bacher U, Eder C, Dicker F, Ulke M, Kuznia S, Nadarajah N, Kern W, Haferlach C, Haferlach T, Schnittger S. WT1 mutations are secondary events in AML, show varying frequencies and impact on prognosis between genetic subgroups. Leukemia. 2015; 29:660–667.
44. Salmena L, Poliseno L, Tay Y, Kats L, Pandolfi PP. A ceRNA hypothesis: the Rosetta Stone of a hidden RNA language? Cell. 2011; 146:353–358.
45. Bennett JM, Catovsky D, Daniel MT, Flandrin G, Galton DA, Gralnick HR, Sultan C. Proposed revised criteria for the classification of acute myeloid leukemia. A report of the French-American-British Cooperative Group. Ann Intern Med. 1985; 103:620–625.
46. Campo E, Swerdlow SH, Harris NL, Pileri S, Stein H, Jaffe ES. The 2008 WHO classification of lymphoid neoplasms and beyond: evolving concepts and practical applications. Blood. 2011; 117:5019–5032.
47. Li Y, Lin J, Yang J, Qian J, Qian W, Yao DM, Deng ZQ, Liu Q, Chen XX, Xie D, An C, Tang CY. Overexpressed let-7a-3 is associated with poor outcome in acute myeloid leukemia. Leuk Res. 2013; 37:1642–1647.
48. Lin J, Yao DM, Qian J, Chen Q, Qian W, Li Y, Yang J, Wang CZ, Chai HY, Qian Z, Xiao GF, Xu WR. Recurrent DNMT3A R882 mutations in Chinese patients with acute myeloid leukemia and myelodysplastic syndrome. PLoS One. 2011; 6:e26906.
49. Lin J, Yao DM, Qian J, Chen Q, Qian W, Li Y, Yang J, Wang CZ, Chai HY, Qian Z, Xiao GF, Xu WR. IDH1 and IDH2 mutation analysis in Chinese patients with acute myeloid leukemia and myelodysplastic syndrome. Ann Hematol. 2012; 91:519–525.
50. Yang X, Qian J, Sun A, Lin J, Xiao G, Yin J, Chen S, Wu D. RAS mutation analysis in a large cohort of Chinese patients with acute myeloid leukemia. Clin Biochem. 2013; 46:579–583.
51. Qian J, Yao DM, Lin J, Qian W, Wang CZ, Chai HY, Yang J, Li Y, Deng ZQ, Ma JC, Chen XX. U2AF1 mutations in Chinese patients with acute myeloid leukemia and myelodysplastic syndrome. PLoS One. 2012; 7:e45760.