
INTRODUCTION
Protein post-translational modification (PTM or PTLM) is one of the most efficient biological mechanisms for expanding the genetic code and regulating cellular physiology. Hydroxylation is one type of PTM that can take place in proteins to hydroxylate proline and lysine. Hydroxyproline (HyP) is the key factor in stabilizing collagens [1, 2], whose instability or abnormal activity may cause stomach cancer [3] and lung cancer [4, 5]. Hydroxylysine (HyL) is also found in collagen, which may affect fibrillogenesis, cross-linking, and matrix mineralization [6]. Consequently, identifying the HyP and HyL sites in proteins is an indispensable step for decoding protein function. It is also crucially important for in-depth understanding the physiological roles of hydroxylation. Meanwhile, it can also provide useful information for developing drugs to treat various diseases associated with hydroxylation.
Although the information of HyP and HyL can be determined by means of large-scale mass spectrometry, it is time-consuming and expensive. Therefore, it is highly demanded to develop computational methods to deal with this problem. In a pioneer work, by incorporating dipeptide position-specific propensity into the general Chou’s pseudo amino acid composition (PseAAC) [7] and using the discriminant function algorithm used by Chou et al. for identifying the HIV protease cleavage sites [8, 9], Xu et al. [10] proposed a predictor called iHyd-PseAAC to identify the HyP and HyL sites in proteins. Although these authors did make contribution in stimulating the development of this area, more work is definitely needed to improve the prediction quality. And the current study is to devote to do so by introducing the sequence-coupled approach.
According to the Chou’s 5-step rule [7] and concurred by many investigators in a series of recent publications [11–23], for developing a new prediction method that can be widely used by broad users, we should consider the following five points: (1) the prediction method should be with a web-server accessible to public; (2) a compelling demonstration to show its prediction quality being improved over the existing counterparts; (3) a good benchmark dataset used to train or test the new model; (4) an elegant mathematical formulation to represent the statistical samples concerned; and (5) a powerful algorithm to operate the calculation. Below, let us address the above points one-by-one.
RESULTS AND DISCUSSION
A new predictor and its user guide
A powerful predictor, called iHyd-PseCp, has been developed for identifying the HyP and HyL sites in proteins. The new predictor is accessible to the public. Users can easily get their desired results by following the instructions below.
(1) Open the iHyd-PseCp web-server at http://www.jci-bioinfo.cn/iHyd-PseCp, your computer will be prompted with the web-server top-page shown on its screen (Figure 1).
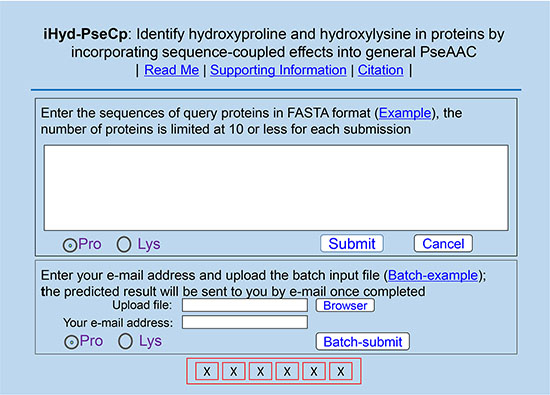
Figure 1: A semi-screenshot to show the top-page of the iHyd-PseCp web-server at http://www.jci-bioinfo.cn/iHyd-PseCp.
(2) In the input box (Figure 1), enter your query protein sequences. This can be done by either typing or copying/pasting manner. The entered query protein sequences should be in the FASTA format. If you are not familiar with FASTA, just click the Example button to see what it looks like.
(3) If you wish to predict HyP sites, check on the Pro button; if you wish to predict the HyL sites, check on the Lys button.
(4) Click the Submit button to see the predicted result. For example, if you use the sequences of the two query proteins in the Example window as the input and check the Pro button on, after clicking the Submit button, you will see the following predicted results: (a) The total number of Pro (P) in the 1st protein (P35248) is 41, of which those located at the sequence positions 47, 95, 149, 170 and 200 (highlighted with red) are of the hydroxylation site, but the remaining 36 sites are not. (b) The total number of Pro residues in the 2nd protein (Q4ZJN1) is 31, of which those at the sequence positions 31, 34, 40, 58, 61, 64, 76, 115, 151, 160 and 175 (highlighted with red) are of the hydroxylation site, but the remaining 20 sites are not. For the same input sequences, however, if you check on the Lys button, you will instead see the following outcomes after clicking the Submit button: (a) The total number of Lys (K) residues in the 1st protein (P35248) is 21, of which those located at the sequence positions 86 and 98 (highlighted in red) are of the hydroxylation site, but the remaining 19 sites are not. (b) The total number of Lys residues in the 2nd protein (Q4ZJN1) is 24, of which those at the sequence positions 73 and 127 (highlighted in red) are of the hydroxylation site, but the remaining 22 sites are not. It would take about 30 seconds before the aforementioned results shown on your screen. Of course, the more number of query protein sequences or the longer of the sequences concerned, the more time it is usually needed.
(5) If you have many query protein sequences and need long computational time, you can also use the batch prediction mode. To do so, just use the Browse button to select the desired file (in FASTA format of course) and follow the online instructions.
(6) To download the benchmark dataset used in this study, click the Supporting Information button on the top of Figure 1.
(7) If you wish to find the papers closely related to the development of the current new prediction method, click Citation button.
RESULTS AND ANALYSIS
The success rates achieved by the new predictor iHyd-PseCp via the rigorous jackknife test on the 164 hydroxyproline proteins are given in Table 1, where for facilitating comparison, the corresponding rates obtained by the predictor iHyd-PseAAC [10] are also listed. Also, the jackknife success rates by the new predictor iHyd-PseCp on the 33 hydroxylysine proteins are given in Table 2, along with the corresponding rates obtained by the predictor iHyd-PseAAC [10]. As we can see from Table 1, for predicting the HyP sites, the newly proposed method has remarkably outperformed the state-of-the-art method from all the four angles: overall accuracy Acc, stability MCC, sensitivity Sn, and specificity Sp. As for the prediction of the HyL sites, it can be observed from Table 2 that the new predictor iHyd-PseCp has significantly outperformed iHyd-PseAAC [10] in Acc and MCC. Although the rate of Sn by the new predictor is about 9% lower than that by iHyd-PseAAC, interestingly the rate of Sp by the new predictor is about 16% higher than that by iHyd-PseAAC.
Table 1: A comparison of the proposed predictor with the state-of-the-art method in identifying the HyP sites in proteinsa
Predictor |
Acc (%)d |
MCCd |
Sn (%)d |
Sp (%) |
|---|---|---|---|---|
iHyd-PseAACb |
80.57 |
0.51 |
80.66 |
80.54 |
iHyd-PseCpc |
96.58 |
0.89 |
86.35 |
99.12 |
aThe scores here were generated by the rigorous jackknife tests on the 164 hydroxyproline proteins as adopted by Xu et al. [10].
bThe predictor developed by Xu et al. [10].
cThe predictor proposed in this paper.
dSee Eq.9 for the metrics definition.
Table 2: A comparison of the proposed predictor with the state-of-the-art method in identifying the HyL sites in proteinsa
Predictor |
Acc (%)d |
MCCd |
Sn (%)d |
Sp (%)d |
|---|---|---|---|---|
iHyd-PseAACb |
83.56 |
0.50 |
87.85 |
83.01 |
iHyd-PseCpc |
97.08 |
0.86 |
78.77 |
99.80 |
aThe scores here were generated by the rigorous jackknife tests on the 33 hydroxylysine proteins as adopted by Xu et al. [10].
bThe predictor developed by Xu et al. [10].
cThe predictor proposed in this paper.
dSee Eq.9 for the metrics definition.
It is instructive to point out that, of the four metrics, the most important are the Acc and MCC [11, 12, 21, 22]: the former reflects the overall accuracy of a predictor; while the latter, its stability in practical applications. The metrics Sn and Sp are used to measure a predictor from two opposite angles. When, and only when, both Sn and Sp of the predictor A are higher than those of the predictor B, can we say A is better than B [19]. In other words, Sn and Sp are actually constrained with each other [24]. Therefore, it is meaningless to use only one of the two for comparing the quality of two predictors. A meaningful comparison in this regard should count the rates of both Sn and Sp, or even better count the rate of their combination, which is none but the score of MCC.
Graphic analysis is a very useful vehicle to deal with complicated biological systems as demonstrated by a series of previous studies (see, e.g., [25–50]). To provide an intuitive comparison of the proposed method with the existing state-of-the art method [10] by using the graphic analysis, let us use the Receiver Operating Characteristic (ROC) graphs [51, 52] as given in Figure 2. In the figure, the green and red graphic lines are the ROC curves for iHyd-PseCp and iHyd-PseAAC [10], respectively, where panel (a) is for the case in predicting HyP sites in proteins, and panel (b) for the case of HyL. The area under the ROC curve is called AUC (area under the curve). The greater the AUC value is, the better the predictor will be [51, 52]. As we can see from Figure 2, the area under the green curve is remarkably greater than that under the red line for both the HyP and HyL cases, once again indicating that the proposed predictor is indeed much better than iHyd-PseAAC [10]. Accordingly, we anticipate that iHyd-PseCp will become a useful bioinformatics tool for identifying HyP and HyL sites in proteins, or at the very least, play a complementary role to the existing state-of-the art tool in this area.
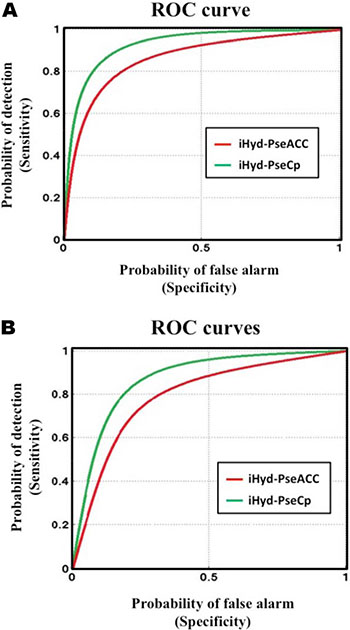
Figure 2: The intuitive graphs of ROC curves to show the performance of iHyd-PseAAC [10] and iHyd-PseCp proposed in this paper, respectively, for the case of (A) HyP and (B) HyL. See the main text for further explanation.
Why could the proposed method be able to increase the prediction quality so substantially? This is due to the fact that the amino-acid-coupled effects around the hydroxylation sites have been taken into account via the conditional probability approach. Similar remarkable successes have also been observed in predicting beta-turns [53], alpha-turns [54], tight turns and their types in proteins [55], specificity of GalNAc-transferase [56], HIV protease cleavage sites [8, 24, 57], as well as signal peptide cleavage sites [58–60].
MATERIALS AND METHODS
Benchmark dataset
The benchmark dataset used in this study was derived from the same proteins as used by Xu et al. [10]. They consist of 164 hydroxyproline proteins and 33 hydroxylysine proteins. The former were used to construct the benchmark dataset for studying the HyP sites, while the latter used to construct the benchmark dataset for studying the HyL sites.
To make the description mathematically more rigorous and clear, the Chou’s scheme [61] was adopted to formulate peptide samples, as done recently by many authors in studying the nitrotyrosine sites [62], methylation sites [63], protein-protein interaction [64], and protein-protein binding sites [65]. According to Chou’s scheme, a potential hydroxylation site-containing peptide sample can be generally expressed by

where the symbol ⊛ denotes the single amino acid code P or K, the subscript ξ is an integer, R−ξ represents the ξ-th upstream amino acid residue from the center, the R+ξ the ξ-th downstream amino acid residue, and so forth. The (2ξ + 1)-tuple peptide sample  can be further classified into the following two categories:
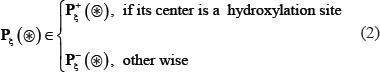
where  denotes a true hydroxylation segment with P or K at its center,
  a false hydroxylation segment with P or K at its center, and the symbol ∈ means “a member of” in the set theory.
In literature the benchmark dataset usually consists of a training dataset and a testing dataset: the former is used for training a model, while the latter for testing the model. But as pointed out in a comprehensive review [66], there is no need to artificially separate a benchmark dataset into the two parts if the prediction model is examined by the jackknife test or subsampling (K-fold) cross-validation since the outcome thus obtained is actually from a combination of many different independent dataset tests.
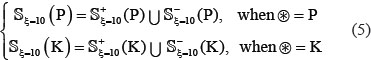
Thus, the benchmark dataset  for the current study can be formulated as
where the positive subset  only contains the samples of true hydroxylation segments
  , and the negative subset
  only contains the samples of false hydroxylation segments
  (see Eq.2); while ⋃ represents the symbol for “union” in the set theory.
The detailed procedures in constructing the benchmark dataset  are as follows. (1) As done in [61], slide the (2ξ + 1)-tuple peptide window along each of the aforementioned 164 hydroxyproline protein sequences, and collected were only those peptide segments that have P (Pro) at the center. (2) If the upstream or downstream in a protein sequence was less than ξ or greater than L − ξ where L is the length of the protein sequence concerned, the lacking amino acid was filled with a dummy residue X. (3) The peptide segment samples thus obtained were put into the positive subset if their centers have been experimentally annotated as the hydroxylation sites; otherwise, into the negative subset. (4) The peptide samples thus obtained were subject to a screening procedure to window those that were identical to any other in a same subset; excluded from the benchmark dataset were also those that were self-conflict, namely, occurring in both hydroxylation group and non-hydroxylation group.
By following the same procedures but using the 33 hydroxylysine proteins and focusing on K (Lys), instead of the 164 hydroxyproline proteins and P (Pro), we obtained the benchmark dataset  .
.
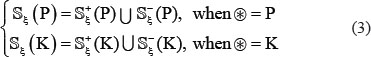
Because the length of peptide sample  is 2ξ + 1 (see Eq.1), the benchmark dataset with different ξ value will contain peptide segments with different number of amino acid residues, as illustrated below
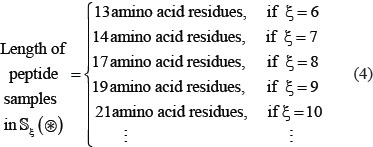
But preliminary tests had indicated that it would be most promising when ξ = 10. Consequently, for further study below, instead of Eq.3, we shall consider
where the benchmark dataset  contains 4,356 (2ξ + 1) = 21-tuple peptide samples, of which 851 belong to the positive subset
  , and 3,505 to the negative subset
  ; the benchmark dataset
  contains 1,122 (2ξ + 1) = 21-tuple peptide samples, of which 142 belong to the positive subset
  , and 980 to the negative subset
  . For readers’ convenience, the detailed sequences of the aforementioned positive and negative samples in
  and
and  are given in Online Supporting Information S1 and Online Supporting Information S2, respectively.
Sequence-coupled information and general PseAAC
With the avalanche of biological sequence generated in the post-genomic age, one of the most important problems in computational biology is how to formulate a biological sequence with a discrete model or a vector, yet still considerably keep its sequence pattern or order information. This is because all the existing machine-learning algorithms can only handle vector but not sequence samples, as elaborated in [67].
To address this problem, the pseudo amino acid composition [68, 69] or PseAAC was proposed. Ever since the concept of pseudo amino acid composition or Chou’s PseAAC [70–72] was proposed, it has rapidly penetrated into nearly all the areas of computational proteomics (see, e.g., [73–80] as well as a long list of references cited in [81, 82]) and many biomedicine and drug development areas [67, 83–86]. Because it has been widely and increasingly used, recently three powerful open access soft-wares, called ‘PseAAC-Builder’ [70], ‘propy’ [71], and ‘PseAAC-General’ [81], were established: the former two are for generating various modes of Chou’s special PseAAC; while the 3rd one for those of Chou’s general PseAAC [7], including not only all the special modes of feature vectors for proteins but also the higher level feature vectors such as “Functional Domain” mode (see Eqs. 9–10 of [7]), “Gene Ontology” mode (see Eqs. 11–12 of [7]), and “Sequential Evolution” or “PSSM” mode (see Eqs.13–14 of [7]). Inspired by the successes of using PseAAC to deal with protein/peptide sequences, three web-servers [87–89] were developed for generating various feature vectors for DNA/RNA sequences as well. Particularly, recently a powerful web-server called Pse-in-One [90] has been developed that can be used to generate any desired feature vectors for protein/peptide and DNA/RNA sequences according to the need of users’ studies.
According to the general PseAAC [7], the peptide sequence of Eq.1 can be formulated as

where
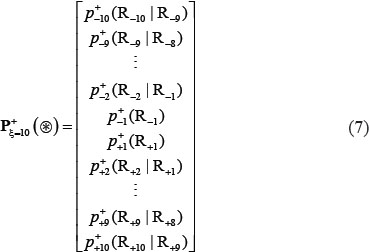
and
In Eq.7  is the conditional probability of amino acid R−10 occurring at the left 1st position (see Eq.1) given that its closest right neighbor is
  is the conditional probability of amino acid R9 occurring at the left 2nd position given that its closest right neighbor is R−8, and so forth. Note that in Eq.7, only
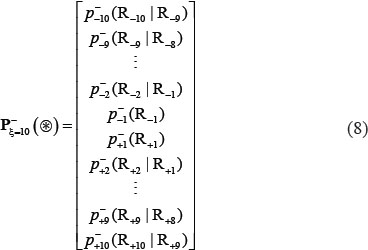
  and
and  are of non-conditional probability since the right neighbor of R−1 and the left neighbor of R+1 are always ⊛ (namely Pro for the case of HyP, or Lys for the case of HyL). All these probability values can be easily derived from the positive training subsets taken from Supporting Information S1 and S2, respectively, as done in [9]. Likewise, the components in Eq.8 are the same as those in Eq.7 except for that they are derived from the negative training subsets in Supporting Information S1 and S2, respectively.
Random forests algorithm
The random forests (RF) algorithm is a powerful algorithm and has been widely used in many areas of computational biology (see, e.g. [13–15, 64, 65, 91–93]). The algorithm of random forest is based on the ensemble of a large number of decision trees, where each tree gives a classification and the forest chooses the final classification via the most votes (over all the trees in the forest). In the most commonly used type of random forests, split selection is performed based on the so-called decrease of Gini impurity. In this study, the random forest is used to rank the features using Gini importance that is implemented with the machine learning platform scikit-learn. The detailed procedures of RF and its formulation have been very clearly described in [94], and hence there is no need to repeat here.
For the current study, all the involved peptide samples were converted into a 20-D (dimensional) vector according to Eq.6, and then entered into the RF operation engine as the input. And the output would indicate whether the center residue ⊛ of the query peptide is a “hydroxylation site” or “non-hydroxylation site”. Note that, in using the current prediction method, one must observe the self-consistency principle: if the center residue of a query peptide is ⊛ = P, then the corresponding training data must be taken from  ; if the center residue of a query peptide is ⊛ = K, then the training data must be taken from
  .
.
The predictor established via the above procedures is called “iHyd-PseCp”, where “i” stands for “identify”, “Hyd” for “hydroxylation site”, “Pse” for “general PseAAC”, and “Cp” for “sequence coupled effect”.
As pointed out in the Introduction section, one of the keys in establishing a useful predictor is how to properly evaluate its anticipated success rates. To realize this, we need to consider the following two things: one is what metrics or scales should be used to quantitatively measure its prediction quality; the other is what validation method should be adopted to calculate or derive the metrics values. Below, let us address the two problems.
A set of four metrics
The following four metrics are usually used in literature to measure the quality of binary classification: (1) overall accuracy or Acc; (2) Mathew’s correlation coefficient or MCC; (3) sensitivity or Sn; and (4) specificity or Sp (see, e.g., [95]). Unfortunately, the conventional formulations for the four are not intuitive and that most experimental scientists feel difficult to understand them, particularly for the one of MCC. Interestingly, by using the Chou’s symbols and derivation in studying signal peptides [96], the aforementioned four metrics can be easily converted into a set of following equations [97, 98]:

where N+ represents the total number of hydroxylation sites investigated whereas  the number of true hydroxylation sites incorrectly predicted to be of non-hydroxylation site; N− the total number of the non-hydroxylation sites investigated whereas
  the number of non-hydroxylation sites incorrectly predicted to be ofhydroxylation site.
According to Eq.9, it is crystal clear to see the following. When  meaning none of the true hydroxylation sites are incorrectly predicted to be of non-hydroxylation site, we have the sensitivity Sn = 1. When
  meaning that all the hydroxylation sites are incorrectly predicted to be of non-hydroxylation site, we have the sensitivity Sn = 0. Likewise, when
  meaning none of the non-hydroxylation sites are incorrectly predicted to be of hydroxylation site, we have the specificity Sp = 1; whereas
  meaning that all the non-hydroxylation sites are incorrectly predicted to be of hydroxylation sites, we have the specificity Sp = 0. When
  meaning that none of hydroxylation sites in the positive dataset and none of the non-hydroxylation sites in the negative dataset are incorrectly predicted, we have the overall accuracy Acc = 1 and Mcc = 1; when and meaning that all the hydroxylation sites in the positive dataset and all thenon-hydroxylation sites in the negative dataset are incorrectly predicted, we have the overall accuracy Acc = 0 and Mcc = −1; whereas when
  and
and  we have Acc = 0.5 and Mcc = 0 meaning no better than random guess. Therefore, using Eq.9 has made the meanings of sensitivity, specificity, overall accuracy, and Mathew’s correlation coefficient much more intuitive and easier-to-understand, particularly for the meaning of MCC, as concurred recently by many investigators (see, e.g., [11, 12, 16, 18, 19, 21–23, 64, 65, 99–108]).
Note that, however, the set of equations defined in Eq.9 is valid only for the single-label systems. For the multi-label systems whose emergence has become more frequent in system biology [109–111] and system medicine [112], a completely different set of metrics are needed as elaborated in [113].
Jackknife test
With a set of well-defined metrics to measuring the quality of a predictor, the next thing is what kind of validation method should be used to score these metrics. In predictive analytics, the following three cross-validation methods are often used: (1) independent dataset test, (2) subsampling (or K-fold cross-validation) test, and (3) jackknife test [114]. Of these three, however, the jackknife test is deemed the least arbitrary that can always yield a unique outcome for a given benchmark dataset as elucidated in [7]. Accordingly, the jackknife test has been widely recognized and increasingly used by investigators to examine the quality of various predictors (see, e.g., [73–76, 78–80, 115–123]). Therefore, the jackknife test was also adopted in this study to score the metrics of Eq.9. In the jackknife test, each of the samples in the benchmark dataset is singled out one-by-one and tested by the predictor trained with the remaining samples. During the jackknifing process, both the training dataset and testing dataset are literally open, and each sample is in turn moved between the two. The jackknife test can exclude the “memory” effect; it can also avoid the arbitrariness problem occurring in the independent dataset test and subsampling test as pointed out in [7] because the outcome obtained by the jackknife test is always unique for a given benchmark dataset.
CONCLUSIONS
The iHyd-PseCp predictor is a new bioinformatics tool for identifying the hydroxylation sites in proteins. Compared with the existing state-of-the-art predictor in this area, its prediction quality is much better, with remarkably higher overall accuracy and stability. For the convenience of most experimental scientists, we have provided its web-server and a step-by-step guide, by which users can easily obtain their desired results without the need to go through the detailed mathematics. The reason of including them in this paper is for the integrity of the new prediction method, and that these techniques, such as incorporating the sequence-coupled approach into the general PseAAC, may be of use as well in developing other tools in computational biology.
We anticipate that iHyd-PseCp will become a very useful high throughput tool for both basic research and drug development in the areas relevant to the protein hydroxylation.
ONLINE SUPPORTING INFORMATION
Supporting Information S1
The benchmark dataset  used to train and test the model for predicting the possibility, of hydroxylation at Pro site. Supplementary Data S1.
Supporting Information S2
The benchmark dataset  used to train and test the model for predicting the possibility of hydroxylation at Lys site. Supplementary Data S2.
ACKNOWLEDGMENTS AND FUNDING
The authors wish to thank the six anonymous reviewers for their constructive comments, which were very useful for strengthening the presentation of this paper. This work was partially supported by the National Nature Science Foundation of China (No. 61261027, 31260273, 61300139, 31560316), the Natural Science Foundation of Jiangxi Province, China (No. 20142BAB207013), the Scientific Research plan of the Department of Education of JiangXi Province(GJJ14640), the Visiting Scholars Program of State Scholarship Fund (201508360047). The funders had no role in study design, data collection and analysis, decision to publish, or preparation of the manuscript.
CONFLICTS OF INTEREST
The authors declare no conflicts of interest.
REFERENCES
1. Krane SM. The importance of proline residues in the structure, stability and susceptibility to proteolytic degradation of collagens. Amino Acids. 2008; 35:703–710.
2. Pálfi VK, András P. How stable is a collagen triple helix? An ab initio study on various collagen and beta-sheet forming sequences. J Comput Chem 2008; 29:1374–1386.
3. Guszczyn T, Sobolewski K. Deregulation of collagen metabolism in human stomach cancer. Pathobiology. 2004; 71:308–313.
4. Sunila ES, Kuttan G. A preliminary study on antimetastatic activity of Thuja occidentalis L. in mice model. Immunopharmacol. Immunotoxicol. 2006; 28:269–280.
5. Chandrasekharan G, Girija K. Anti-metastatic effect of Biophytum sensitivum is exerted through its cytokine and immunomodulatory activity and its regulatory effect on the activation and nuclear translocation of transcription factors in B16F-10 melanoma cells. J Exp Ther Oncol. 2008; 7:325–326.
6. Yamauchi M, Shiiba M. Lysine Hydroxylation and Cross-linking of Collagen. Methods Mol Biol. 2008; 446:277–290.
7. Chou KC. Some remarks on protein attribute prediction and pseudo amino acid composition (50th Anniversary Year Review). J Theor Biol. 2011; 273:236–247.
8. Chou KC, Tomasselli AL, Reardon IM, Heinrikson RL. Predicting HIV protease cleavage sites in proteins by a discriminant function method. Proteins: Struct, Funct, Genet. 1996; 24:51–72.
9. Chou KC. Review: Prediction of human immunodeficiency virus protease cleavage sites in proteins. Anal Biochem. 1996; 233:1–14.
10. Xu Y, Wen X, Shao XJ, Deng NY. iHyd-PseAAC: Predicting hydroxyproline and hydroxylysine in proteins by incorporating dipeptide position-specific propensity into pseudo amino acid composition. Int J Mol Sci. 2014; 15:7594–7610.
11. Chen W, Ding H, Feng P, Lin H, Chou KC. iACP: a sequence-based tool for identifying anticancer peptides. Oncotarget. 2016; 7:16895–16909. doi: 10.18632/oncotarget.7815.
12. Chen W, Tang H, Ye J, Lin H. iRNA-PseU: Identifying RNA pseudouridine sites. Molecular Therapy - Nucleic Acids. 2016; 5:e1. doi: 101038/mtna201637.
13. Jia J, Liu Z, Xiao X. iPPBS-Opt: A Sequence-Based Ensemble Classifier for Identifying Protein-Protein Binding Sites by Optimizing Imbalanced Training Datasets. Molecules. 2016; 21:95.
14. Jia J, Liu Z, Xiao X, Liu B. iSuc-PseOpt: Identifying lysine succinylation sites in proteins by incorporating sequence-coupling effects into pseudo components and optimizing imbalanced training dataset. Anal Biochem. 2016; 497:48–56.
15. Jia J, Liu Z, Xiao X. pSuc-Lys: Predict lysine succinylation sites in proteins with PseAAC and ensemble random forest approach. J Theor Biol. 2016; 394:223–230.
16. Jia J, Liu Z, Xiao X, Liu B, Chou KC. iCar-PseCp: identify carbonylation sites in proteins by Monto Carlo sampling and incorporating sequence coupled effects into general PseAAC. Oncotarget. 2016; doi:10.18632/oncotarget.9148.
17. Liu B, Fang L, Liu F, Wang X. iMiRNA-PseDPC: microRNA precursor identification with a pseudo distance-pair composition approach. J Biomol Struct Dyn. 2016; 34:223–235.
18. Liu B, Fang L, Long R, Lan X. iEnhancer-2L: a two-layer predictor for identifying enhancers and their strength by pseudo k-tuple nucleotide composition. Bioinformatics. 2016; 32:362–389.
19. Liu B, Long R. iDHS-EL: Identifying DNase I hypersensi-tivesites by fusing three different modes of pseudo nucleotide composition into an en-semble learning framework. Bioinformatics. 2016; doi:10.1093/bioinformatics/btw186.
20. Liu Z, Xiao X, Yu DJ, Jia J. pRNAm-PC: Predicting N-methyladenosine sites in RNA sequences via physical-chemical properties. Anal Biochem. 2016; 497:60–67.
21. Qiu WR, Sun BQ, Xiao X, Xu D. iPhos-PseEvo: Identifying human phosphorylated proteins by incorporating evolutionary information into general PseAAC via grey system theory. Molecular Informatics. 2016; doi:10.1002/minf.201600010.
22. Qiu WR, Xiao X, Xu ZH, Chou KC. iPhos-PseEn: identifying phosphorylation sites in proteins by fusing different pseudo components into an ensemble classifier. Oncotarget. 2016; doi: 10.18632/oncotarget.9987.
23. Xiao X, Ye HX, Liu Z, Jia JH, Chou KC. iROS-gPseKNC: predicting replication origin sites in DNA by incorporating dinucleotide position-specific propensity into general pseudo nucleotide composition. Oncotarget. 2016; doi:10.18632/oncotarget.9057.
24. Chou KC. A vectorized sequence-coupling model for predicting HIV protease cleavage sites in proteins. J Biol Chem. 1993; 268:16938–16948.
25. Jiang SP, Liu WM, Fee CH. Graph theory of enzyme kinetics: 1. Steady-state reaction system. Scientia Sinica. 1979; 22:341–358.
26. Cornish-Bowden A. Fundamentals of Enzyme Kinetics, Chapter 4. (London: Butterworths). 1979.
27. Forsen S. Graphical rules for enzyme-catalyzed rate laws. Biochem J. 1980; 187:829–835.
28. Chou KC. A new schematic method in enzyme kinetics. Eur J Biochem. 1980; 113:195–198.
29. Liu WM. Graphical rules for non-steady state enzyme kinetics. J Theor Biol. 1981; 91:637–654.
30. Chou KC. Two new schematic rules for rate laws of enzyme-catalyzed reactions. J Theor Biol. 1981; 89:581–592.
31. Zhou GP, Deng MH. An extension of Chou’s graphic rules for deriving enzyme kinetic equations to systems involving parallel reaction pathways. Biochem J. 1984; 222:169–176.
32. Chou KC, Shen HB. FoldRate: A web-server for predicting protein folding rates from primary sequence. The Open Bioinformatics Journal. 2009; 3:31–50
33. Shen HB, Song JN. Prediction of protein folding rates from primary sequence by fusing multiple sequential features. J Biomed Sci Eng. 2009; 2:136–143.
34. Althaus IW, Chou JJ, Gonzales AJ, Diebel MR, Romero DL, Aristoff PA, Tarpley WG, Reusser F. Steady-state kinetic studies with the non-nucleoside HIV-1 reverse transcriptase inhibitor U-87201E. J Biol Chem. 1993; 268:6119–6124.
35. Althaus IW, Gonzales AJ, Romero DL, Aristoff PA, Tarpley WG, Reusser F. The quinoline U-78036 is a potent inhibitor of HIV-1 reverse transcriptase. J Biol Chem. 1993; 268:14875–14880.
36. Gonzales AJ, Diebel MR, Kezdy FJ, Romero DL, Aristoff PA, Tarpley WG, Reusser F. Kinetic studies with the nonnucleoside HIV-1 reverse transcriptase inhibitor U-88204E. Biochemistry. 1993; 32:6548–6554.
37. Althaus IW, Chou JJ, Gonzales AJ, Diebel MR, Kezdy FJ, Romero DL, Aristoff PA, Tarpley WG, Reusser F. Steady-state kinetic studies with the polysulfonate U-9843, an HIV reverse transcriptase inhibitor. Experientia. 1994; 50:23–28.
38. Diebel MR, Romero DL, Thomas RC, Aristoff PA, Tarpley WG, Reusser F. Kinetic studies with the non-nucleoside HIV-1 reverse transcriptase inhibitor U-90152E. Biochem Pharmacol. 1994; 47:2017–2028.
39. Franks KM, Diebel MR, Kezdy FJ, Romero DL, Thomas RC, Aristoff PA, Tarpley WG, Reusser F. The benzylthio-pyrididine U-31,355 is a potent inhibitor of HIV-1 reverse transcriptase. Biochem Pharmacol. 1996; 51:743–750.
40. Kezdy FJ, Reusser F. Review: Steady-state inhibition kinetics of processive nucleic acid polymerases and nucleases. Anal Biochem. 1994; 221:217–230.
41. Forsen S. Graphical rules of steady-state reaction systems. Can J Chem. 1981; 59:737–755.
42. Chou KC. Graphic rule for drug metabolism systems. Curr Drug Metab. 2010; 11:369–378.
43. Zhou GP. The disposition of the LZCC protein residues in wenxiang diagram provides new insights into the protein-protein interaction mechanism. J Theor Biol. 2011; 284:142–148.
44. Chou KC, Zhang CT. Diagrammatization of codon usage in 339 HIV proteins and its biological implication. AIDS AIDS Res Hum Retroviruses. 1992; 8:1967–1976.
45. Zhang CT. Graphic analysis of codon usage strategy in 1490 human proteins. J Protein Chem. 1993; 12:329–335.
46. Zhang CT. Analysis of codon usage in 1562 E. Coli protein coding sequences. J Mol Biol. 1994; 238:1–8.
47. Wu ZC, Xiao X. 2D-MH: A web-server for generating graphic representation of protein sequences based on the physicochemical properties of their constituent amino acids. J Theor Biol. 2010; 267:29–34.
48. Xiao X, Shao SH. A probability cellular automaton model for hepatitis B viral infections. Biochem Biophys Res Comm. 2006; 342:605–610.
49. Xiao X, Shao S, Ding Y, Huang Z. An Application of Gene Comparative Image for Predicting the Effect on Replication Ratio by HBV Virus Gene Missense Mutation. J Theor Biol. 2005; 235:555–565.
50. Xiao X, Shao S, Ding Y, Huang Z. Using cellular automata to generate Image representation for biological sequences. Amino Acids. 2005; 28:29–35.
51. Fawcett JA. An Introduction to ROC Analysis. Pattern Recognition Letters. 2005; 27:861–874.
52. Davis J, Goadrich M. The relationship between Precision-Recall and ROC curves. Proceedings of the 23rd international conference on Machine learning (ICML). 2006; 233–240.
53. Zhang CT. Prediction of beta-turns in proteins by 1-4 and 2-3 correlation model. Biopolymers. 1997; 41:673–702.
54. Chou KC. Prediction and classification of alpha-turn types. Biopolymers. 1997; 42:837–853.
55. Chou KC. Review: Prediction of tight turns and their types in proteins. Anal Biochem. 2000; 286:1–16.
56. Chou KC. A sequence-coupled vector-projection model for predicting the specificity of GalNAc-transferase. Protein Sci. 1995; 4:1365–1383.
57. Zhang CT. An alternate-subsite-coupled model for predicting HIV protease cleavage sites in proteins. Protein Eng. 1993; 7:65–73.
58. Chou KC. Using subsite coupling to predict signal peptides. Protein Eng. 2001; 14:75–79.
59. Chou KC, Shen HB. Signal-CF: a subsite-coupled and window-fusing approach for predicting signal peptides. Biochem Biophys Res Comm. 2007; 357:633–640.
60. Shen HB. Signal-3L: a 3-layer approach for predicting signal peptide. Biochem Biophys Res Comm. 2007; 363:297–303.
61. Chou KC. Prediction of signal peptides using scaled window. Peptides. 2001; 22:1973–1979.
62. Xu Y, Wen X, Wen LS, Wu LY. iNitro-Tyr: Prediction of nitrotyrosine sites in proteins with general pseudo amino acid composition. PLoS One. 2014; 9:e105018.
63. Qiu WR, Xiao X, Lin WZ. iMethyl-PseAAC: Identification of Protein Methylation Sites via a Pseudo Amino Acid Composition Approach. Biomed Res Int. 2014; 2014:947416.
64. Jia J, Liu Z, Xiao X. iPPI-Esml: an ensemble classifier for identifying the interactions of proteins by incorporating their physicochemical properties and wavelet transforms into PseAAC. J Theor Biol. 2015; 377:47–56.
65. Jia J, Liu Z, Xiao X. Identification of protein-protein binding sites by incorporating the physicochemical properties and stationary wavelet transforms into pseudo amino acid composition (iPPBS-PseAAC). J Biomol Struct. Dyn. 2015; doi:10.1080/07391102.2015.1095116.
66. Chou KC, Shen HB. Review: Recent progresses in protein subcellular location prediction. Anal Biochem. 2007; 370:1–16.
67. Chou KC. Impacts of bioinformatics to medicinal chemistry. Med. Chem. 2015; 11:218–234.
68. Chou KC. Prediction of protein cellular attributes using pseudo amino acid composition. Proteins: Struct Funct Genet. (Erratum: ibid, 2001, Vol44, 60). 2001; 43:246–255.
69. Chou KC. Using amphiphilic pseudo amino acid composition to predict enzyme subfamily classes. Bioinformatics. 2005; 21:10–19.
70. Du P, Wang X, Xu C, Gao Y. PseAAC-Builder: A cross-platform stand-alone program for generating various special Chou’s pseudo-amino acid compositions. Anal Biochem. 2012; 425:117–119.
71. Cao DS, Xu QS, Liang YZ. propy: a tool to generate various modes of Chou’s PseAAC. Bioinformatics. 2013; 29:960–962.
72. Lin SX, Lapointe J. Theoretical and experimental biology in one —A symposium in honour of Professor Kuo-Chen Chou’s 50th anniversary and Professor Richard Giegé’s 40th anniversary of their scientific careers. J Biomed Sci Eng. 2013; 6:435–442.
73. Khan ZU, Hayat M, Khan MA. Discrimination of acidic and alkaline enzyme using Chou’s pseudo amino acid composition in conjunction with probabilistic neural network model. J Theor Biol. 2015; 365:197–203.
74. Dehzangi A, Heffernan R, Sharma A, Lyons J, Paliwal K, Sattar A. Gram-positive and Gram-negative protein subcellular localization by incorporating evolutionary-based descriptors into Chou’s general PseAAC. J Theor Biol. 2015; 364:284–294.
75. Kumar R, Srivastava A, Kumari B, Kumar M. Prediction of beta-lactamase and its class by Chou’s pseudo-amino acid composition and support vector machine. J Theor Biol. 2015; 365:96–103.
76. Mondal S, Pai PP. Chou’s pseudo amino acid composition improves sequence-based antifreeze protein prediction. J Theor Biol. 2014; 356:30–35.
77. Wang X, Zhang W, Zhang Q, Li GZ. MultiP-SChlo: multi-label protein subchloroplast localization prediction with Chou’s pseudo amino acid composition and a novel multi-label classifier. Bioinformatics. 2015; 31:2639–2645.
78. Kabir M, Hayat M. iRSpot-GAEnsC: identifing recombination spots via ensemble classifier and extending the concept of Chou’s PseAAC to formulate DNA samples. Mol Genet Genomics. 2016; 291:285–296.
79. Ahmad K, Waris M, Hayat M. Prediction of Protein Submitochondrial Locations by Incorporating Dipeptide Composition into Chou’s General Pseudo Amino Acid Composition. J Membr Biol. 2016:10.1007/s00232-00015-09868-00238.
80. Tang H, Chen W, Lin H. Identification of immunoglobulins using Chou’s pseudo amino acid composition with feature selection technique. Mol Biosyst. 2016; 12:1269–1275.
81. Du P, Gu S, Jiao Y. PseAAC-General: Fast building various modes of general form of Chou’s pseudo-amino acid composition for large-scale protein datasets. Int J Mol Sci. 2014; 15:3495–3506.
82. Chen W, Lin H. Pseudo nucleotide composition or PseKNC: an effective formulation for analyzing genomic sequences. Mol BioSyst. 2015; 11:2620–2634.
83. Zhong WZ, Zhou SF. Molecular science for drug development and biomedicine. Int J Mol Sci. 2014; 15:20072–20078.
84. Chou KC. An unprecedented revolution in medicinal science. Proceedings of the MOL2NET (International Conference on Multidisciplinary Sciences) 2015; 1:1–10. doi:10.3390/MOL2NET-1-b040.
85. Zhou GP. Current progress in structural bioinformatics of protein-biomolecule interactions. Med Chem. 2015; 11:216–216.
86. Zhou GP, Zhong WZ. Perspectives in Medicinal Chemistry. Curr Top Med Chem. 2016; 16:381–382.
87. Chen W, Lei TY, Jin DC, Lin H. PseKNC: a flexible web-server for generating pseudo K-tuple nucleotide composition. Anal Biochem. 2014; 456:53–60.
88. Chen W, Zhang X, Brooker J. PseKNC-General: a cross-platform package for generating various modes of pseudo nucleotide compositions. Bioinformatics. 2015; 31:119–120.
89. Liu B, Liu F, Fang L, Wang X. repDNA: a Python package to generate various modes of feature vectors for DNA sequences by incorporating user-defined physicochemical properties and sequence-order effects. Bioinformatics. 2015; 31:1307–1309.
90. Liu B, Liu F, Wang X, Chen J. Pse-in-One: a web server for generating various modes of pseudo components of DNA, RNA, and protein sequences. Nucleic Acids Res. 2015; 43:W65–W71.
91. Kandaswamy KK, Moller S, Suganthan PN, Sridharan S, Pugalenthi G. AFP-Pred: A random forest approach for predicting antifreeze proteins from sequence-derived properties. J Theor Biol. 2011; 270:56–62.
92. Lin WZ, Fang JA, Xiao X. iDNA-Prot: Identification of DNA Binding Proteins Using Random Forest with Grey Model. PLoS ONE. 2011; 6:e24756.
93. Pugalenthi G, Kandaswamy KK, Kolatkar P. RSARF: Prediction of Residue Solvent Accessibility from Protein Sequence Using Random Forest Method. Protein Pept Lett. 2012; 19:50–56.
94. Breiman L. Random forests. Machine learning. 2001; 45:5–32.
95. Chen J, Liu H, Yang J. Prediction of linear B-cell epitopes using amino acid pair antigenicity scale. Amino Acids. 2007; 33:423–428.
96. Chou KC. Prediction of protein signal sequences and their cleavage sites. Proteins: Struct, Funct, Genet. 2001; 42:136–139.
97. Xu Y, Ding J, Wu LY. iSNO-PseAAC: Predict cysteine S-nitrosylation sites in proteins by incorporating position specific amino acid propensity into pseudo amino acid composition. PLoS One. 2013; 8:e55844.
98. Chen W, Feng PM, Lin H. iRSpot-PseDNC: identify recombination spots with pseudo dinucleotide composition. Nucleic Acids Res. 2013; 41:e68.
99. Chen W, Feng PM, Deng EZ, Lin H. iTIS-PseTNC: a sequence-based predictor for identifying translation initiation site in human genes using pseudo trinucleotide composition. Anal Biochem. 2014; 462:76–83.
100. Chen W, Feng PM, Lin H. iSS-PseDNC: identifying splicing sites using pseudo dinucleotide composition. BioMed Res Int. 2014; 2014:623149.
101. Ding H, Deng EZ, Yuan LF, Liu L. iCTX-Type: A sequence-based predictor for identifying the types of conotoxins in targeting ion channels. BioMed Res Int. 2014; 2014:286419.
102. Chen W, Feng P, Ding H. iRNA-Methyl: Identifying N6-methyladenosine sites using pseudo nucleotide composition Anal Biochem. (also, Data in Brief, 2015, 5: 376–378). 2015; 490:26–33.
103. Liu B, Fang L, Liu F, Wang X, Chen J. Identification of real microRNA precursors with a pseudo structure status composition approach. PLoS One. 2015; 10:e0121501.
104. Liu B, Liu F, Fang L, Wang X. repRNA: a web server for generating various feature vectors of RNA sequences. Mol Genet Genomics. 2016; 291:473–481.
105. Liu B, Fang L, Wang S, Wang X. Identification of microRNA precursor with the degenerate K-tuple or Kmer strategy J Theor Biol. 2015; 385:153–159.
106. Xiao X, Min JL, Lin WZ, Liu Z. iDrug-Target: predicting the interactions between drug compounds and target proteins in cellular networking via the benchmark dataset optimization approach. J Biomol Struct Dyn. 2015; 33:2221–2233.
107. Liu Z, Xiao X, Qiu WR. iDNA-Methyl: Identifying DNA methylation sites via pseudo trinucleotide composition. Anal. Biochem. (also, Data in Brief, 2015, 4: 87–89). 2015; 474:69–77.
108. Chen W, Feng P, Ding H. Using deformation energy to analyze nucleosome positioning in genomes. Genomics. 2016; 107:69–75.
109. Chou KC, Wu ZC, Xiao X. iLoc-Hum: Using accumulation-label scale to predict subcellular locations of human proteins with both single and multiple sites. Mol. BioSyst. 2012; 8:629–641.
110. Lin WZ, Fang JA, Xiao X. iLoc-Animal: A multi-label learning classifier for predicting subcellular localization of animal proteins. Mol BioSyst. 2013; 9:634–644.
111. Xiao X, Wu ZC. iLoc-Virus: A multi-label learning classifier for identifying the subcellular localization of virus proteins with both single and multiple sites. J Theor Biol. 2011; 284:42–51.
112. Xiao X, Wang P, Lin WZ, Jia JH. iAMP-2L: A two-level multi-label classifier for identifying antimicrobial peptides and their functional types. Anal Biochem. 2013; 436:168–177.
113. Chou KC. Some Remarks on Predicting Multi-Label Attributes in Molecular Biosystems. Mol BioSyst. 2013; 9:1092–1100.
114. Chou KC, Zhang CT. Review: Prediction of protein structural classes. Crit Rev Biochem Mol Biol. 1995; 30:275–349.
115. Zhou GP. An intriguing controversy over protein structural class prediction. J Protein Chem. 1998; 17:729–738.
116. Zhou GP, Assa-Munt N. Some insights into protein structural class prediction. Proteins: Struct, Funct, Genet. 2001; 44:57–59.
117. Cai YD, Zhou GP. Support vector machines for predicting membrane protein types by using functional domain composition. Biophys J. 2003; 84:3257–3263.
118. Zhou GP, Doctor K. Subcellular location prediction of apoptosis proteins. Proteins: Struct, Funct, Genet. 2003; 50:44–48.
119. Shen HB, Yang J. Euk-PLoc: an ensemble classifier for large-scale eukaryotic protein subcellular location prediction. Amino Acids. 2007; 33:57–67.
120. Cai YD. Prediction and classification of protein subcellular location: sequence-order effect and pseudo amino acid composition. J Cell Biochem. (Addendum, ibid 2004, 91, 1085). 2003; 90:1250–1260.
121. Cai YD. Prediction of membrane protein types by incorporating amphipathic effects. J Chem Inf Model. 2005; 45:407–413.
122. Fan GL, Zhang XY, Liu YL, Nang Y, Wang H. DSPMP: Discriminating secretory proteins of malaria parasite by hybridizing different descriptors of Chou’s pseudo amino acid patterns. J Comput Chem. 2015; 36:2317–2327.
123. Ju Z, Cao JZ, Gu H. Predicting lysine phosphoglycerylation with fuzzy SVM by incorporating k-spaced amino acid pairs into Chou’s general PseAAC. J Theor Biol. 2016; 397:145–150.