
INTRODUCTION
Patients with pancreatic ductal adenocarcinoma (PDAC) have a poor clinical outcome, despite improvements in diagnosis and treatment. The overall five year survival rate for all patients with or without pancreatectomy after diagnosis is 13% in Japan [1, 2]. On the other hand, patients with a successful resection of PDAC at an early stage (Stage IA) have a 46% five year survival rate [1, 3]. Most patients with PDAC are diagnosed in the advanced stages because of the anatomical location of the pancreas, lack of specific symptoms, infiltration to the surrounding organs, or distant metastasis even from a small primary tumor less than 2 cm in diameter. Thus, a diagnostic technique for small pancreatic adenocarcinomas without symptoms is urgently needed.
Mucins (MUC) play crucial roles in carcinogenesis and tumor invasion in pancreatic neoplasms. MUC1 and MUC4 are large membrane-bound glycoproteins that are translated as single polypeptides. These mucins undergo intracellular autocatalytic proteolytic cleavage into two subunits that form stable non-covalent heterodimers that are transported to the cell surface. MUC1 contributes to oncogenesis by promoting the loss of epithelial cell polarity, promoting growth and survival pathways, activating receptor tyrosine kinase signaling pathways, and conferring resistance to the stress-induced cell death pathway [4-6]. MUC4 plays an important role in cell proliferation and differentiation of epithelial cells by inducing specific phosphorylation of ErbB2 and enhancing expression of the cyclin dependent kinase inhibitor p27, which inhibits cell cycle progression [7-15].
MUC1 and MUC4 are often overexpressed in epithelial cancers, and our immunohistochemical studies in the pancreas and/or biomolecular studies have shown the following: (1) aberrant expression of MUC1 and MUC4 are associated with invasive proliferation of tumors and a poor outcome for patients [16, 17]; and (2) the expression of MUC1/MUC4 mRNA is regulated by epigenetic mechanisms such as DNA methylation in the promoter region [18-20].
Some have reported that expression of MUC1 and MUC4 increases with increasing pancreatic intraepithelial neoplasia (PanIN) and/or intraductal papillary mucinous neoplasm (IPMN) grade [17, 21-24]. Alteration of methylation patterns has been reported as important in cancer development and progression [25]. Concerning pancreatic cancer, it has been shown that MUC4 promoter hypomethylation increases with progression of disease from PanIN to frank PDAC [26]. However, the significance of alterations in DNA methylation status in the promoters of MUC1 and MUC4 at various stages in the development of PDAC is not fully understood. Recently, it was reported that DNA methyltransferases (DNMT) add a methyl group to a cytosine, generating 5-methylcytosine (5mC) [27] and TET and/or AID/APOBEC (apolipoprotein B mRNA-editing enzyme, catalytic polypeptide-like) family members were demethylated by conversion of 5mC to 5-hydroxymethylcytosine (5hmC) and further oxidized products in mammalian genomes (i.e. active DNA demethylation) [28-30]. In addition, it has been reported that hypoxia upregulates the expression of these DNA demethylation enzymes as well as MUC1 [31, 32].
In this study, to further elucidate the relationship between epigenetic changes in the MUC1 and MUC4 promoters, and their expression in pancreatic tissue, we analyzed bisulfite treated DNA samples by the MSE method [33, 34]. As no recent study has evaluated the correlation between MUC1 or MUC4 methylation status and progression of PDAC, we analyzed MUC1 and MUC4 methylation status in stage-matched tissues to study the relationship between MUC1 and MUC4 promoter methylation and prognosis.
RESULTS
Correlation between DNA hypomethylation status and clinicopathological features
In total, 267 pancreas tissue samples (103 neoplastic and 164 non-neoplastic) were collected from 169 patients (including 98 paired samples) (Table 1). Expression levels of DNA methyltransferases (DNMTs) as DNA methylation factors (DNMT1 and DNMT3a), DNA demethylation factors (TET1, TET2, TET3 and AID), CAIX (as a hypoxia biomarker) and mucins (MUC1 and MUC4) in neoplastic and non-neoplastic samples are summarized in Supplementary Table 1. In general, neoplastic regions expressed lower levels of TET1, TET2 and DNMT1 than non-neoplastic regions (p<0.001 in all three factors). Conversely, the neoplastic regions expressed more MUC4 and CAIX than the non-neoplastic regions (p<0.001 in both factors). The relationship between MUC1 and MUC4 promoter methylation status and clinicopathological information of pancreatic lesions was also investigated. As shown in Table 2, analysis of neoplastic samples revealed significant differences in MUC1 promoter methylation status based on sex, occurrence of distant metastasis (M), and stage as defined by the Union for International Cancer Control (UICC) (p=0.034, p=0.002 and p=0.021, respectively). Statistically significant differences in MUC4 promoter hypomethylation were found only in UICC stage (p=0.028). However, no statistically significant differences in MUC1 and/or MUC4 promoter hypomethylation were observed based on age, primary tumor site (T), or lymph node involvement (N). For non-neoplastic tissues, we found that the level of MUC1 promoter hypomethylation was associated with sex (p=0.050), while MUC4 promoter hypomethylation was principally associated with the occurrence of distant metastasis (p=0.045).
Table 1: Clinicopathological features
n (%) |
||
|---|---|---|
Sex |
M |
91 (53.8%) |
F |
78 (46.2%) |
|
Age |
median (SD) |
68 (±10.71) |
60> |
124 (73.4%) |
|
60< |
45 (26.6%) |
|
TNM |
||
T |
0 |
23 (13.6%) |
1 |
20 (11.8%) |
|
2 |
17 (10.1%) |
|
3 |
96 (56.8%) |
|
4 |
4 (2.4%) |
|
NA |
9 (5.3%) |
|
N |
0 |
92 (54.4%) |
1 |
68 (40.2%) |
|
NA |
9 (5.3%) |
|
M |
0 |
153 (90.5%) |
1 |
6 (3.6%) |
|
NA |
10 (5.9%) |
|
Stage |
non |
23 (13.6%) |
IA |
18 (10.7%) |
|
IB |
12 (7.1%) |
|
IIA |
36 (21.3%) |
|
IIB |
62 (36.7%) |
|
III |
3 (1.8%) |
|
IV |
6 (3.6%) |
|
NA |
9 (5.3%) |
Table 2: Comparison between DNA methylation status and clinical information
Demethylation status of MUC1 |
|||||||||||
|---|---|---|---|---|---|---|---|---|---|---|---|
neoplastic region |
non-neoplastic region |
||||||||||
n (%) |
mean±SD |
p value |
n (%) |
mean±SD |
p value |
||||||
Sex |
M |
53 (51.5%) |
54.71 |
± |
15.1 |
0.034 |
88 (53.7%) |
60.42 |
± |
15.0 |
0.050* |
F |
50 (48.5%) |
47.75 |
± |
18.1 |
76 (46.3%) |
54.92 |
± |
20.0 |
|||
Age |
>60 |
75 (72.8%) |
49.67 |
± |
15.5 |
0.104 |
115 (69.7%) |
57.07 |
± |
18.1 |
0.354 |
<60 |
28 (27.2%) |
55.67 |
± |
19.8 |
50 (30.3%) |
59.82 |
± |
16.4 |
|||
TNM |
|||||||||||
T |
T1 & T2 |
7 (8.5%) |
48.02 |
± |
26.6 |
0.703 |
36 (27.1%) |
62.21 |
± |
13.2 |
0.052* |
T3 & T4 |
75 (91.5%) |
50.75 |
± |
17.3 |
97 (72.9%) |
55.58 |
± |
18.7 |
|||
N |
negative |
47 (50.0%) |
51.82 |
± |
17.2 |
0.619 |
88 (56.8%) |
60.27 |
± |
16.3 |
0.061 |
positive |
47 (50.0%) |
50.05 |
± |
17.5 |
67 (43.2%) |
55.02 |
± |
18.6 |
|||
M |
negative |
87 (93.5%) |
52.77 |
± |
15.6 |
0.002 |
149 (96.8%) |
58.40 |
± |
17.5 |
0.172 |
positive |
6 (6.5%) |
31.20 |
± |
19.6 |
5 (3.2%) |
47.49 |
± |
14.7 |
|||
Stage |
IA & IB |
6 (7.3%) |
45.79 |
± |
28.4 |
0.021** |
29 (21.8%) |
62.28 |
± |
13.2 |
0.183** |
IIA & IIB |
67 (81.7%) |
52.85 |
± |
16.2 |
96 (72.2%) |
56.35 |
± |
18.8 |
|||
III & IV |
9 (11.0%) |
35.86 |
± |
18.0 |
8 (6.0%) |
51.76 |
± |
14.0 |
|||
Historogy |
por |
5 (9.6%) |
50.67 |
± |
11.2 |
0.911 |
7 (7.7%) |
59.53 |
± |
22.8 |
0.816 |
tub |
47 (90.4%) |
51.45 |
± |
16.5 |
84 (92.3%) |
58.05 |
± |
16.6 |
|||
Demethylation status of MUC4 |
|||||||||||
neoplastic region |
non-neoplastic region |
||||||||||
n (%) |
mean±SD |
p value |
n (%) |
mean±SD |
p value |
||||||
Sex |
M |
53 (51.5%) |
72.32 |
± |
17.1 |
0.628 |
88 (53.7%) |
70.31 |
± |
13.9 |
0.089* |
F |
50 (48.5%) |
70.61 |
± |
19.0 |
76 (46.3%) |
66.69 |
± |
13.2 |
|||
Age |
>60 |
75 (72.8%) |
70.96 |
± |
17.5 |
0.626 |
115 (69.7%) |
68.53 |
± |
13.5 |
0.887 |
<60 |
28 (27.2%) |
72.88 |
± |
19.5 |
50 (30.3%) |
68.85 |
± |
14.1 |
|||
TNM |
|||||||||||
T |
T1 & T2 |
7 (8.5%) |
60.18 |
± |
26.1 |
0.08 |
36 (27.1%) |
66.34 |
± |
10.6 |
0.265* |
T3 & T4 |
75 (91.5%) |
72.62 |
± |
16.9 |
97 (72.9%) |
69.29 |
± |
14.4 |
|||
N |
negative |
47 (50.0%) |
68.81 |
± |
19.6 |
0.313 |
88 (56.8%) |
66.75 |
± |
13.7 |
0.234 |
positive |
47 (50.0%) |
72.57 |
± |
16.7 |
67 (43.2%) |
69.33 |
± |
13.0 |
|||
M |
negative |
87 (93.5%) |
71.55 |
± |
17.7 |
0.077 |
149 (96.8%) |
68.13 |
± |
13.0 |
0.045 |
positive |
6 (6.5%) |
57.92 |
± |
23.1 |
5 (3.2%) |
55.96 |
± |
19.8 |
|||
Stage |
IA & IB |
6 (7.3%) |
57.61 |
± |
27.6 |
0.028** |
29 (21.8%) |
66.36 |
± |
11.1 |
0.369** |
IIA & IIB |
67 (81.7%) |
73.96 |
± |
16.0 |
96 (72.2%) |
69.48 |
± |
13.5 |
|||
III & IV |
9 (11.0%) |
62.70 |
± |
20.6 |
8 (6.0%) |
64.31 |
± |
20.5 |
|||
Historogy |
por |
5 (9.6%) |
60.93 |
± |
17.8 |
0.109 |
7 (7.7%) |
59.70 |
± |
9.9 |
0.034 |
tub |
47 (90.4%) |
73.91 |
± |
18.5 |
84 (92.3%) |
70.42 |
± |
13.7 |
|||
p value is calculated by equal variance t. test, Unequal variance t. test (*) or ANOVA test (**).
Relationship between expression of MUC1 or MUC4 and corresponding DNA hypomethylation status in pancreatic tissues
We examined the relationship between mRNA expression, DNA methylation and IHC staining in paired pancreatic tissues. Representative cases of mRNA expression (RT-PCR) paired with IHC analysis and MSE analysis are shown in Figure 1. We found that mRNA positive samples were also IHC positive with corresponding high levels of hypomethylated DNA for both MUC1 and MUC4. On the other hand, mRNA negative samples were IHC negative and showed higher levels of methylated DNA in MUC1 and MUC4 (Figure 1A, 1B and 1C). We analyzed the relationship between hypomethylation status of MUC1 and MUC4 and the expression of MUC1, MUC4 and CAIX mRNA with Pearson's correlation coefficient (Supplementary Table 2). A good degree of correlation was observed between hypomethylation status and mRNA expression (R=0.436 p<0.001 and R=0.317 p<0.001, respectively). In addition, a high correlation between expression of CAIX and MUC1 and/or MUC4 mRNA expression was found (R=0.632 p<0.001 and R=0.474 p<0.001, respectively). Interestingly, multiple regression analyses showed a closer relationship between MUC1 mRNA expression and hypomethylation status than MUC4 mRNA expression and hypomethylation status (R2=0.507 p<0.001 and R2=0.231 p<0.001, respectively). The multiple regression predictive value was obtained from following formulas: Fm (expression level of MUC1 mRNA) = (59.8+1.3x(MUC1 hypomethylation index)+30.0x(expression level of CAIX))/100, Fm (expression level of MUC4 mRNA) = -1.288+0.009x(MUC4 hypomethylation index)+0.352x(expression level of CAIX) (Figure 1D). In a pancreatic cancer cell line, hypoxia induced an increase in expression of MUC4 mRNA (Supplementary Figure 1).
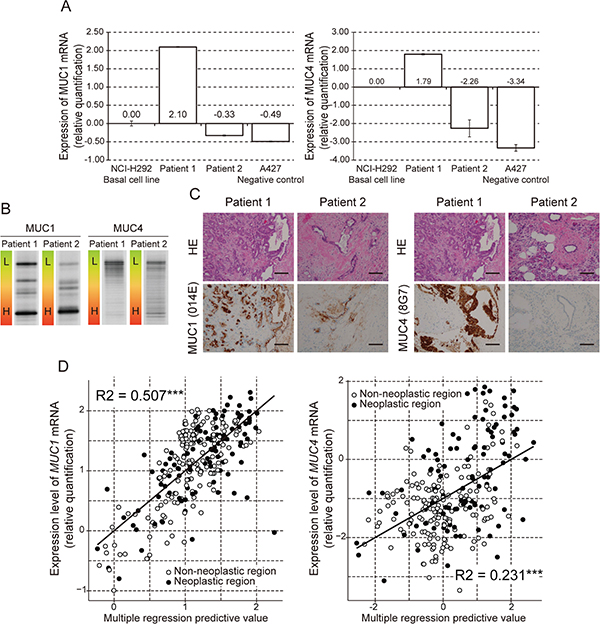
Figure 1: Analysis of MUC1 and MUC4 expression and methylation status in human pancreatic samples. A. Expression of MUC1 and MUC4 mRNA examined by quantitative real time RT-PCR. The bar graphs show gene expression levels relative to those in NCI-H292 cells. The A427 cell line was used as a negative control. B. DNA methylation of the MUC1 and MUC4 promoter region examined by MSE. L: Low methylated. H: High methylated. Pancreatic tissue from patient 1 showed hypomethylated MUC1 and MUC4. Pancreatic tissue from patient 2 showed hypermethylated MUC1 and MUC4. C. Expression of MUC1 and MUC4 protein examined by immunohistochemical staining. HE: Hematoxylin and Eosin Staining. Magnification: ×20. Scale bar: 100 μm. D. Multiple regression analysis of mRNA expression against expression level of CAIX and DNA hypomethylation status in MUC1 or MUC4. R2: R squared, ***: p<0.001, **: p<0.01, *: p<0.05.
DNA hypomethylation status and expression of methylation-related enzymes in pancreas tissue
We examined whether the methylation status of mucin genes were influenced by the expression of DNA methylation-related enzymes. In a single regression analysis, the hypomethylation status of MUC1 showed significant correlation with expression of TET1, TET2, AID, and DNMT3a mRNA (R=0.270 p<0.001, R=0.202 p=0.001, R=-0.288 p<0.001 and R=0.348 p<0.001, respectively) (Supplementary Table 2). On the other hand, the expression of TET1, TET2 and DNMT3a mRNA showed significant correlation with MUC4 hypomethylation (R=0.280 p<0.001, R=0.232 p<0.001, and R=0.366 p<0.001, respectively) (Supplementary Table 2). The expression of CAIX mRNA (as a hypoxia biomarker) showed significant correlation with TET1, TET3, DNMT1 and DNMT3a mRNA in pancreatic tissue (R=0.262 p<0.001, R=0.313 p<0.001, R=-0.425 p<0.001 and R=0.448 p<0.001, respectively) (Supplementary Table 2).
In order to find statistically significant interactions between enzymes related to DNA methylation, we performed a multiple regression analysis. We determined the best regression formula with the least variables (six DNA methylation-related enzymes) and of which the AIC value was lowest for hypomethylation status of MUC1 or MUC4 is as follows: Fm (hypomethylation status of MUC1) = 57.102 - 3.789(TET3) + 7.553(DNMT1) + 24.020(DNMT3a) - 8.897(AID), Fm (hypomethylation status of MUC4)= 57.894 - 3.039(TET3) + 17.825(DNMT3a).
Using these models, the observed versus predicted methylation status is shown in Figure 2. The R2 values are 0.267 (p<0.001) and 0.158, respectively. In the case of MUC1, the non-neoplastic sample analysis gave an R2 value of 0.369 (p<0.001), and the neoplastic sample analysis gave an R2 value of 0.086 (p=0.021). In the case of MUC4, the non-neoplastic sample analysis gave an R2 value of 0.298 (p<0.001), and the neoplastic sample analysis gave an R2 value of 0.061 (p=0.016).
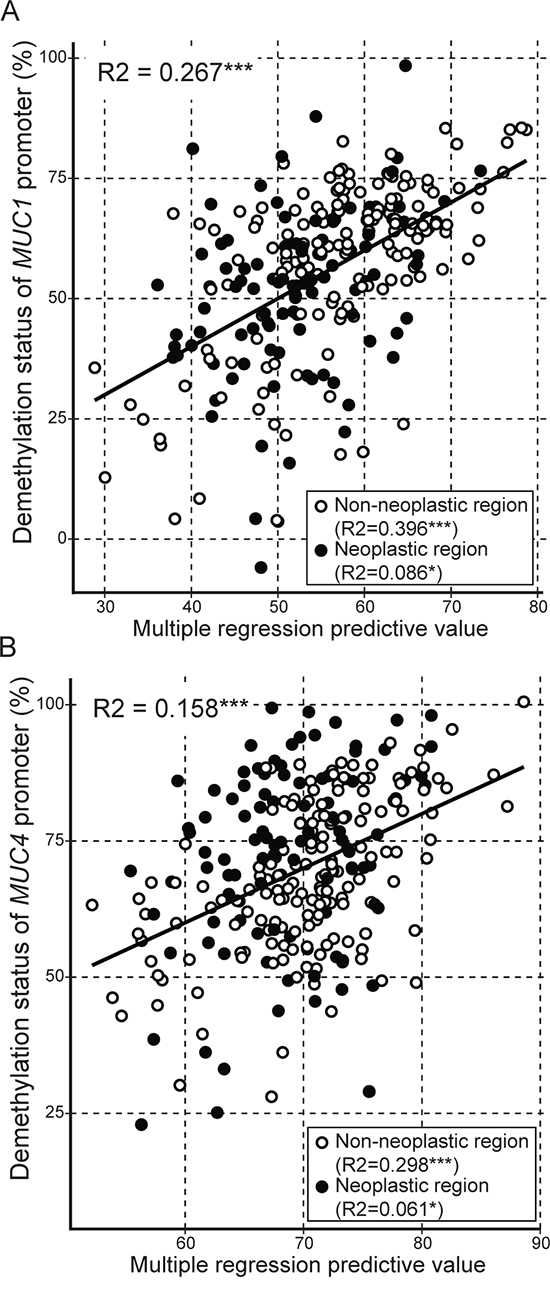
Figure 2: Multiple regression analysis of hypomethylation status of MUC1 or MUC4 against expression level of DNA methylation-related enzymes. The multiple regression predictive value was obtained from following formulas. A. Fm (hypomethylation status of MUC1) = 57.102 - 3.789(TET3) + 7.553(DNMT1) + 24.020(DNMT3a) - 8.897(AID), B. Fm (hypomethylation status of MUC4) = 57.894 - 3.039(TET3) + 17.825(DNMT3a). R2: R squared, ***: p<0.001, **: p<0.01, *: p<0.05, ○: non-neoplastic region, ●: neoplastic region.
DNA methylation status and PDAC prognosis
To investigate whether the methylation status of MUC1 and MUC4 correlated with survival, we compared overall survival between a MUC1 or MUC4 hypermethylation group and a MUC1 or MUC4 hypomethylation group. In the whole group, we found that patients with MUC4 hypermethylation showed a much better prognosis than patients with MUC4 hypomethylation in neoplastic region and/or non-neoplastic region (data not shown). MUC1 methylation status showed no correlation with survival. To further assess whether the MUC1 and/or MUC4 methylation status affect prognosis, we divided patients into two groups based on the presence or absence of lymph node metastasis. In early stages (IA, IB and IIA) of PDAC samples, of the 66 patients (2 neoplasm only and 34 non-neoplasm only), 20 died during the follow-up period (0–125 months). The median overall survival was 30 months. The patient group showing MUC4 hypermethylation (< 70.58) in non-neoplastic region showed much better prognosis than the group with MUC4 hypomethylation in non-neoplastic regions (HR=4.78, IC 1.57-14.49, P=0.002 by log rank test) (Figure 3). Similarly, the patient group showing MUC4 hypermethylation (< 72.00) in neoplastic regions showed a much better prognosis than the group showing MUC4 hypomethylation in neoplastic regions (HR=2.60, IC 0.94-7.19, P=0.048 by log rank test). However, hypomethylation status of MUC1 showed no correlated with survival.
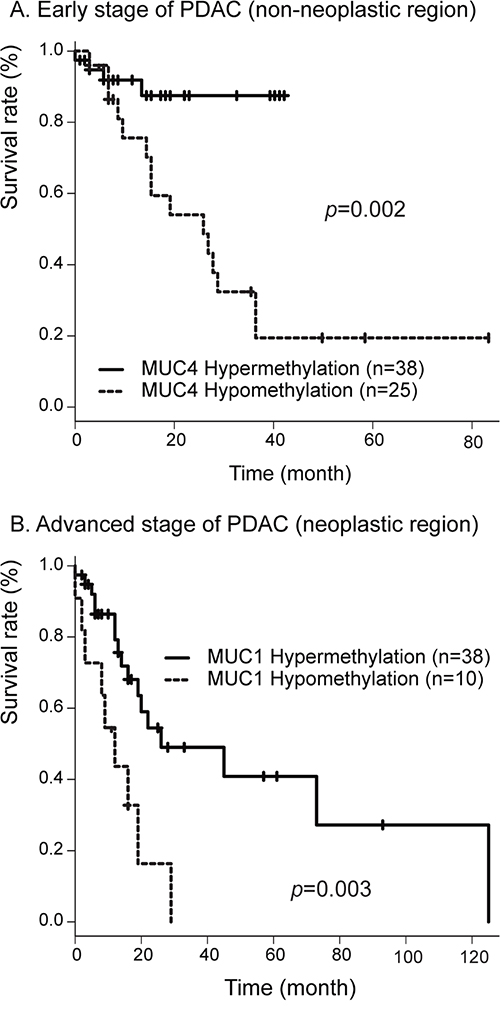
Figure 3: A. Correlation between MUC4 hypomethylation status in non-neoplastic region and overall survival in 66 patients with early stage PDAC determined by the Kaplan-Meier method. B. Correlation between MUC1 hypomethylation status in neoplastic region and overall survival in 71 patients with advanced stage PDAC determined by the Kaplan-Meier method.
In advanced stages (IIB, III and IV) of PDAC, of the 71 patients (2 neoplasm only and 21 non-neoplasm only), 32 died during the follow-up period (0–125 months). The median overall survival was 22 months. The patient group showing MUC1 hypermethylation (< 46.87) in neoplastic regions showed better prognosis than the group with MUC1 hypomethylation in neoplastic regions (HR=2.43, IC 1.44-7.89 P=0.003 by log rank test) (Figure 3). Similarly, the patient group showing MUC4 hypermethylation (< 75.58) in neoplastic regions showed better prognosis than the group with MUC4 hypomethylation in neoplastic regions (HR=2.47, IC 1.10-5.56, P=0.024 by log rank test). However, hypomethylation status of MUC1 or MUC4 in non-neoplastic region showed no correlation with survival.
With respect to stage IIA and IIB PDAC samples, of 98 patients evaluated (2 neoplasm only and 31 non-neoplasm only), 45 died during the follow-up period (0–125 months). The median overall survival was 27 months. Analysis of Kaplan-Meier survival curves showed that patients with hypomethylation of MUC1 displayed a significant decrease in overall survival as compared to those with hypermethylation (< 62.17) of MUC1 (HR=2.65, IC 1.3-5.4, p=0.005 by log-rank test) (Figure 4). Analysis of Kaplan-Meier survival curves showed that patients with hypomethylation of MUC4 had a significant decrease in overall survival as compared to the group with hypermethylation (< 82.75) of MUC4 (HR=3.02, IC 1.54-5.93, P<0.001 by log-rank test) (Figure 4). Finally, we analyzed the effect of methylation status of both MUC1 and MUC4 on overall survival. Using two selected threshold values (MUC1, 62.173 and MUC4, 82.747), we found a significant association between methylation and survival (HR=3.59, IC 1.75-7.54, p<0.001 by log-rank test) (Figure 4). The threshold values of hypomethylation status, AUC and survival rates are summarized in Table 3.
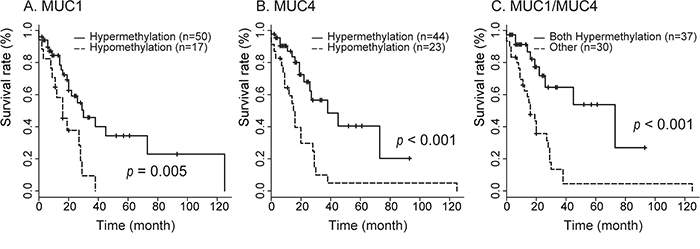
Figure 4: Correlation between MUC1 and/or MUC4 hypomethylation in neoplastic region status and overall survival in 98 patients with PDAC in stage IIA and IIB determined by the Kaplan-Meier method. Survival of patients with MUC1 A., MUC4 B., and MUC1/MUC4 C. hypomethylation status was worse than that for hypermethylation.
Table 3: Relationship between DNA promoter methylation status and prognosis
T value |
AUC |
D/n |
p/y |
HR |
IC95 |
p-value |
|||
|---|---|---|---|---|---|---|---|---|---|
A. Early stages of PDAC (stage IA, IB and IIA) |
|||||||||
1. MUC1 |
neoplastic region |
Hyper |
< 46.87 |
0.691 |
3/11 |
0.53 |
1.00 |
ref |
|
Hypo |
13/21 |
1.48 |
1.13 |
0.32-4.05 |
0.850 |
||||
non-neoplastic region |
Hyper |
< 64.10 |
0.605 |
6/30 |
1.48 |
1.00 |
ref |
||
Hypo |
13/34 |
1.85 |
1.73 |
0.66-4.57 |
0.260 |
||||
2. MUC4 |
neoplastic region |
Hyper |
< 82.20 |
0.777 |
6/21 |
1.29 |
1.00 |
ref |
|
Hypo |
10/11 |
0.72 |
2.60 |
0.94-7.19 |
0.048 |
||||
non-neoplastic region |
Hyper |
< 70.57 |
0.768 |
4/39 |
1.78 |
1.00 |
ref |
||
Hypo |
15/25 |
1.54 |
4.78 |
1.57-14.49 |
0.002 |
||||
3. MUC1/MUC4 |
neoplastic region |
other |
7/22 |
1.33 |
1.00 |
ref |
|||
Both Hypo |
9/10 |
0.68 |
2.12 |
0.78- 5.72 |
0.130 |
||||
non-neoplastic region |
other |
8/48 |
2.44 |
1.00 |
ref |
||||
Both Hypo |
11/16 |
0.88 |
4.21 |
1.69-10.49 |
<0.001 |
||||
B. Advanced stages of PDAC (stage IIB, III and IV) |
|||||||||
1. MUC1 |
neoplastic region |
Hyper |
< 61.39 |
0.627 |
17/39 |
2.43 |
1.00 |
ref |
|
Hypo |
9/11 |
0.34 |
3.36 |
1.44- 7.89 |
0.003 |
||||
non-neoplastic region |
Hyper |
< 35.63 |
0.586 |
1/10 |
0.29 |
1.00 |
ref |
||
Hypo |
29/59 |
3.28 |
3.06 |
0.41-22.74 |
0.250 |
||||
2. MUC4 |
neoplastic region |
Hyper |
< 75.58 |
0.704 |
10/29 |
1.59 |
1.00 |
ref |
|
Hypo |
16/21 |
1.19 |
2.47 |
1.10-5.56 |
0.024 |
||||
non-neoplastic region |
Hyper |
< 72.00 |
0.683 |
12/41 |
1.74 |
1.00 |
ref |
||
Hypo |
18/28 |
1.82 |
1.48 |
0.69- 3.15 |
0.309 |
||||
3. MUC1/MUC4 |
neoplastic region |
Both Hyper |
9/28 |
1.58 |
1.00 |
ref |
|||
other |
17/22 |
1.19 |
2.90 |
1.23- 6.63 |
0.008 |
||||
non-neoplastic region |
Both Hyper |
4/8 |
0.38 |
1.00 |
ref |
||||
other |
22/61 |
2.39 |
1.01 |
0.35-3.00 |
0.149 |
||||
C. Stage IIA and IIB |
|||||||||
1. MUC1 |
neoplastic region |
Hyper |
< 62.17 |
0.659 |
22/50 |
3.07 |
1.00 |
ref |
|
Hypo |
14/17 |
0.73 |
2.65 |
1.32-5.44 |
0.005 |
||||
non-neoplastic region |
Hyper |
< 64.78 |
0.634 |
21/58 |
2.40 |
1.00 |
ref |
||
Hypo |
22/38 |
2.45 |
1.04 |
0.61-1.87 |
0.922 |
||||
2. MUC4 |
neoplastic region |
Hyper |
< 82.75 |
0.763 |
15/44 |
2.57 |
1.00 |
ref |
|
Hypo |
21/23 |
1.22 |
3.02 |
1.54-5.39 |
<0.001 |
||||
non-neoplastic region |
Hyper |
< 72.00 |
0.703 |
15/55 |
2.18 |
1.00 |
ref |
||
Hypo |
28/41 |
2.67 |
1.41 |
0.74-2.71 |
0.297 |
||||
3. MUC1/MUC4 |
neoplastic region |
Both Hyper |
10/37 |
2.21 |
1.00 |
ref |
|||
other |
26/30 |
1.59 |
3.59 |
1.71-7.54 |
<0.001 |
||||
non-neoplastic region |
Both Hyper |
16/48 |
1.85 |
1.00 |
ref |
||||
other |
27/45 |
3.01 |
1.04 |
0.55-1.96 |
0.895 |
||||
T value: Threshold value, AUC: Area under the curve, D/n: Death/number, p/y: person-years, HR: hazard ratio, Hyper: Hypermethylation, Hypo: Hypomethylation.
DISCUSSION
PDAC is an aggressive malignancy that carries an extremely poor prognosis due to delayed diagnosis, early metastasis and resistance to most cytotoxic agents [1]. Thus, it is very important to establish new diagnostic, prognostic and therapeutic biomarkers. It has been shown previously that expression of mucin genes (including MUC1, MUC2, MUC3, MUC4 and MUC5AC) is regulated by DNA methylation at promoter regions in cancer cell lines [18-20, 35, 36]. In the present study, we analyzed the relationships among the expression of two mucins, MUC1 and MUC4, their DNA methylation status at promoter regions, and expression of DNA methylation-related enzymes in pancreatic tissue in non-neoplastic and PDAC samples. We also evaluated the association between mucin gene methylation status and survival.
An analysis of the correlation between expression and hypoxic environment revealed that MUC1 and MUC4 expression was correlated with a hypoxic environment, as was expression of CAIX. This is similar to the results of our previous study in which we showed that a hypoxic environment upregulates MUC1 expression in a pancreatic cancer cell line, and hypoxia-inducible MUC1 contributes to hypoxia-driven angiogenesis through the activation of proangiogenic factors in pancreatic cancer [31]. Interestingly, MUC4 expression showed a similar result in pancreatic tissue. Also, our results in the pancreatic cancer cell line showed that enforcing a hypoxic environment upregulates expression of MUC4. Further studies are needed to clarify the biological significance of this observation, but these results suggest that a hypoxic environment is one factor that explains MUC4 expression in pancreatic tumors. Our analysis of DNA methylation revealed a strong relationship between mRNA expression and DNA hypomethylation for MUC1 and MUC4. This is similar to our previous results with pancreatic cancer cell lines and/or pancreatic tissue [33, 34]. These results suggest that both hypoxia and methylation status play key roles in the regulation of expression of MUC1 and MUC4 in pancreatic tissue.
Recently, it was reported that members of the TET (Ten-Eleven Translocation) family and/or AID (activation-induced deaminase)/APOBEC family were demethylated by conversion from 5-methylcytosine (5mC) to 5-hydroxymethylcytosine (5hmC) and further oxidized products in mammalian genomes (i.e. active DNA) [29, 30]. Thus, we evaluated differences in expression of DNA methylation-related enzymes in pancreatic neoplastic regions and non-neoplastic regions. We also calculated the rates of association between mRNA expression of DNA methylation-related enzymes and MUC1 and MUC4 hypomethylation status. We found that neoplastic regions showed lower expression of TET1, TET2 and DNMT1 than non-neoplastic regions. This result suggested that neoplastic regions have altered regulation of epigenetic status. A multiple regression analysis revealed significant correlations for non-neoplastic samples between promoter hypomethylation status and the expression of enzymes related to DNA methylation. However, neoplastic samples showed no correlation between promoter hypomethylation status and expression of enzymes related to DNA methylation. These results suggest that epigenetic regulation of MUC1 and MUC4 by these enzymes was ineffective or altered in neoplastic regions.
A previous study showed that analysis of DNA methylation status in promoters of MUC1, MUC2 and MUC4 (MSE analysis of pancreatic juice samples) could distinguish between gastric type intraductal papillary mucinous neoplasm (IPMN), intestinal type IPMN, other type IPMN and PDAC [33]. In this study, we evaluated the relationship between DNA hypomethylation status and overall survival in PDAC, especially patients in stages IIA and IIB. Those patients with hypomethylated MUC1 had a significantly decreased overall survival as compared to those with hypermethylated MUC1. A similar result was found for MUC4. When considered together, the methylation status of MUC1 and MUC4 was predictive of survival: patients with hypermethylation of both genes had significantly increased overall survival. Thus, we propose that aberrant methylation of MUC1 and MUC4 promoters are potential prognostic biomarkers for PDAC, and suggest that further MSE analysis of human clinical samples to determine its utility for early diagnosis of pancreatic neoplasms and for stratifying patients with respect to modes of treatment.
In summary, our data demonstrate that MUC1 and MUC4 expression are increased by hypoxia and DNA hypomethylation. Furthermore, MUC1 and MUC4 hypomethylation status is statistically associated with development of distant metastasis, tumor stage and overall survival for PDAC (stage IIA and IIB) patients. Thus, detection of MUC1 and MUC4 methylation status has potential prognostic value as an indicator of overall survival and should be evaluated further for clinical utility.
MATERIALS AND METHODS
Cell lines
Human pancreatic cancer cell lines BxPC3, HPAF2, Panc1, human colon adenocarcinoma cell lines Caco2, LS174T, and human lung adenocarcinoma cell line A427, NCI-H292 were obtained from the American Type Culture Collection. HPAF2, LS174T, and Caco2 cells were cultured in Eagle's MEM (Sigma, MO, USA), PANC1 and A427 cells were cultured in DMEM (Sigma, MO, USA), and BxPC3 and NCI-H292 cells were cultured in RPMI 1640 (Sigma, MO, USA). The media was supplemented with 10% fetal bovine serum (Invitrogen, Tokyo, Japan) and 100 U/mL of penicillin and 100 μg/mL streptomycin (Sigma, MO, USA). Hypoxic culture conditions were achieved with a multi-gas incubator containing a gas mixture of 94% N2, 5% CO2 and 1% O2 (ASTEC, Fukuoka, Japan).
Clinical samples
Pancreatic tissue samples
We obtained 267 surgically resected fresh tissue blocks (about 2×2×2 mm) with neoplastic or non-neoplastic areas from 169 patients. Table 1 summarizes the clinicopathological features of the 103 neoplastic samples and 164 non-neoplastic samples (including 98 paired samples). 103 patient samples (37 neoplastic samples and 98 non-neoplastic samples) were collected in Kagoshima University from August 2007 to May 2014, and 66 patient samples (66 neoplastic samples and 66 non-neoplastic samples) were collected in Ulm University from February 2001 to February 2013.
Ethics statement
The study was conducted in accordance with the guiding principles of the Declaration of Helsinki. Collection of samples was approved by the ethical committees of each hospital (Kagoshima University Hospital and Ulm University Hospital), and informed written consent was obtained from each patient. All studies using human materials in this article were approved by the Ethical Committee of Kagoshima University Hospital (revised 20–82, revised 22–127 and revised 26–145).
Extraction and quantification of mRNA
Total RNA was extracted from cell lines, human pancreatic tissues and pancreatic juices using an RNeasy Mini kit (QIAGEN, Tokyo, Japan). Total RNA (1 μg) was reverse transcribed with a high capacity RNA-to-cDNA Kit (Applied Biosystems, CA, USA). Real-time reverse transcription–PCR was performed on a Roche LightCycler® 96 System using FastStart Essential DNA Green Master (Roche, Tokyo, Japan). Gene expression was normalized to the β-actin mRNA level in each sample. The data normalized were using NCI-H292 cell line. A427 cell line was used as negative control. Primer sets are shown in Supplementary Table 3.
Extraction of DNA and bisulfite modification
DNA from cell lines, pancreatic tissues, and pancreatic juice was extracted using a DNeasy Tissue System (QIAGEN). Bisulfite modification of the genomic DNA was carried out using an Epitect Bisulfite Kit (QIAGEN). Purification of PCR products was carried out using a Wizard SV Gel and PCR Clean-Up System (Promega KK, Tokyo, Japan).
MSE analysis
MSE analysis was performed using previously described methods [33, 34]. The target DNA fragments were amplified by nested PCR using bisulfite treated DNA using the primer sets shown in Supplementary Table 3. In the electrophoresis step, the amplicon was applied to the D-Code system (BioRad Laboratories, Hercules, CA, USA) using a polyacrylamide gel with a linear denaturant gradient at 60°C and 70 V for 14 h. Band intensity was quantified by Image J software. The hypomethylation index was calculated as the proportion of highest band intensity/total band intensity of the sample. Subsequently, the hypomethylation index in each sample was normalized using data from a hypomethylated and hypermethylated cell line. Cell lines with hyper- and hypomethylated of MUC1 (Caco2 and LS174T) and MUC4 (Caco2 and LS174T) were used as control standards.
Statistical analysis
Data were analyzed using the “R” computing environment [37]. The normality of the data distribution was evaluated by the Kolmogorov-Smirnov test. F test performed to compare the variances of two samples from normal populations. A non-parametric test of two-group difference was performed by the Mann-Whitney U test. A parametric test of two-group difference was performed by the Welch t-test (Unequal variance) or Student t-test (Equal variance). Bartlett test performed to compare the variances of multi samples from normal populations. A nonparametric test of multi-group difference was performed by the Kruskal-Wallis one-way analysis of variance. A parametric test of multi-group difference was performed by the one-way analysis of variance (ANOVA). The correlation coefficient (R) was determined by the Pearson product-moment correlation coefficient. The multiple regression analysis was performed by general linear model and coefficient of determination (R squared) was determined. Survival rate analysis was evaluated by the Cox proportional hazard model, and threshold points were determined by ROC curve analysis. A p-value<0.05 was considered statistically significant.
Immunohistochemistry
Immunohistochemistry (IHC) was performed in cut sections of pancreatic tumors using anti-MUC1 monoclonal antibody (MAb) clone 014E (MAb MUC1/014E, the kind gift of Suguru Yonezawa) [38] and anti-MUC4 MAb clone 8G7 (MAb MUC4/8G7, the kind gift of Surinder K. Batra) [39] using the immunoperoxidase method. Antigen retrieval was performed using CC1 antigen retrieval buffer (pH 8.5, EDTA, 100°C, 30 minutes; Ventana Medical Systems, AZ, USA) for all sections. Following incubation with the primary antibodies (MAb MUC1/014E diluted 1:5, 37°C, 32 minutes; MAb MUC4/8G7 diluted 1:3000, 37°C, 32 minutes) in phosphate buffered saline, pH 7.4 (PBS) with 1% bovine serum albumin (BSA), sections were stained on a Benchmark XT automated slide stainer using a diaminobenzidine detection kit (UltraView DAB, Ventana Medical Systems). The control staining (normal mouse serum or PBS-BSA instead of the primary antibodies) showed no reaction.
ACKNOWLEDGMENTS
We thank Kei Matsuo for his assistance with clinical sampling and DNA methylation analysis. We thank Yukari Nishimura for her excellent technical assistance with immunohistochemistry.
CONFLICTS OF INTEREST
We do not have any disclosure or conflicts of interest in the study.
GRANT SUPPORT
This study was supported in part by a grant from Grants-in-Aid for Scientific Research on Scientific Research (C) 15K08466 to M. Higashi, Scientific Research (C) 15K11297 to T. Hamada and Young Scientists (B) 15K21247 to S. Yokoyama from the Ministry of Education, Science, Sports, Culture and Technology, Japan; by the Kodama Memorial Foundation, Japan (S. Yokoyama & M. Higashi). The funders had no role in study design, data collection and analysis, decision to publish, or preparation of the manuscript.
REFERENCES
1. Egawa S, Toma H, Ohigashi H, Okusaka T, Nakao A, Hatori T, Maguchi H, Yanagisawa A, Tanaka M. Japan Pancreatic Cancer Registry; 30th year anniversary: Japan Pancreas Society. Pancreas. 2012; 41:985-992.
2. Klöppel G, Adler G, Hruban RH, Kern SE, Longnecker DS, Partanen TJ. (2010). Ductal adenocarcinoma of the pancreas. In: Hamilton SR, Aaltonen LA, eds. World Health Organization Classification of Tumours of the Digestive System, Fourth Edition, pp. 281-291.
3. Isaji S, Kawarada Y, Uemoto S. Classification of pancreatic cancer: comparison of Japanese and UICC classifications. Pancreas. 2004; 28:231-234.
4. Hollingsworth MA, Swanson BJ. Mucins in cancer: protection and control of the cell surface. Nat Rev Cancer. 2004; 4:45-60.
5. Kufe DW. Mucins in cancer: function, prognosis and therapy. Nat Rev Cancer. 2009; 9:874-885.
6. Kaur S, Kumar S, Momi N, Sasson AR, Batra SK. Mucins in pancreatic cancer and its microenvironment. Nat Rev Gastroenterol Hepatol. 2013; 10:607-620.
7. Jepson S, Komatsu M, Haq B, Arango ME, Huang D, Carraway CA, Carraway KL. Muc4/sialomucin complex, the intramembrane ErbB2 ligand, induces specific phosphorylation of ErbB2 and enhances expression of p27(kip), but does not activate mitogen-activated kinase or protein kinaseB/Akt pathways. Oncogene. 2002; 21:7524-7532.
8. Jonckheere N, Perrais M, Mariette C, Batra SK, Aubert JP, Pigny P, Van Seuningen I. A role for human MUC4 mucin gene, the ErbB2 ligand, as a target of TGF-beta in pancreatic carcinogenesis. Oncogene. 2004; 23:5729-5738.
9. Ponnusamy MP, Singh AP, Jain M, Chakraborty S, Moniaux N, Batra SK. MUC4 activates HER2 signalling and enhances the motility of human ovarian cancer cells. Br J Cancer. 2008; 99:520-526.
10. Singh AP, Chaturvedi P, Batra SK. Emerging roles of MUC4 in cancer: a novel target for diagnosis and therapy. Cancer Res. 2007; 67:433-436.
11. Singh AP, Moniaux N, Chauhan SC, Meza JL, Batra SK. Inhibition of MUC4 expression suppresses pancreatic tumor cell growth and metastasis. Cancer Res. 2004; 64:622-630.
12. Moniaux N, Chaturvedi P, Varshney GC, Meza JL, Rodriguez-Sierra JF, Aubert JP, Batra SK. Human MUC4 mucin induces ultra-structural changes and tumorigenicity in pancreatic cancer cells. Br J Cancer. 2007; 97:345-357.
13. Chaturvedi P, Singh AP, Chakraborty S, Chauhan SC, Bafna S, Meza JL, Singh PK, Hollingsworth MA, Mehta PP, Batra SK. MUC4 mucin interacts with and stabilizes the HER2 oncoprotein in human pancreatic cancer cells. Cancer Res. 2008; 68:2065-2070.
14. Chaturvedi P, Singh AP, Moniaux N, Senapati S, Chakraborty S, Meza JL, Batra SK. MUC4 mucin potentiates pancreatic tumor cell proliferation, survival, and invasive properties and interferes with its interaction to extracellular matrix proteins. Mol Cancer Res. 2007; 5:309-320.
15. Rachagani S, Macha MA, Ponnusamy MP, Haridas D, Kaur S, Jain M, Batra SK. MUC4 potentiates invasion and metastasis of pancreatic cancer cells through stabilization of fibroblast growth factor receptor 1. Carcinogenesis. 2012; 33:1953-1964.
16. Yonezawa S, Sato E. Expression of mucin antigens in human cancers and its relationship with malignancy potential. Pathol Int. 1997; 47:813-830.
17. Yonezawa S, Goto M, Yamada N, Higashi M, Nomoto M. Expression profiles of MUC1, MUC2, and MUC4 mucins in human neoplasms and their relationship with biological behavior. Proteomics. 2008; 8:3329-3341.
18. Yamada N, Kitamoto S, Yokoyama S, Hamada T, Goto M, Tsutsumida H, Higashi M, Yonezawa S. Epigenetic regulation of mucin genes in human cancers. Clin Epigenetics. 2011; 2:85-96.
19. Yamada N, Nishida Y, Tsutsumida H, Goto M, Higashi M, Nomoto M, Yonezawa S. Promoter CpG methylation in cancer cells contributes to the regulation of MUC4. Br J Cancer. 2009; 100:344-351.
20. Yamada N, Nishida Y, Tsutsumida H, Hamada T, Goto M, Higashi M, Nomoto M, Yonezawa S. MUC1 expression is regulated by DNA methylation and histone H3 lysine 9 modification in cancer cells. Cancer Res. 2008; 68:2708-2716.
21. Yonezawa S, Higashi M, Yamada N, Goto M. Precursor lesions of pancreatic cancer. Gut Liver. 2008; 2:137-154.
22. Yonezawa S, Higashi M, Yamada N, Yokoyama S, Goto M. Significance of mucin expression in pancreatobiliary neoplasms. J Hepatobiliary Pancreat Sci. 2010; 17:108-124.
23. Yonezawa S, Higashi M, Yamada N, Yokoyama S, Kitamoto S, Kitajima S, Goto M. Mucins in human neoplasms: clinical pathology, gene expression and diagnostic application. Pathol Int. 2011; 61:697-716.
24. Yonezawa S, Nakamura A, Horinouchi M, Sato E. The expression of several types of mucin is related to the biological behavior of pancreatic neoplasms. J Hepatobiliary Pancreat Surg. 2002; 9:328-341.
25. Sato N, Fukushima N, Maitra A, Matsubayashi H, Yeo CJ, Cameron JL, Hruban RH, Goggins M. Discovery of novel targets for aberrant methylation in pancreatic carcinoma using high-throughput microarrays. Cancer Res. 2003; 63:3735-3742.
26. Zhu Y, Zhang JJ, Zhu R, Liang WB, Gao WT, Yu JB, Xu ZK, Miao Y. The increase in the expression and hypomethylation of MUC4 gene with the progression of pancreatic ductal adenocarcinoma. Med Oncol. 2011; 28:S175-184.
27. Surani MA, Hayashi K, Hajkova P. Genetic and epigenetic regulators of pluripotency. Cell. 2007; 128:747-762.
28. Ko M, Huang Y, Jankowska AM, Pape UJ, Tahiliani M, Bandukwala HS, An J, Lamperti ED, Koh KP, Ganetzky R, Liu XS, Aravind L, Agarwal S, Maciejewski JP, Rao A. Impaired hydroxylation of 5-methylcytosine in myeloid cancers with mutant TET2. Nature. 2010; 468:839-843.
29. Nabel CS, Jia H, Ye Y, Shen L, Goldschmidt HL, Stivers JT, Zhang Y, Kohli RM. AID/APOBEC deaminases disfavor modified cytosines implicated in DNA demethylation. Nat Chem Biol. 2012; 8:751-758.
30. Tahiliani M, Koh KP, Shen Y, Pastor WA, Bandukwala H, Brudno Y, Agarwal S, Iyer LM, Liu DR, Aravind L, Rao A. Conversion of 5-methylcytosine to 5-hydroxymethylcytosine in mammalian DNA by MLL partner TET1. Science. 2009; 324:930-935.
31. Kitamoto S, Yokoyama S, Higashi M, Yamada N, Takao S, Yonezawa S. MUC1 enhances hypoxia-driven angiogenesis through the regulation of multiple proangiogenic factors. Oncogene. 2012; 32:4614-4621.
32. Mariani CJ, Vasanthakumar A, Madzo J, Yesilkanal A, Bhagat T, Yu Y, Bhattacharyya S, Wenger RH, Cohn SL, Nanduri J, Verma A, Prabhakar NR, Godley LA. TET1-mediated hydroxymethylation facilitates hypoxic gene induction in neuroblastoma. Cell Rep. 2014; 7:1343-1352.
33. Yokoyama S, Kitamoto S, Higashi M, Goto Y, Hara T, Ikebe D, Yamaguchi T, Arisaka Y, Niihara T, Nishimata H, Tanaka S, Takaori K, Batra SK, Yonezawa S. Diagnosis of pancreatic neoplasms using a novel method of DNA methylation analysis of mucin expression in pancreatic juice. PLoS One. 2014; 9:e93760.
34. Yokoyama S, Kitamoto S, Yamada N, Houjou I, Sugai T, Nakamura S, Arisaka Y, Takaori K, Higashi M, Yonezawa S. The application of methylation specific electrophoresis (MSE) to DNA methylation analysis of the 5' CpG island of mucin in cancer cells. BMC Cancer. 2012; 12:67.
35. Kitamoto S, Yamada N, Yokoyama S, Houjou I, Higashi M, Goto M, Batra SK, Yonezawa S. DNA methylation and histone H3-K9 modifications contribute to MUC17 expression. Glycobiology. 2010; 21:247-256.
36. Kitamoto S, Yamada N, Yokoyama S, Houjou I, Higashi M, Yonezawa S. Promoter hypomethylation contributes to the expression of MUC3A in cancer cells. Biochem Biophys Res Commun. 2010; 397:333-339.
37. Ihaka R, Gentleman R. R: A Language for Data Analysis and Graphics. Journal of Computational and Graphical Statistics. 1996; 5:16.
38. Yonezawa S, Kitajima S, Higashi M, Osako M, Horinouchi M, Yokoyama S, Kitamoto S, Yamada N, Tamura Y, Shimizu T, Tabata M, Goto M. A novel anti-MUC1 antibody against the MUC1 cytoplasmic tail domain: use in sensitive identification of poorly differentiated cells in adenocarcinoma of the stomach. Gastric Cancer. 2012; 15:370-381.
39. Moniaux N, Varshney GC, Chauhan SC, Copin MC, Jain M, Wittel UA, Andrianifahanana M, Aubert JP, Batra SK. Generation and characterization of anti-MUC4 monoclonal antibodies reactive with normal and cancer cells in humans. J Histochem Cytochem. 2004; 52:253-261.