
INTRODUCTION
The involvement of the insulin-like growth factor (IGF) axis in prostate cancer biology has been well established [1–3]. IGF1, both of endocrine as well as autocrine/paracrine origin, has been identified as a key player in the cellular and biochemical chain of events leading to transformation of the prostate gland. Accordingly, dysregulated IGF1 biosynthesis in transgenic mice with targeted expression of the ligand led to appearance of hyperplastic lesions resembling prostatic intraepithelial neoplasia [4]. The role of IGF1 in prostate cancer development is further supported by epidemiological studies showing an increase in serum IGF1 levels in patients who later developed the disease [5]. The physiological and pathological actions of IGF1 in the prostate gland are mediated by the IGF1 receptor (IGF1R), a tyrosine kinase-containing cell surface receptor with potent cell-survival and antiapoptotic activities [6, 7]. Most experimental and clinical evidence is consistent with the notion that acquisition of a malignant phenotype is an IGF1R-dependent process. However, its involvement in advanced stages of the disease is still controversial. It was previously shown that progression of prostate cancer from an organ-confined, androgen-sensitive disease to a metastatic, androgen-independent disorder is associated with a marked decrease in IGF1R expression [8]. Other studies, nonetheless, showed sustained up-regulation of IGF1R levels at advanced stage disease, including metastases [9, 10]. The mechanisms and pathways associated with regulation of IGF1R gene expression and action in prostate cancer remain largely unidentified.
Regulation of IGF1R gene expression is mainly attained at the transcriptional level [3, 11]. Comprehensive analyses of IGF1R promoter-binding nuclear proteins led to the identification of cis-elements and trans-acting factors that are responsible for the tightly regulated expression of the IGF1R gene in organ- and temporal-specific manners [12]. Transcription rate of the IGF1R gene is heavily dependent on a number of stimulatory nuclear proteins, including zinc-finger transcription factor Sp1 [13, 14], E2F1 [15], Krüppel-like factor-6 (KLF6) [16], High-mobility group AT-hook (HMGA1) [17], androgen receptor (AR) [18], etc. In addition, IGF1R biosynthesis is regulated by a number of negative transcriptional regulators, including p53/p63/p73 [19, 20], Breast cancer gene-1 (BRCA1) [21–23], Wilm’s tumor-1 (WT1) [24–26], von-Hippel Lindau (VHL) [27], etc.
Tumor specific translocations that disrupt the architecture of transcription factors are a common theme in oncogenesis [28, 29]. These rearrangements create chimeras that are composed of modules derived from unrelated genes. Using a bioinformatic approach aimed at discovering candidate oncogenic chromosomal aberrations on the basis of outlier gene expression, Tomlins et al [30] reported the identification of recurrent gene fusions of the 5′ untranslated region of the TMPRSS2 gene to the ERG or ETV1 genes in prostate cancer. The TMPRSS2 gene is located on chromosome 21 and is highly expressed in prostate epithelium. The gene encodes a 492-amino acid serine protease with five distinct domains, including a transmembrane region [31]. While the normal function of TMPRSS2 is unknown, the TMPRSS2 gene has been identified as an androgen-responsive gene. Fusion of this gene to members of the ETS family of transcription factors, in particular ERG or ETV1, leads to overexpression of the oncogenes in a large portion of prostate cancer cases, but not in benign prostate samples, in an androgen-dependent manner. The downstream targets of ERG and ETV1 in prostate cancer have not yet been identified.
In view of the role of fusion protein TMPRSS2-ERG in prostate cancer and to expand our previous studies on the transcriptional regulation of the IGF1R gene, we examined the hypothesis that the IGF1R gene constitutes a novel downstream target for the TMPRSS2-ERG prostate-specific chimera. Results obtained revealed that (i) the fusion-encoded ERG oncogene is a potent trans-activator of the IGF1R gene; (ii) enhanced IGF1R expression is mediated at the level of IGF1R promoter transcription; and (iii) enhanced IGF1R expression leads to activation of cell-survival downstream signaling pathways. Accelerated IGF1R transcription was associated with elevated expression of zinc-finger transcription factor Sp1. In addition, using a mass spectroscopy proteomic approach we identified a series of ERG interactors that might be involved in ERG-mediated IGF1R transcription, processing and internalization.
RESULTS
Effect of T-ERG fusion protein expression on IGF1R levels
The important role of IGF1R in prostate cancer initiation and progression has been well established. To investigate the potential effect of the TMPRSS2-ERG fusion protein on IGF1R gene expression, we employed two metastatic prostate cancer-derived cell lines with or without the chimera: the VCaP cell line, which expresses the chimeric protein in an endogenous manner, and the M12 cell line, which is devoid of the fusion protein. Infection of M12 cells with an ERG-encoding retroviral vector led to a marked increase in IGF1R levels in comparison to control (uninfected) cells (Figure 1A). Of interest, enhanced IGF1R levels were seen both in the precursor (~250-kDa) and mature (~100-kDa) IGF1R forms. To corroborate these results, ERG knockdown was performed in VCaP cells using an siRNA directed against the fusion protein (siERG) at doses of 5 and 10 nM, or non-targeting siRNA (NT) as control. As expected, the decreased T-ERG levels seen as a result of the siRNA treatments were associated with reduced IGF1R levels in comparison to controls (Figure 1B). Treatment with 10 nM siERG for 96 hr led to a 40-95% reduction in IGF1R levels. To examine the correlation between IGF1R protein and mRNA levels in response to T-ERG silencing, levels of IGF1R mRNA were measured by quantitative RT-PCR in siERG-transfected VCaP cells. ERG silencing led to 40% and 90% decreases in IGF1R mRNA levels at 48 and 72 hr, respectively, post-transfection (Figure 1C).
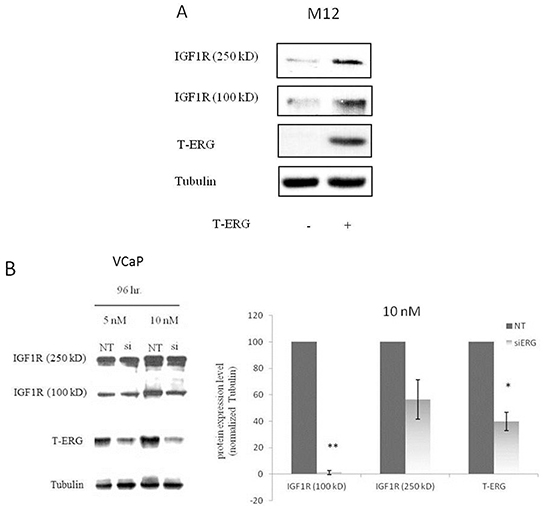
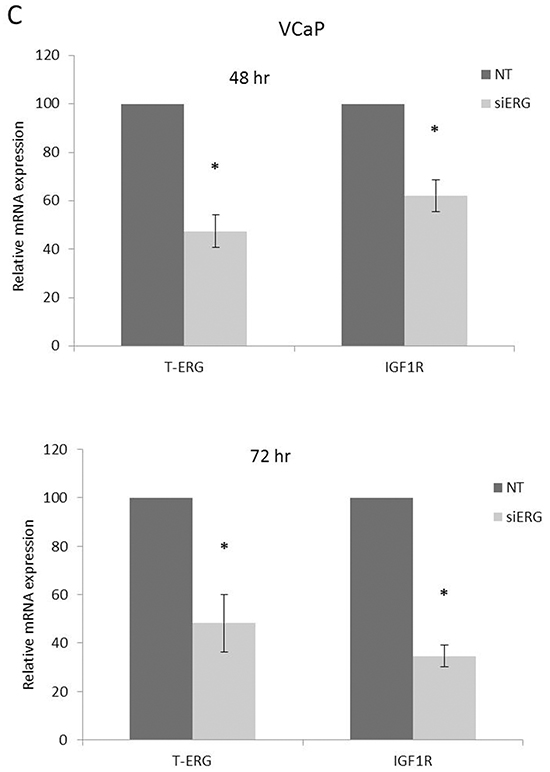
Figure 1: Effect of TMPRSS2-ERG on IGF1R protein and mRNA levels in prostate cancer cells. A. M12 cells were infected with a T-ERG-encoding viral vector. Cells were lysed, electrophoresed through SDS-PAGE, followed by transfer and incubation with an IGF1Rβ subunit antibody. Both the mature (100-kDa) and precursor (250-kDa) forms of the IGF1R are displayed. B. VCaP cells were transfected with an siRNA directed against the fusion protein (siERG) at doses of 5 or 10 nM, or control non-targeting (NT) siRNA. Cells were harvested after 96 hr, and levels of T-ERG and IGF1R were measured by Western blots; *, p < 0.05 versus control; **, p < 0.01 versus control. C. VCaP cells were transfected with siERG (or NT) for 48 or 72 hr. Total RNA was then extracted and quantitative RT-PCR was performed using specific primers. Hsc70 primers were used to measure housekeeping gene hsc70 mRNA levels. *, p < 0.05 versus control (n=3 independent experiments).
Effect of T-ERG fusion protein expression on IGF1R downstream mediators
To assess the effect of the T-ERG fusion protein on IGF1-mediated signaling, siERG-transfected VCaP cells were treated with IGF1 for 10 min. Western blot analysis using an anti-phospho IGF1R revealed that ERG knockdown led to a 56% decrease in phosphorylation of the IGF1R precursor (250-kDa) and total abrogation of the phosphorylated mature IGF1R (100-kDa) (Figure 2). Moreover, a marked reduction (40%) was also observed in phospho-Akt levels upon siERG silencing. These results are consistent with a reduction in IGF1R activation and an overall decrease in IGF1-mediated downstream pathways activity.
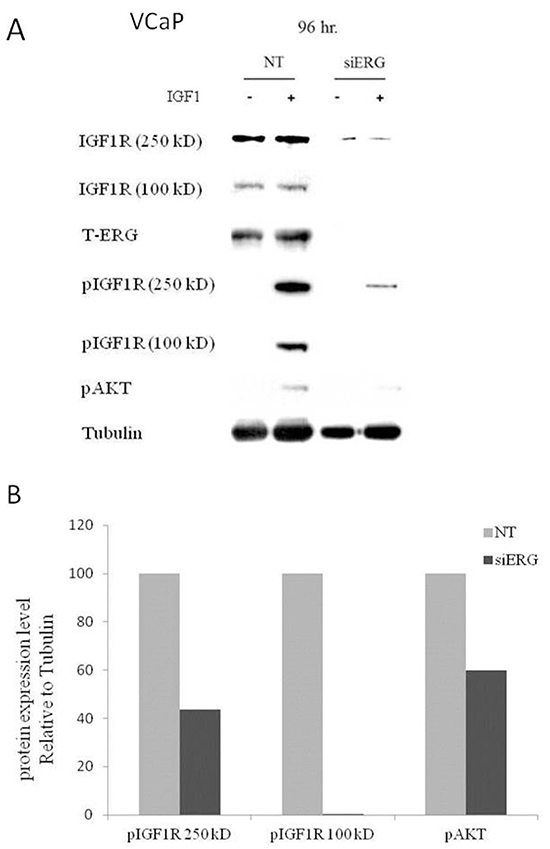
Figure 2: Effect of T-ERG expression on IGF1R downstream mediators. A. VCaP cells were transfected with siERG (or NT, for control purposes) for 96 hr, followed by IGF1 treatment (50 ng/ml) during the last 10 min of the incubation period. Whole-cell lysates (100 μg) were resolved on SDS-PAGE and immunoblotted with antibodies against pIGF1R, T-IGF1R, T-ERG, pAkt, and tubulin. -, no IGF1 treatment; +, with IGF1 treatment. B. Scanning densitometry analysis of phospho-IGF1R and phospho-Akt. Bars represent phospho-protein levels of IGF1-treated cells normalized to tubulin values. Results of a representative experiment repeated three times with similar results are shown.
Effect of T-ERG fusion protein expression on IGF1R promoter activity
To examine whether T-ERG regulation of IGF1R expression is mediated at the level of transcription, M12 cells were transiently transfected with a proximal IGF1R promoter-luciferase reporter construct [p(-476/+640)LUC], containing 476 bp of 5′-flanking region and 640 bp of 5′-untranslated region, in the absence or presence of a T-ERG expression vector, along with a β-galactosidase vector. After 48 hr cells were harvested and luciferase and β-galactosidase activities were measured. As shown in Figure 3A, T-ERG expression led to a 23-fold increase in IGF1R promoter activity in comparison to cells transfected with an empty expression vector (phCMV2). To confirm the ability of T-ERG to control IGF1R gene transcription, promoter activity was assessed in siERG-transfected VCaP cells. As expected, T-ERG silencing led to a 60% reduction in IGF1R promoter activity (Figure 3B).
Figure 3: Effect of T-ERG on IGF1R promoter activity. M12 A. and VCaP B. cells were cotransfected with 1 μg of p(-476/+640)LUC promoter reporter plasmid, along with 1 μg of T-ERG expression vector (or empty phCMV2) and 0.3 μg of pCMV β using the JetPEI transfection reagent. Luciferase and β-galactosidase activities were measured after 48 hr. Promoter activities are expressed as luciferase values normalized for β-galactosidase. Results are mean ± S.E.M. of 3 independent experiments, performed in duplicate dishes; *, p < 0.05 versus control; **, p < 0.01 versus control.
Deletion analysis of T-ERG stimulation of IGF1R promoter activity
To identify the IGF1R promoter region responsible for mediating the effect of T-ERG, cotransfections were performed using promoter constructs with sequentially deleted 5′ flanking regions [p(-188/+640)LUC and p(-40/+640)LUC] (Figure 4A). Results of deletion analyses showed that the stimulatory effect of T-ERG was obliterated in cells transfected with shorter promoter fragments lacking the DNA region between nucleotides -476 and -188. Hence, our data indicate that sequences contained within this 5′-flanking fragment are critical for the stimulatory effect of T-ERG on IGF1R promoter activity (Figure 4B).
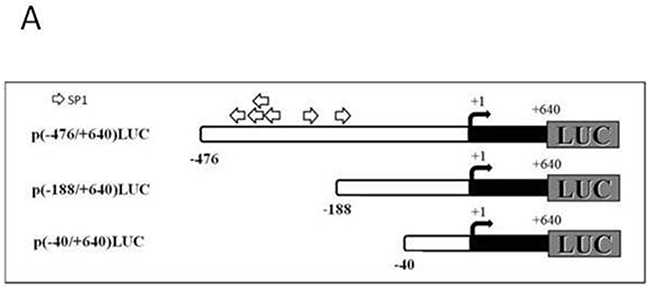
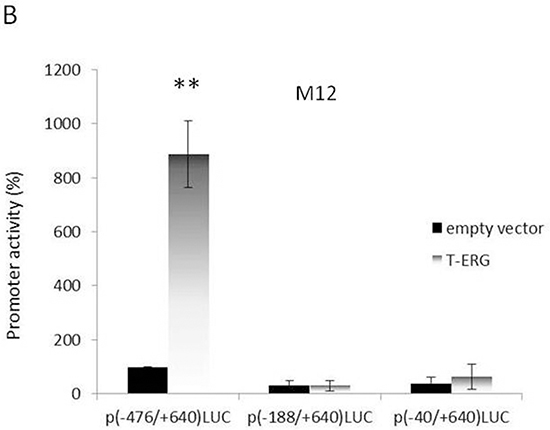
Figure 4: Deletion analysis of T-ERG effect on IGF1R promoter activity. A. Schematic diagram of IGF1R promoter fragments used in transient transfection assays. Plasmids p(-476/+640)LUC, p(-188/+640)LUC, and p(-40/+640)LUC contain, respectively, 476, 188, and 40 bp of 5′-flanking region (open bar) and 640 bp of 5′-untranslated region (closed bar) of the IGF1R gene, fused to a luciferase cDNA (LUC). An arrow denotes the transcription ‘initiator’ element. The luciferase cDNA is not shown to scale. Open arrows denote a cluster of Sp1 sites. B. M12 cells were cotransfected with 1 μg of the indicated reporter plasmids, along with 1 μg of the T-ERG expression vector (or empty phCMV2) and 0.3 μg of pCMVβ using the JetPEI reagent. Luciferase and β-galactosidase activities were measured after 48 hr. Promoter activities are expressed as luciferase values normalized for β-galactosidase. Results are mean ± S.E.M. of 3 independent experiments, performed in duplicate dishes. **, p<0.01 versus control.
Effect of T-ERG fusion protein on transcription factor Sp1
Previous studies have identified a cluster of Sp1 binding sites in the IGF1R proximal promoter region comprised between nucleotides -476 and -188 [13, 14]. Furthermore, zinc finger protein Sp1 expression was shown to be critical to achieve high levels of IGF1R mRNA and protein in most transformed cells. Hence, we examined whether TMPRSS2-ERG effect involves stimulation of transcription factor Sp1. To this end, siERG-transfected VCaP cells were harvested 96 hr post-transfection and Sp1 abundance was assessed by Western blot analysis. As shown in Figure 5A, T-ERG knockdown led to a 47% decrease in Sp1 levels. This reduction correlated with an 50% decrease in Sp1 mRNA levels at 72 hr post transfection (Figure 5B). Of interest, T-ERG knockdown did not affect Sp1 levels at 48 hr post transfection, implying that the effect of T-ERG on Sp1 level is most probably mediated via protein stabilization. In agreement, T-ERG-expression in M12 cells led to an increase in Sp1 levels (Figure 5C).
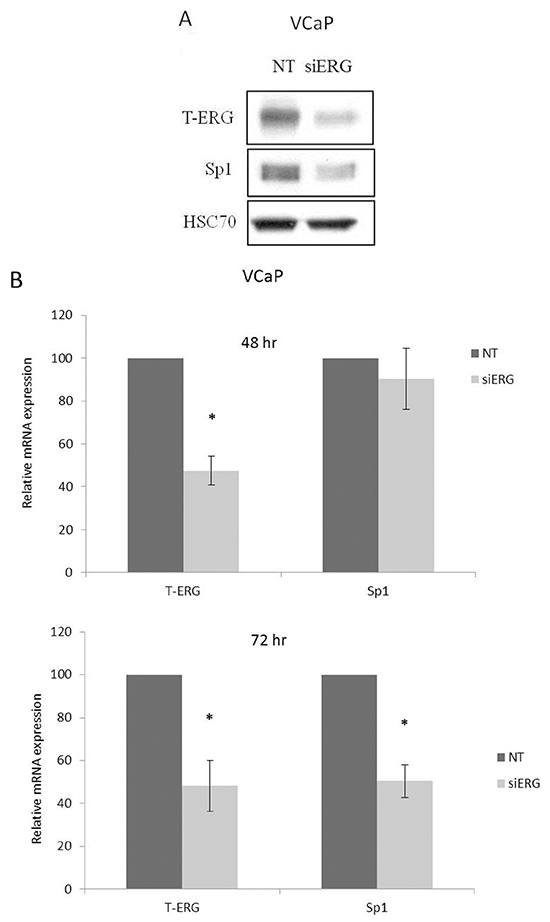
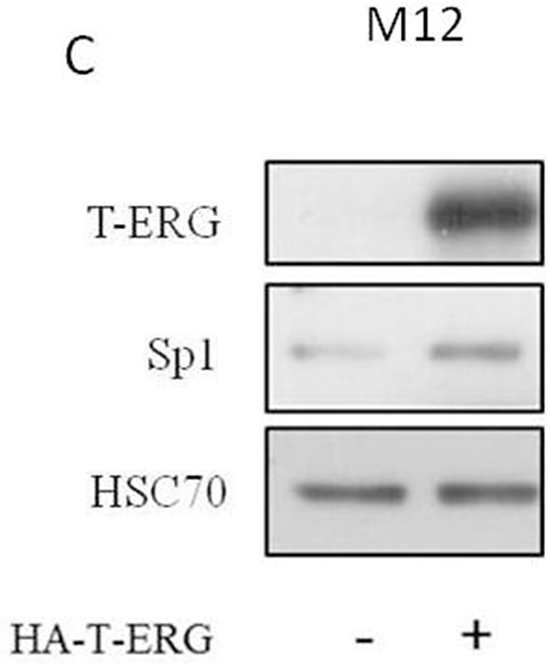
Figure 5: Effect of T-ERG expression on transcription factor Sp1. A. VCaP cells were transfected with siERG (or NT) for 96 hr. Whole-cell lysates (100 μg) were resolved on SDS-PAGE and immunoblotted with an anti-Sp1 antibody. Levels of hsc70 were used as a loading control. B. Total RNA was extracted from siERG-transfected VCaP cells at 48 and 72 hr and Sp1 mRNA levels were measured by quantitative RT-PCR. Hsc70 mRNA levels were measured for control purposes; *, p < 0.05 versus control (n=3). C. M12 cells were transfected with a T-ERG-expression vector (or empty phCMV2) and Sp1 levels were measured after 48 hr. Results of a representative experiment repeated three times with similar results are shown.
Co-immunoprecipitation (Co-IP) assays of Sp1 and T-ERG
To test for a possible physical interaction between Sp1 and T-ERG, co-IP assays were performed using extracts from M12 cells expressing an HA-tagged T-ERG (HA-T-ERG), with or without a co-expressed GFP-tagged Sp1 (pEGFP-Sp1). Results of co-IP assays showed that both the endogenous Sp1 protein (Figure 6A) as well as the expressed GFP-Sp1 (Figure 6B) was co-immunoprecipitated with HA-T-ERG by anti-HA antibodies. These data demonstrate that transcription factor Sp1 physically interacts with T-ERG. Unfortunately, attempts to detect an interaction between the endogenous proteins did not succeed.
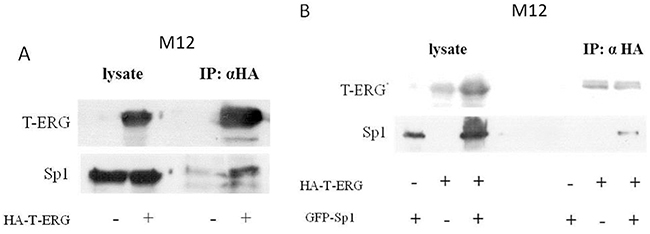
Figure 6: Co-immunoprecipitation assays of Sp1 and T-ERG. M12 cells were transfected with 5 μg of a T-ERG expression vector (or empty phCMV2) A. or co-transfected with T-ERG expression vector and 5 μg of an Sp1 expression vector (or empty GFP vector) B. Cell lysates were co-immunoprecipitated using anti-HA (panels A and B). Results of a representative experiment repeated twice with similar results are shown.
Mithramycin experiments
The Sp1 inhibitor mithramycin was used to further analyze the role of Sp1 on T-ERG-dependent IGF1R overexpression. To this end, M12 cells were transiently transfected with a T-ERG expression vector, after which cells were incubated with 200 nM mithramycin for 24 hr. Results of Western blots indicate that the T-ERG-mediated upregulation of IGF1R levels was abolished by Sp1 inhibition. Protein levels, however, were largely reduced as a result of the mithramicyn treatment (data not shown). Nevertheless, a downregulation effect on T-ERG levels was observed in mithramycin-treated samples. To validate this results and to investigate whether Sp1 inhibition may affect endogenous T-ERG expression, VCaP cells were incubated with 200 nM mithramicyn for 24 hr and analyzed by Western blotting. Sp1 inhibition by mithramycin involves binding to GC-rich DNA sequences and displacement of transcription factor Sp1 from its binding sites. Accordingly, only a minor downregulation of Sp1 protein levels was observed (Figure 7A). Downregulation of IGF1R protein levels is consistent with Sp1 involvement in IGF1R gene regulation [13, 14].
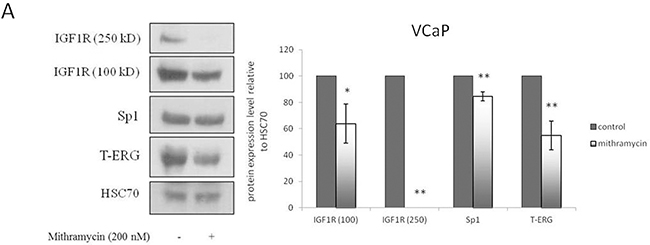
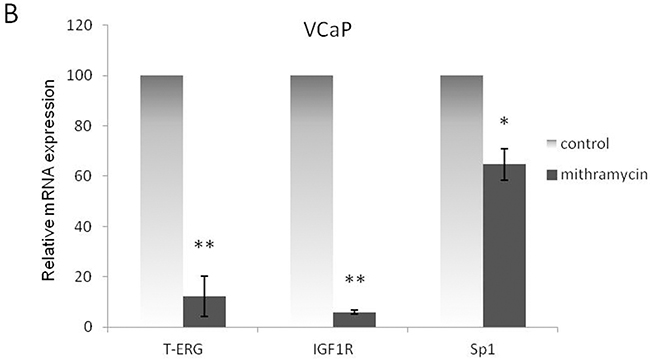
Mithramycin studies. VCaP cells were treated with mithramycin for 24 hr. Protein levels were measured by Western blots A. and mRNA levels were measured by quantitative PCR. VCaP cells were treated with mithramycin for 24 hr. Protein levels were measured by Western blots B. Results are mean ± S.E.M. of 3 independent experiments, performed in duplicate dishes *, p < 0.05 versus control; **, p < 0.01 versus control.
Of interest, results obtained show that T-ERG protein levels were downregulated by 46% as a result of the mithramycin treatment. Data are consistent with either activation of TMPRSS2-ERG expression by Sp1 or, alternatively, stabilization of the chimera. To assess the effect of Sp1 activity on T-ERG mRNA expression levels, quantitative RT-PCR was performed on mithramycin-treated VCaP cells. Results showed that, in addition to its effect on IGF1R mRNA expression, mithramycin also reduced T-ERG mRNA levels (Figure 7B).
Effect of TMPRSS2-ERG expression on IGF1R-directed targeted therapy
Given the key role of fusion protein TMPRSS2-ERG in regulation of IGF1R gene expression, we decided to evaluate next the hypothesis that IGF1R targeted therapy might be more effective in prostate cancer cells expressing the fusion protein in comparison to cells that do not express the chimera. To this end, siERG-transfected VCaP cells were treated with NVP-AEW541, a selective IGF1R inhibitor, followed by evaluation of proliferation rate. As shown in Figure 8, T-ERG-silenced cells were affected to a lower extent by the IGF1R inhibitor compared to T-ERG-expressing cells (55% vs. 75% inhibition). These results are consistent with an effect of TMPRSS2-ERG on the outcome of IGF1R-directed therapies.
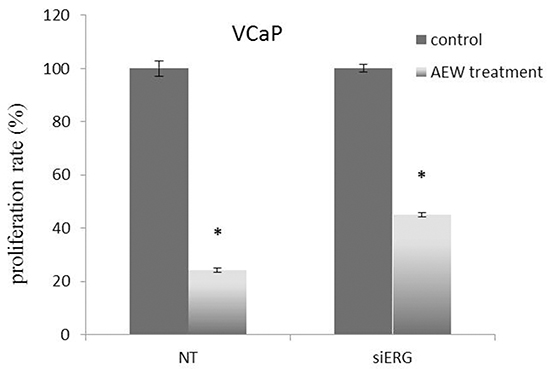
Figure 8: Effect of TMPRSS2-ERG expression on IGF1R-directed targeted therapy. VCaP cells were transfected with 40 nM of siERG (or NT siRNA for control purposes). Forty-eight hours post-transfection cells were treated with the selective IGF1R inhibitor AEW541 for an additional 48 hr and proliferation rate was measured by XTT assays. Results are mean ± S.E.M. of 3 independent experiments. *, p < 0.05 versus control.
Proteomic analysis of TMPRSS2-ERG co-activators
In view of the fact that most transcriptional activators function as multiprotein complexes, and given our results showing that the effect of T-ERG on IGF1R gene expression involves activation of transcription factor Sp1, we decided to investigate the potential physical interactions of T-ERG in the specific context of IGF1R promoter regulation. In particular, we were interested in identifying T-ERG interactions that may be linked to transcription factor Sp1. To that end, we performed an immunoprecipitation assay in T-ERG-transfected M12 cells using an HA antibody (directed against the HA-tag encoded by the T-ERG expression vector), and anti-IgG as control. Mass spectroscopic analysis was performed to identify possible interactors. Overall, we identified 22 proteins that specifically interact with T-ERG compared to the control (Table 1 and Figure 9). Among these proteins we identified Fli1 and ETV6, which are known interactors involved in the transcriptional machinery [32]. Additionally, we found multiple proteins that are involved in protein transport and internalization (e.g., AP2M1, CAV1).
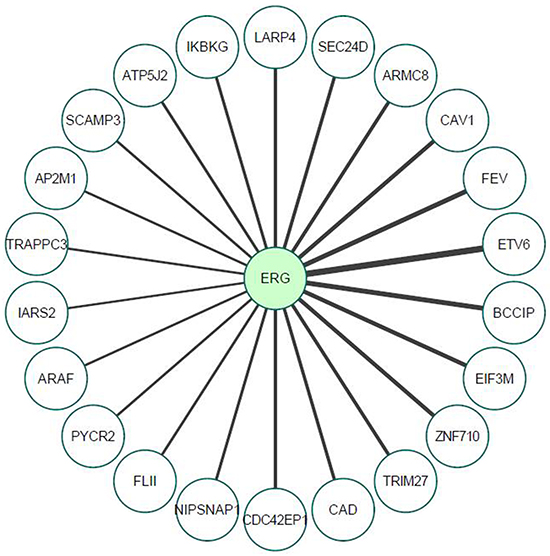
Figure 9: Proteomic analysis of TMPRSS2-ERG interactors, as determined by mass spectrometry. M12cellswere transfected with a T-ERG expression vector (or empty phCMV2). Cells were harvested and total cell lysates were co-immunoprecipitated using an anti-HA antibody (co-IP assays were performed in triplicates) followed by mass spectrometry analysis. Line thickness represents Welch difference (see also Table 1).
Table 1: List of TMPRSS2-ERG interacting proteins identified by mass spectroscopy-based proteomic analysis
Gene Name |
Protein Name |
Uniprot ID |
Welch difference |
Welch p-value |
|---|---|---|---|---|
ETV6 |
Transcription factor ETV6 |
P41212 |
5.912296 |
0.019847 |
BCCIP |
BRCA2 and CDKN1A-interacting protein |
Q9P287 |
4.570442 |
0.001063 |
FEV |
Protein FEV |
Q99581 |
4.39208 |
0.026563 |
EIF3M |
Eukaryotic translation initiation factor 3 subunit M |
Q7L2H7 |
3.941612 |
0.000997 |
CAV1 |
Caveolin-1;Caveolin |
Q03135 |
3.797178 |
0.004396 |
ZNF710 |
Zinc finger protein 710 |
Q8N1W2 |
3.739227 |
0.050713 |
ARMC8 |
Armadillo repeat-containing protein 8 |
Q8IUR7 |
3.284602 |
0.008734 |
TRIM27 |
Zinc finger protein RFP |
P14373 |
3.202928 |
0.013209 |
SEC24D |
Protein transport protein Sec24D |
O94855 |
3.120237 |
0.02775 |
CAD |
CAD protein;Glutamine-dependent carbamoyl-phosphate synthase;Aspartate carbamoyltransferase;Dihydroorotase |
P27708 |
3.021694 |
0.002832 |
LARP4 |
La-related protein 4 |
Q71RC2 |
2.965799 |
0.005252 |
CDC42EP1 |
Cdc42 effector protein 1 |
Q00587 |
2.931694 |
0.025826 |
IKBKG |
NF-kappa-B essential modulator |
Q9Y6K9 |
2.732973 |
0.023957 |
NIPSNAP1 |
Protein NipSnap homolog 1 |
Q9BPW8 |
2.613799 |
0.042976 |
ATP5J2 |
ATP synthase subunit f, mitochondrial |
P56134 |
2.555076 |
0.023341 |
FLII |
Protein flightless-1 homolog |
Q13045 |
2.406607 |
0.02791 |
SCAMP3 |
Secretory carrier-associated membrane protein 3 |
O14828 |
2.312815 |
0.008636 |
PYCR2 |
Pyrroline-5-carboxylate reductase 2 |
Q96C36 |
2.279021 |
0.010961 |
AP2M1 |
AP-2 complex subunit mu |
Q96CW1 |
2.20255 |
0.009602 |
ARAF |
Serine/threonine-protein kinase A-Raf |
P10398 |
2.181118 |
0.003241 |
TRAPPC3 |
Trafficking protein particle complex subunit 3 |
O43617 |
2.154572 |
0.007609 |
IARS2 |
Isoleucine--tRNA ligase, mitochondrial |
Q9NSE4 |
2.026957 |
0.003098 |
Of interest, different receptor tyrosine kinases, including IGF1R, are known to internalize through clathrin/caveolin-dependent pathways. Furthermore, clathrin or caveolin-1 (CAV1) inhibition blocked IGF1R internalization [33]. In line with this finding, two candidate interactors: AP-2 complex subunit mu (AP2M1) and CAV1 were selected for follow up analysis. To validate the physical interaction between CAV1, AP-2 and T-ERG co-immunoprecipitation assays were conducted using VCaP cells. As shown in Figure 10, T-ERG was co-immunoprecipitated with CAV1 by anti-CAV1, hence demonstrating that CAV1 physically interacts with T-ERG. In addition, AP-2, Sp1 and IGF1R were also co-immunoprecipitated with CAV1, implying the existence of a multimeric complex with yet unidentified role/s.
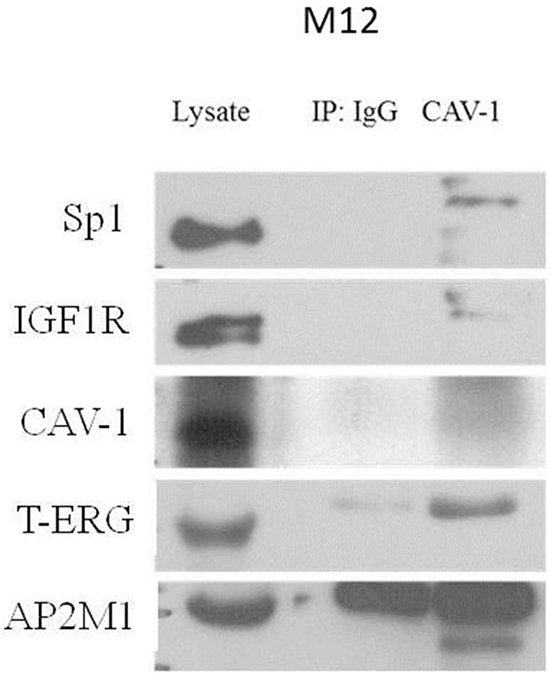
Figure 10: Co-immunoprecipitation assay of T-ERG with CAV1 and AP2M1. VCaP cells were harvested and lysates were co-immunoprecipitated using an anti-CAV1 antibody (or anti-IgG as control). Membranes were blotted with the indicated antibodies. Results of a representative experiment repeated twice with similar results are shown.
Effect of TMPRSS2-ERG on cellular localization of IGF1R
Given the results of co-immunoprecipitation assays and in light of the fact that CAV1 and AP-2 participate in the IGF1R internalization process [33], we proceeded to examine the effect of T-ERG on IGF1R cellular localization. Fractionation assays were performed using T-ERG transfected M12 cells, followed by Western blot analyses. As shown in Figure 11, T-ERG overexpression led to a marked decrease in nuclear IGF1R levels.
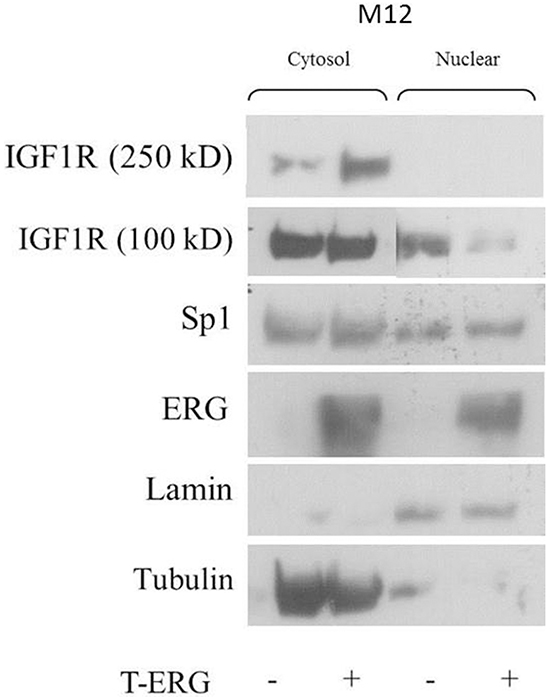
Figure 11: Effect of TMPRSS2-ERG on cellular localization of IGF1R. M12 cells were transfected with a T-ERG expression vector (or empty phCMV2) for 48 hr. Then, cells were harvested and fractionated into cytoplasmic and nuclear fractions, followed by Western blot analysis. Results of a representative experiment repeated three times with similar results are shown.
DISCUSSION
The identification of TMPRSS2-ERG as an important player in prostate cancer etiology had a major impact in basic and translational oncology. Recurrent chromosomal translocations leading to pathologic production of disrupted transcription factors are now recognized as a common event in adult epithelial tumors. The present study identifies the IGF1R gene as a novel downstream target for the TMPRSS2-ERG fusion protein in prostate cancer. Specifically, our analyses provide evidence of physical and functional links between frequent, cancer-specific, chromosomal rearrangements and the IGF1 signaling pathway, an important cell survival network. The chimeric protein TMPRSS2-ERG constitutes a prototype of a growing family of aberrant transcription factors harboring domains encoded by discrete genes [30]. For the most part, disrupted transcription factors exhibit gain-of-function activity that abrogates the intrinsic biological activity of each of the parental genes. In the specific case of TMPRSS2-ERG, the androgen sensitivity of the TMPRSS2 promoter is responsible for the steroid-dependent expression of oncogene ERG in prostate epithelium, a key event in prostate carcinogenesis.
In the present study we showed that T-ERG expression in TMPRSS2-ERG-null M12 cells led to a major increase in IGF1R levels. Conversely, T-ERG silencing in TMPRSS2-ERG-containing VCaP cells led to a reduction in IGF1R expression. Decreased IGF1R levels were associated with a reduction in IGF1R activation as well as diminished phosphorylation of downstream target Akt. In terms of the mechanism of action of TMPRSS2-ERG, our data indicates that oncogene T-ERG stimulates IGF1R promoter activation. These results are consistent with a recent study which identified the IGF1R as a target of T-ERG action in prostate cancer cells [34]. On the basis of Mancarella’s and our data, we aimed at elucidating the mechanistic aspects of the T-ERG-dependent IGF1R upregulation. Deletion analysis of the promoter allowed us to map a proximal promoter fragment, which seems to be responsible for the transcriptional effect of T-ERG. This promoter fragment, contained within nts -476 and -188 of the IGF1R 5′-flanking region, was shown previously to be extremely GC-rich (approximately 75% GC-content) and to contain a cluster of four Sp1 binding consensus sequences (GGGCGG). Sp1 was identified as a cardinal transactivator of the IGF1R gene in different tumor types, including prostate cancer [13]. Furthermore, Sp1 was demonstrated to play key roles in transactivation or transrepression of the IGF1R gene by a number of transcription factors, including the Wilm’s tumor protein-1 [35] (WT1), estrogen receptor- [36], BRCA1 [21, 22], etc. We provide here evidence that T-ERG activates Sp1 expression, suggesting that the stimulatory effect of the fusion protein on IGF1R gene expression might be mediated, at least in part, via transcription factor Sp1. Of interest, the fact that inhibition of Sp1 action by mithramycin led also to a reduction in T-ERG levels is consistent with a bidirectional mode of action by which Sp1 levels are enhanced by TMPRSS2-ERG and, concomitantly, fusion protein expression and/or action are dependent on Sp1 expression.
Furthermore, proteomic analyses identified new ERG interactors including CAV1 and AP-2. Recent studies have demonstrated that IGF1R is internalized via clathrin- and CAV1-dependent mechanisms, and that both proteins are physically involved [33]. In support of our findings, a previous study has shown a physical interaction between IGF1R and CAV1 [37]. Data may imply an involvement of T-ERG in IGF1R internalization. We show, using fractionation assays, that the presence of T-ERG decreases nuclear IGF1R levels. Taken together, we envision a mechanism by which T-ERG enhances the IGF1R internalization process, leading to enhanced IGF1R activation. These novel ERG physical interactions may contribute to a stabilized cytoplasmic IGF1R and lower nuclear IGF1R levels.
The IGF1R gene has been identified as a downstream target of a series of disrupted transcription factors. EWS-WT1, the chimeric product of a recurrent t(11;22)(p13;q12) translocation that fuses the 5′ exons of the EWS gene to the 3′ exons of the WT1 gene, constitutes the distinctive hallmark of desmoplastic small round cell tumor (DSRCT) [38–40]. Consistent with its oncogenic role, EWS-WT1 was shown to transactivate the IGF1R gene, unlike the WT1 component of the chimera which, in its wild type, untranslocated form strongly suppresses IGF1R transcription [26, 41]. Likewise, the PAX3-FKHR fusion protein characteristic of alveolar rhabdomyosarcoma was shown to transactivate the IGF1R promoter in sarcoma-derived cell lines [42]. The untranslocated PAX3 protein had a reduced potency. Taken together, regulation of IGF1R gene expression by aberrant transcription factors constitutes a common theme in oncology [43, 44]. The ability of unrelated disrupted gene products to control IGF1R transcription emphasizes the central role of this tyrosine kinase receptor as a critical regulator of cancer initiation and progression.
The regulation of the IGF1R gene by androgens has been recently explored using a series of isogenic prostate-derived cell lines and human xenografts [18]. We demonstrated that basal and phosphorylated IGF1R levels progressively decreased as prostate cancer cells became more tumorigenic and metastatic. In addition, we showed that wild type, but not mutant, AR along with dihydrotestosterone treatment increased IGF1R promoter activity and endogenous IGF1R levels. ChIP analysis showed enhanced AR binding to the IGF1R promoter in AR-overexpressing cells. Combined, we provided evidence that activated wild type AR enhances IGF1R transcription in prostate cancer cells via a mechanism that involves AR binding to the IGF1R promoter. AR mutations may alter the ability of the mutated protein to regulate IGF1R expression. The results of the present study provide evidence of an additional, indirect mechanism for androgen-mediated regulation of IGF1R levels. The physiological and pathological relevance of direct and indirect mechanisms for androgen regulation of IGF1R gene expression must be further explored.
In the pathophysiological context of prostate cancer, TMPRSS2-ERG fusion proteins are presumably functioning in the presence of the wild type, untranslocated ERG protein. The interactions between the translocation product and the full-length, untranslocated, ERG and, in particular, the impact of this interplay on IGF1R gene regulation must be further explored. As an anti-cancer target, the IGF1R axis has been studied in many clinical trials over the past years. However, most trials involving patients with adult tumors failed to show clinical benefit in the overall patient population. Our data show that the decreased proliferation rate achieved upon NVP-AEW541 IGF1R inhibitor treatment was less pronounced in ERG-silenced cells as compared to NT-transfected cells. If corroborated by larger clinical studies, these results may identify fusion protein TMPRSS2-ERG as a potential biomarker for IGF1R targeted therapy.
In conclusion, our results demonstrate that the IGF1R gene is a biologically relevant target for a novel family of prostate cancer-specific chimeric proteins. The net result of this chromosomal translocation is the in-situ production of oncogene ERG in an apparently androgen-dependent manner. Transactivation of the IGF1R gene by oncogene ERG constitutes a key event in prostate cancer development. Enhanced activation of the overexpressed IGF1R by locally produced or circulating IGF1 or IGF2 may provide a selective advantage to tumoral cells.
MATERIALS AND METHODS
Cell cultures
VCaP, a bone metastasis-derived cell line, was obtained from Dr. Raanan Berger (Sheba Medical Center, Israel). VCaP cells express the TMPRSS2-ERG chimera in an endogenous fashion. The VCaP cell line was maintained in DMEM medium containing 10% fetal bovine serum (FBS), 7.5% sodium bicarbonate, 11 mg/ml sodium pyruvate, 2 mM glutamine and 100 units/ml penicillin + 100 mg/ml streptomycin. Derivation of the M12 prostate cancer cell line has been previously described [45]. M12 cells are tumorigenic, highly metastatic and exhibit reduced IGF1 responsiveness. M12 cells do not express the TMPRSS2-ERG fusion protein. M12 cells were maintained in RPMI-1640 medium containing 10% FBS, 2 mM glutamine, 50 mg/ml gentamicin sulfate and 5.6 mg/ml fungizone. The M12 cell line was a gift of Dr. Joy L. Ware (Medical College of Virginia, Richmond, VA, USA). All reagents were purchased from Biological Industries Ltd., Kibbutz Beit Haemek, Israel.
ERG overexpression studies
For stable transfections, human embryonic kidney 293T cells were cultured in DMEM medium with 10% FBS, 100 units/ml penicillin and 100 mg/ml streptomycin. The plasmids PWZL-tERG (Addgene, Cambridge, MA, USA) and PCL-amp (virus envelope) were transfected using the JetPEI® tranfection reagent (Polyplus Transfection Inc., Illkirch, France). Virus was harvested 48 hr post-transfection, filtered through a 0.45 μm pore membrane and Polybrene (4 μg/ml) (Sigma-Aldrich Co., St. Louis, MO, USA) was added to increase the efficiency of infection. To infect M12 cells with the retroviral vectors, cells were plated in 6-well plates two days before infection. Medium was removed and retrovirus was added. Virus-containing medium was removed 6 hr after infection and fresh cell culture medium was added. Three days post-infection cells from each two wells were removed into a 10-cm plate and selection was applied using 0.5 μg/ml blasticidin antibiotics. Stable cells were achieved approximately two weeks post-infection.
ERG knockdown studies
For small interference RNA (siRNA) knockdown of ERG, siRNA against human ERG was purchased from Dharmacon Research Inc. (Lafayette, CO, USA). Negative control (non-targeting, NT) or siRNA against ERG was transfected into VCaP cells using INTERFERin® (Polyplus Transfection Inc.). Briefly, VCaP cells were seeded into 6-well plates the day before transfection, and 5 or 10 nM of siRNA and 6 μl of INTERFERin® were used for each transfection. siRNA knockdown of ERG was tested by immunoblot analysis.
Plasmids and DNA transfections
For transient co-transfection experiments, genomic DNA fragments extending from nucleotides -476 to +640, -188 to +640, or −40 to +640 of the rat IGF1R gene (nucleotide 1 corresponds to the transcription start site) were subcloned upstream of a promoterless firefly luciferase reporter in the p0LUC vector [14, 24]. The T-ERG expression vector was kindly provided by Dr. Vera Magistroni (Università degli Studi di Milano Bicocca, Milan, Italy) [46]. The construct includes the coding region of the human tERG gene (T1/E4 variant), which was inserted into the phCMV2 vector. The T1/E4 variant, which is the tERG most common rearrangement, includes an untranslated region of the TMPRSS2 gene fused to exon 4 of the ERG gene leading to an N-terminal truncated ERG protein that maintains its ERG DNA-binding domain. Since the first three ERG exons are lost during rearrangement, an alternative translation initiation site from an internal ATG codon is used to translate the fusion transcript. Briefly, the overexpressed T-ERG vector contains only coding regions of ERG and encodes a truncated ERG protein. M12 cells and VCaP cells were seeded in 6-well plates and transfected using the JetPEI®reagent, according to manufacturer’s recommendations. Briefly, 1 μg of reporter plasmid, along with 1-1.3 μg of expression vector and 0.3 μg of a β-galactosidase expression plasmid (pCMVβ-, Clontech, Palo Alto, CA, USA) were used per plate. Two μl of transfection reagent were used per 1 μg of DNA. Promoter activities were expressed as luciferase values normalized for -galactosidase activity. For Sp1 expression experiments, the pEGFP-Sp1 vector was employed (Addgene).
RNA isolation and quantitative RT-PCR
Total RNA was extracted with the PerfectPure RNA Tissue kit (5 PRIME, Gaithersburg, MD, USA) according to the manufacturer’s protocol. High capacity cDNA kit (Applied Biosystems, Grand Island, NY, USA) was used to reverse transcribe RNA. Quantitative PCR was performed using an Applied Biosystems StepOne Plus Real Time PCR system with Fast SYBR® Green Mix.
Western blot analyses
Cells were grown to confluence and then serum starved overnight. Ten minutes before harvest, cells were treated with 50 ng/ml of IGF1 (Cytolab Ltd., Rehovot, Israel). After incubation, cells were lysed in a protease-containing buffer. Protein content was determined using the Bradford reagent (Bio-Rad Ltd., Hercules, CA, USA) and bovine serum albumin (BSA) as a standard. Samples were electrophoresed through 10% SDS-PAGE, followed by blotting of the proteins onto nitrocellulose membranes. After blocking with 5% skim milk or 3% BSA, the blots were incubated overnight with the indicated antibodies, washed, and incubated with the appropriate horseradish peroxidase (HRP)-conjugated secondary antibody.
Sp1 inhibition assays
In selected experiments, the Sp1-family inhibitor Mithramycin A (Sigma-Aldrich Co.) was added at a concentration of 200 nM 24 hr before cells harvest.
Co-immunoprecipitation assays
Cell lysates were incubated overnight with 2 mg/ml of anti-HA or anti-CAV1 antibody at 4°C. The precipitates were then incubated with protein A/G agarose beads (Santa Cruz Biotechnology Inc., Santa Cruz, CA, USA) for 3 hr. Immunoprecipitates were pelleted by centrifugation at 2,500 rpm and then washed three times with a washing buffer. Finally, pellets were dissolved in 30 μl of sample buffer, boiled for 10 min, resolved on SDS-PAGE and immunoblotted with the indicated antibody.
Fractionation of cytoplasmic and nuclear proteins
Cells were lysed with harvest buffer (10 mM HEPES pH 7.9, 50 mM NaCl, 0.5 M sucrose, 0.1 mM EDTA, 0.5% Triton X-100, 1 mM DTT, 10 mM tetrasodium pyrophosphate, 100 mM NaF, 17.5 mM beta-glycrophosphate, 1 mM PMSF, 4 μg/ml aprotinin and 2 μg/ml pepstatin A). The samples were centrifuged to pellet nuclei. The cytoplasmic fraction was transferred to a new tube. The nuclei was washed with buffer A (10 mM HEPES pH 7.9, 10 mM KCl, 0.1 mM EDTA, 0.1 mM EGTA, 1 mM DTT, 1 mM PMSF, 4 μg/ml aprotinin and 2 μg/ml pepstatin A) for 10 min. Nuclear proteins were lysed in buffer C (10 mM HEPES pH 7.9, 500 mM NaCl, 0.1 mM EDTA, 0.1 mM EGTA, 0.1% NP-40, 1 mM DTT, 1 mM PMSF, 4 μg/ml aprotinin and 2 μg/ml pepstatin A) for 15 min and transferred to a new tube, followed by the Western blot protocol.
Proliferation assays
Cell proliferation was monitored using an XTT cell proliferation kit (Biological Industries Ltd.) according to manufacturer’s instructions. Twenty-four hr post-siRNA transfection, VCaP cells were seeded at a density of 8,000 cells/ml in 96-well plates. Twenty-four hours after seeding, cells were treated with the NVP-AEW541 selective IGF1R inhibitor (2 μM) (Novartis Pharma, Basel, Switzerland) for 48 hr. Sample absorbance was measured with a spectrophotometer at a wavelength of 450-500 nanometers. Reference absorbance to measure non-specific readings was measured at a wavelength of 630-690 nanometers.
Proteomic analyses of ERG interactors
Immunoprecipitation experiments were conducted as described above with the exception of the elution step. For MS analysis, after washing of the beads they were incubated for 1.5 h with 100 μl of elution buffer (2 M urea, 50 mM Tris-HCl pH 7.5, 1 mM DTT) and 1.5 μl sequencing-grade trypsin were added (stock 0.4 μg/μl, Promega). Beads were pelleted for two min at 1,500 rpm and the supernatant was transferred to a new tube. The process was repeated with a second elution buffer (2 M urea, 50 mM Tris-HCl pH 7.5, 5 mM iodoacetamide). After overnight incubation, 1μl of TFA was added and samples were desalted and concentrated on C18 Stage Tips [47]. Resulting peptides were separated by reverse-phase chromatography using a nanoflow HPLC system (EASY nLC1000; Thermo Fisher Scientific) coupled on-line to a Q-Exactive Plus mass spectrometer (Thermo Fisher Scientific) using a 140-minute linear gradient of water/acetonitrile. Raw MS files were analyzed by MaxQuant [48]. MS/MS spectra were searched against the human Uniprot database (published in May 2013) by the Andromeda search engine [49]. For identification, the false discovery rate (FDR) was set to 0.01 on the protein and peptide levels. Welch’s t-test (FDR=0.05) between the T-ERG samples and control samples was used to determine possible interactors.
Statistical analyses
The statistical significance of differences between groups in proliferation assays was assessed by Student’s t-test (two samples, equal variance). p values < 0.05 were considered statistically significant.
ACKNOWLEDGMENTS
This work was performed in partial fulfillment of the requirements for a Ph.D. degree by Shilhav Meisel Sharon at the Sackler Faculty of Medicine, Tel Aviv University. The authors wish to thank Drs. Joy L. Ware, Raanan Berger and Vera Magistroni for providing cell lines and reagents. This work was supported by a grant from the Israel Science Foundation (885/09) to H.W. H.W. is the incumbent of the Lady Davis Chair in Biochemistry.
CONFLICTS OF INTEREST
The authors declare no Conflicts of Interest.
REFERENCES
1. Samani AA, Yakar S, LeRoith D, Brodt P. The role of the IGF system in cancer growth and metastasis: overview and recent insights. Endocrine reviews. 2007; 28:20-47.
2. Khandwala HM, McCutcheon IE, Flyvbjerg A, Friend KE. The effects of insulin-like growth factors on tumorigenesis and neoplastic growth. Endocrine reviews. 2000; 21:215-244.
3. Werner H, Maor S. The insulin-like growth factor-I receptor gene: a downstream target for oncogene and tumor suppressor action. Trends in endocrinology and metabolism. 2006; 17:236-242.
4. DiGiovanni J, Kiguchi K, Frijhoff A, Wilker E, Bol DK, Beltran L, Moats S, Ramirez A, Jorcano J, Conti C. Deregulated expression of insulin-like growth factor I in prostate epithelium leads to neoplasia in transgenic mice. Proceedings of the national academy of sciences USA. 2000; 97:3455-3460.
5. Chan JM, Stampfer MJ, Giovannucci E, Gann PH, Ma J, Wilkinson P, Hennekens CH, Pollak M. Plasma insulin-like growth factor-I and prostate cancer risk: a prospective study. Science. 1998; 279:563-566.
6. Werner H. The pathophysiological significance of IGF-I receptor overexpression: new insights. Pediatric endocrinology reviews. 2009; 7:2-5.
7. Chitnis MM, Yuen JSP, Protheroe AS, Pollak M, Macaulay VM. The type I insulin-like growth factor-I receptor pathway. Clinical cancer research. 2008; 14:6364-6370.
8. Tennant MK, Thrasher JB, Twomey PA, Drivdahl RH, Birnbaum RS, Plymate SR. Protein and mRNA for the type 1 insulin-like growth factor (IGF) receptor is decreased and IGF-II mRNA is increased in human prostate carcinoma compared to benign prostate epithelium. Journal of clinical endocrinology and metabolism. 1996; 81:3774-3782.
9. Hellawell GO, Turner GD, Davies DR, Poulsom R, Brewster SF, Macaulay VM. Expression of the type 1 insulin-like growth factor receptor is up-regulated in primary prostate cancer and commonly persists in metastatic disease. Cancer research. 2002; 62:2942-2950.
10. Liao Y, Abel U, Grobholz R, Hermani A, Trojan L, Angel P, Mayer D. Up-regulation of insulin-like growth factor axis components in human primary prostate cancer correlates with tumor grade. Human pathology. 2005; 36:1186-1196.
11. Werner H, Roberts CT, Jr. The IGF-I receptor gene: a molecular target for disrupted transcription factors. Genes, chromosomes and cancer. 2003; 36:113-120.
12. Sarfstein R, Belfiore A, Werner H. Identification of insulin-like growth factor-I receptor gene promoter-binding proteins in estrogen receptor (ER)-positive and ER-depleted breast cancer cells. Cancers. 2010; 2:233--261.
13. Beitner-Johnson D, Werner H, Roberts CT, Jr, LeRoith D. Regulation of insulin-like growth factor I receptor gene expression by Sp1: Physical and functional interactions of Sp1 at GC boxes and at a CT element. Molecular endocrinology. 1995; 9:1147-1156.
14. Werner H, Bach MA, Stannard B, Roberts CT, Jr, LeRoith D. Structural and functional analysis of the insulin-like growth factor I receptor gene promoter. Molecular endocrinology. 1992; 6:1545-1558.
15. Schayek H, Bentov I, Rotem I, Pasmanik-Chor M, Ginsberg D, Plymate SR, Werner H. Transcription factor E2F1 is a potent transactivator of the insulin-like growth factor-I receptor gene. Growth hormone and IGF research. 2010; 20:68-72.
16. Rubinstein M, Idelman G, Plymate SR, Narla G, Friedman SL, Werner H. Transcriptional activation of the IGF-I receptor gene by the Kruppel-like factor-6 (KLF6) tumor suppressor protein: potential interactions between KLF6 and p53. Endocrinology. 2004; 145:3769-3777.
17. Aiello A, Pandini G, Sarfstein R, Werner H, Manfioletti G, Vigneri R, Belfiore A. HMGA1 protein is a positive regulator of the insulin-like growth factor-I receptor gene. European journal of cancer. 2010; 46:1919-1926.
18. Schayek H, Seti H, Greenberg NM, Werner H, Plymate SR. Differential regulation of IGF1-R gene transcription by wild type and mutant androgen receptor in prostate cancer cells. Molecular and cellular endocrinology. 2010; 323:239-245.
19. Werner H, Karnieli E, Rauscher FJ, III, LeRoith D. Wild type and mutant p53 differentially regulate transcription of the insulin-like growth factor I receptor gene. Proceedings of the national academy of sciences USA. 1996; 93:8318-8323.
20. Nahor I, Abramovitch S, Engeland K, Werner H. The p53-family members p63 and p73 inhibit insulin-like growth factor-I receptor gene expression in colon cancer cells. Growth hormone and IGF research. 2005; 15:388-396.
21. Maor SB, Abramovitch S, Erdos MR, Brody LC, Werner H. BRCA1 suppresses insulin-like growth factor-I receptor promoter activity: potential interaction between BRCA1 and Sp1. Molecular genetics and metabolism. 2000; 69:130-136.
22. Abramovitch S, Glaser T, Ouchi T, Werner H. BRCA1-Sp1 interactions in transcriptional regulation of the IGF-IR gene. FEBS Letters. 2003; 541:149-154.
23. Abramovitch S, Werner H. Functional and physical interactions between BRCA1 and p53 in transcriptional regulation of the IGF-IR gene. Hormone and metabolic research. 2003; 35:758-762.
24. Werner H, Rauscher FJ, III, Sukhatme VP, Drummond IA, Roberts CT, Jr, LeRoith D. Transcriptional repression of the insulin-like growth factor I receptor (IGF-I-R) gene by the tumor suppressor WT1 involves binding to sequences both upstream and downstream of the IGF-I-R gene transcription start site. The Journal of biological chemistry. 1994; 269:12577-12582.
25. Werner H, Shen-Orr Z, Rauscher FJ, III, Morris JF, Roberts CT, Jr, LeRoith D. Inhibition of cellular proliferation by the Wilms’ tumor suppressor WT1 is associated with suppression of insulin-like growth factor I receptor gene expression. Molecular and cellular biology. 1995; 15:3516-3522.
26. Idelman G, Glaser T, Roberts CT, Jr, Werner H. WT1-p53 interactions in IGF-I receptor gene regulation. The Journal of biological chemistry. 2003; 278:3474-3482.
27. Yuen JSP, Cockman ME, Sullivan M, Protheroe A, Turner GDH, Roberts IS, Pugh CW, Werner H, Macaulay VM. The VHL tumor suppressor inhibits expression of the IGF1R and its loss induces IGF1R upregulation in human clear cell renal carcinoma. Oncogene. 2007; 26:6499-6508.
28. Rabbitts TH, Stocks MR. Chromosomal translocation products engender new intracellular therapeutic technologies. Nature medicine. 2003; 9:383-386.
29. Rowley JD. Chromosomal translocations: revisited yet again. Blood. 2008; 112:2183-2189.
30. Tomlins SA, Rhodes DR, Perner S, Dhanasekaran SM, Mehra R, Sun X-W, Varambally S, Cao X, Tchinda J, Kuefer R, Lee C, Montie JE, Shah RB, Pienta KJ, Rubin MA, Chinnaiyan AM. Recurrent fusion of TMPRSS2 and ETS transcription factor genes in prostate cancer. Science. 2005; 310:644-648.
31. Paoloni-Giacobino A, Chen H, Peitsch MC, Rossier C, Antonarakis SE. Cloning of the TMPRSS2 gene, which encodes a novel serine protease with transmembrane, LDLRA, and SRCR domains and maps to 21q22.3. Genomics. 1997; 44:309-320.
32. Carrere S, Verger A, Flourens A, Stehelin D, Duterque-Coquillaud M. Erg proteins, transcription factors of the Ets family, form homo, heterodimers and ternary complexes via two distinct domains. Oncogene. 1998; 16:3261-3268.
33. Martins AS, Ordóñez JL, Amaral AT, Prins F, Floris G, Debiec-Rychter M, Hogendoorn PC, de Alava E. IGF1R signaling in Ewing sarcoma is shaped by clathrin-/caveolin-dependent endocytosis. PLoS one. 2011; 6:e19846.
34. Mancarella C, Casanova-Salas I, Calatrava A, Ventura S, Garofalo C, Rubio-Briones J, Magistroni V, Manara MC, López-Guerrero JA, Scotlandi K. ERG deregulation induces IGF-1R expression in prostate cancer cells and affects sensitivity to anti-IGF-1R agents. Oncotarget. 2015; 6:16611-16622. doi:10.18632/oncotarget.3425.
35. Reizner N, Maor S, Sarfstein R, Abramovitch S, Welshons WV, Curran E, Lee AV, Werner H. The WT1 Wilms’ tumor suppressor gene product interacts with estrogen receptor-alpha and regulates IGF-I receptor gene transcription in breast cancer cells. The Journal of molecular endocrinology. 2005; 35:135-144.
36. Maor S, Mayer D, Yarden RI, Lee AV, Sarfstein R, Werner H, Papa MZ. Estrogen receptor regulates insulin-like growth factor-I receptor gene expression in breast tumor cells: involvement of transcription factor Sp1. The Journal of endocrinology. 2006; 191:605-612.
37. Huo H, Guo X, Hong S, Jiang M, Liu X, Liao K. Lipid rafts/caveolae are essential for insulin-like growth factor-1 receptor signaling during 3T3-L1 preadipocyte differentiation induction. The Journal of biological chemistry. 2003. 278:11561-11569.
38. Delattre O. The Ewing family of tumors: a subgroup of small-round-cell tumors defined by specific chimeric transcripts. The New England journal of medicine. 1994; 331:294-299.
39. Ladanyi M. EWS-FLI1 and Ewing’s sarcoma: recent molecular data and new insights. Cancer biology and therapy. 2002; 1:330-336.
40. Zucman J, Melot T, Desmaze C, Ghysdael J, Plougastel B, Peter M, Zucker JM, Triche TJ, Sheer D, Turc-Carel C. Combinatorial generation of variable fusion proteins in the Ewing family of tumours. The EMBO journal. 1993; 12:4481-4487.
41. Finkeltov I, Kuhn S, Glaser T, Idelman G, Wright JJ, Roberts CT, Jr, Werner H. Transcriptional regulation of IGF-I receptor gene expression by novel isoforms of the EWS-WT1 fusion protein. Oncogene. 2002; 21:1890-1898.
42. Ayalon D, Glaser T, Werner H. Transcriptional regulation of IGF-I receptor gene expression by the PAX3-FKHR oncoprotein. Growth hormone and IGF research. 2001; 11:289-297.
43. Werner H. Tumor suppressors govern insulin-like growth factor signaling pathways: implications in metabolism and cancer. Oncogene. 2012; 31:2703-2714.
44. Werner H, Bruchim I. IGF-1 and BRCA1 signalling pathways in familial cancer. Lancet oncology. 2012; 13:e537-544.
45. Bae VL, Jackson-Cook CK, Maygarden SJ, Plymate SR, Chen J, Ware JL. Metastatic sublines of an SV40 large T antigen immortalized human prostate epithelial cell line. The prostate. 1998; 34:275-282.
46. Magistroni V, Mologni L, Sanselicio S, Reid JF, Redaelli S, Piazza R, Viltadi M, Bovo G, Strada G, Grasso M, Gariboldi M, Gambacorti-Passerini C. ERG deregulation induces PIM1 over-expression and aneuploidy in prostate epithelial cells. PLoS ONE. 2011; 6: e28162.
47. Rappsilber J, Ishihama Y, Mann M. Stop and go extraction tips for matrix-assisted laser desorption/ionization, nanoelectrospray, and LC/MS sample pretreatment in proteomics. Analytical chemistry. 2003; 75:663-670.
48. Cox J, Mann M. MaxQuant enables high peptide identification rates, individualized p.p.b.-range mass accuracies and proteome-wide protein quantification. Nature biotechnology. 2008; 26:1367-1372.
49. Cox J, Neuhauser N, Michalski A, Scheltema RA, Olsen JV, Mann M. Andromeda: a peptide search engine integrated into the MaxQuant environment. The Journal of proteome research. 2011; 10:1794-1805.