
INTRODUCTION
The discovery of cancer stem cells (CSCs) is a landmark in cancer research that has broad potential applications for targeted tumor therapy [1, 2]. CSCs are a small subgroup of cells residing in a heterogeneous population of tumor cells. CSCs, which usually comprise <1% of all cells in a given tumor, are thought to drive tumor progression, invasion, migration, metastasis, and drug-resistance [3, 4]. Cancer stem cells have been isolated from many kinds of malignant tumors, including leukemia [5], breast cancer [6], colon cancer [7], hepatoma [8], melanoma [9], lung cancer [10], prostate cancer [11], pancreatic cancer [12], and ovarian cancer [13]. Conventional cancer therapies may eliminate most of the tumor mass, but a small population of CSCs with the potential to repopulate the tumor may escape destruction and survive the therapy [14, 15]. Since successful eradication of a malignancy may require the elimination of the CSCs, it would be ideal to find a therapy that can specifically target and kill CSCs.
The growth hormone/insulin-growth factor (IGF) axis plays an important role in regulating self-renewal of cancer stem cells [16, 17]. The IGF pathway is frequently activated in a variety of cancers [18–20]. By stimulating the PI3-K and MAPK cascade pathways, IGF-I and IGF-II promote cell proliferation and induce resistance to chemotherapeutic agents, radiation, and targeted therapies [21, 22]. IGF2 is maternally imprinted in most normal tissues, with only the paternal allele being expressed. In many tumors, however, this imprinting is lost, leading to biallelic expression of the gene [23–25]. Over-production of the growth factor promotes the malignant behavior of tumor cells through enhanced cell growth and CSC self-renewal [26], and loss of IGF2 imprinting (LOI) is associated with tumor initiation [27, 28]. Moreover, IGF2-overexpressing tumors frequently display loss of PTEN, and they are often highly proliferative, exhibiting strong staining for phospho-Akt [28, 29].
In order to study the role of IGF2 in the maintenance of CSC characteristics, we isolated CSCs from six cancer cell lines and examined the allelic expression and epigenetic regulation of IGF2.
RESULTS
Characteristics of isolated CSCs
CSCs play an important role in tumor initiation, metastasis, and chemo/radiotherapy resistance [30]. To study the epigenetic mechanisms underlying CSC self-renewal, we isolated CSCs and non-CSCs from six solid tumor cell lines by flow cytometry analysis using an R-PE conjugated monoclonal antibody against CD133. The CD133-negative cells were collected and cultured in RPMI 1640 supplemented with 10% FBS. They maintained the same cell morphology as the parental cells (Figure 1A) and were subgrouped as “non-CSCs”. The CD133-positive cells were collected and cultured under stem cell suspension culture conditions to produce sphere-forming-like cells from single-dissociated cancer cells. Clusters of sphere-forming cells were successfully generated after 5-10 days of culture and were subgrouped as CSCs.
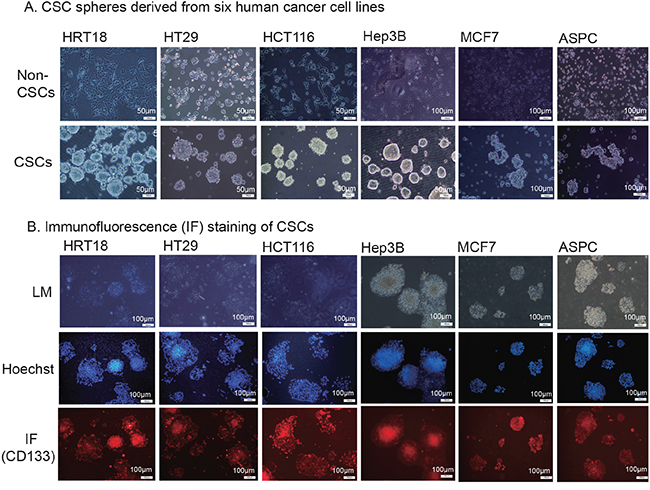
Figure 1: Isolation of cancer stem cells (CSCs). A. CSC spheres derived from six human cancer cell lines. Tumor cells were sorted by FACS to separate the CD133− and CD133+ subpopulations. The CD133− cells were cultured in RPMI 1640 or DMDM and were classified as the non-cancer stem cells (non-CSCs). The CD133+ cells were cultured in nonadhesive plates in cancer sphere medium (DMEM-F12 supplemented with 20 ng/ml bFGF, 20 ng/mL EGF, and 20 μl/ml B27). B. Immunofluorescence (IF) staining of CSCs. The sphere cells were treated with 4% paraformaldehyde, incubated with anti-CD133 antibody, and followed by the secondary antibody conjugated to fluorescent phycobiliproteins. Hoechst 33258 was used for nuclear counterstaining.
Self-renewal capacity is an essential feature of stem cells. We found that the enzymatically-dissociated sphere-forming-like cells maintained their spheroid morphology during serial passaging. The morphology of sphere-forming-like cells after 5 passages maintained the same characteristics as that of the first passage. Using immunofluorescence, we found that CSC marker CD133 continued to be expressed on the cell surface of HRT18, HT29, HCT116, Hep3B, MCF7 and ASPC CSCs (Figure 1B, bottom panel). More than 90% of the spheroid cells stained positive for CD133 (Supplementary Figure S1). The isolated CSCs also stained positive for the CSC marker, aldehyde dehydrogenase (ALDH, Supplementary Figure S2).
Loss of IGF2 imprinting in CSCs
Among the six cancer cell lines, four were heterozygous (HRT18, HT29, HCT116, and ASPC) and thus informative for a SNP (C/T) located in IGF2 exon 9 which can be used to distinguish the two parental alleles (Figure 2A). HRT18 and HT29 cell lines exhibited loss of IGF2 imprinting (LOI), while HCT116 and ASPC maintained normal IGF2 imprinting (MOI) [31–33]. We were particularly interested to determine if IGF2 was differentially imprinted in CSCs as compared to non-CSCs (Figure 2B).
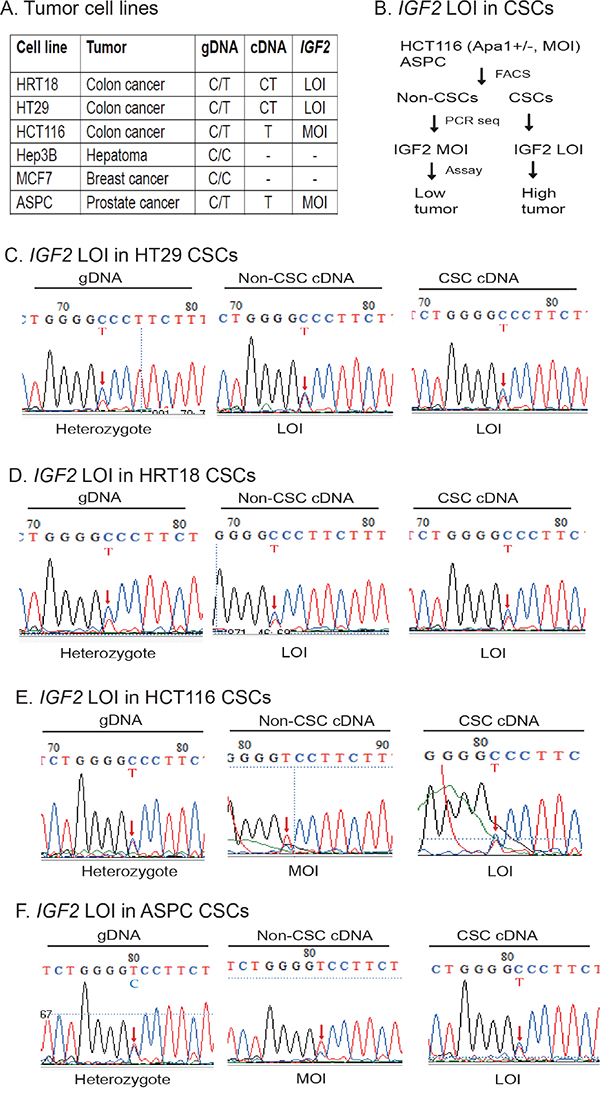
Figure 2: Differential loss of IGF2 imprinting in CSCs. A. Imprinting status in cancer cell lines. Using ApaI restriction enzyme typing and DNA sequencing of genomic DNA (gDNA), six human cancer cell lines were divided into informative (heterozygous C/T) and non-informative (homozygous C/C). By examining the expression of cDNA, HRT18 and HT29 were shown to demonstrate loss of IGF2 imprinting (LOI). In contrast, HCT116 and ASPC were grouped as maintenance of IGF2 imprinting (MOI). Hep3B and MCF7 were homozygous for the SNP and could not be used for imprinting analysis. gDNA: genomic DNA; cDNA: complementary DNA from reverse transcription. B. Differential IGF2 imprinting between CSCs and non-CSCs. Two MOI tumor cells (HCT116 and ASPC) were separated into CSCs and non-CSCs. IGF2 imprinting was examined by cDNA PCR sequencing. Restriction enzyme ApaI was used to genotype the IGF2 alleles. C. Loss of IGF2 imprinting in HT29 CSCs. Sequencing of genomic DNA shows the C/T heterozygosity. Red arrow: the site of the ApaI polymorphism. Note the biallelic expression of IGF2 mRNA (LOI) in both non-CSCs and CSCs. D. Loss of IGF2 imprinting in HRT18 CSCs. Both the non-CSCs and CSCs show loss of IGF2 imprinting (LOI). E. Differential IGF2 imprinting in HCT116 CSCs. In non-CSCs, only the T allele was detected, showing a typical imprinting pattern. In CSCs, however, both parental alleles were expressed (LOI). F. Differential IGF2 imprinting in ASPC CSCs. Note the monoallelic expression of IGF2 in non-CSCs, but the biallelic expression (LOI) in CSCs.
HT29 colon cancer cells were informative for the SNP, showing the presence of the “C” and “T” alleles in the genomic DNA (gDNA) (Figure 2C, left panel). As we previously reported [31–33], both the “C” and “T” alleles of IGF2 mRNA transcripts are present in non-CSCs (middle panel), indicating loss of imprinting in this cancer cell line. In the CSCs derived from this cell line, IGF2 was also biallelically expressed (right panel). Similarly, loss of IGF2 imprinting was also detected in HRT18 non-CSCs and CSCs (Figure 2D).
On the other hand, we observed differential IGF2 imprinting in HCT166 CSCs. In these cells, only the “T” allele was detected in the Non-CSC cells (Figure 2E, middle panel), indicating normal IGF2 imprinting as previously reported [31–33]. However, in CSCs isolated from this cell line, we detected loss of IGF2 imprinting, with both the C and the T alleles expressed (Figure 2E, right panel). These data demonstrate that IGF2 imprinting can be differentially maintained between the non-CSC and CSC subpopulations in the same cell line.
ASPC is a pancreatic cancer cell line that was previously shown to maintain IGF2 imprinting [31–33]. As expected, we found that IGF2 was monoallelically expressed in non-CSCs (Figure 2F, middle panel). In CSCs, however, IGF2 was biallelically expressed (right panel), suggesting that loss of IGF2 imprinting is characteristic of CSCs in general, present even when stem cells were derived from a cell line that maintains IGF2 imprinting.
Chromosome conformation capture (3C)
Since maintenance of normal monoallelic expression of IGF2 requires the presence of a CTCF-mediated long range intrachromosomal loop structure between the promoter and the imprinting control region (ICR), we then examined if there was a disruption of this intrachromosomal looping in the isolated CSCs.
We used the chromatin conformation capture technique (3C) [35] to detect intrachromosomal looping. Cells were fixed with 1% formaldehyde, digested with restriction enzyme EcoRI, and then ligated with T4 DNA ligase. Using this approach, the interacting chromatin complex DNAs are ligated and detected by PCR using the 3C primer sets located in the IGF2 promoters (SJ38, SJ40, SJ42) and the ICR (SJ44, SJ46) (Figure 3A).
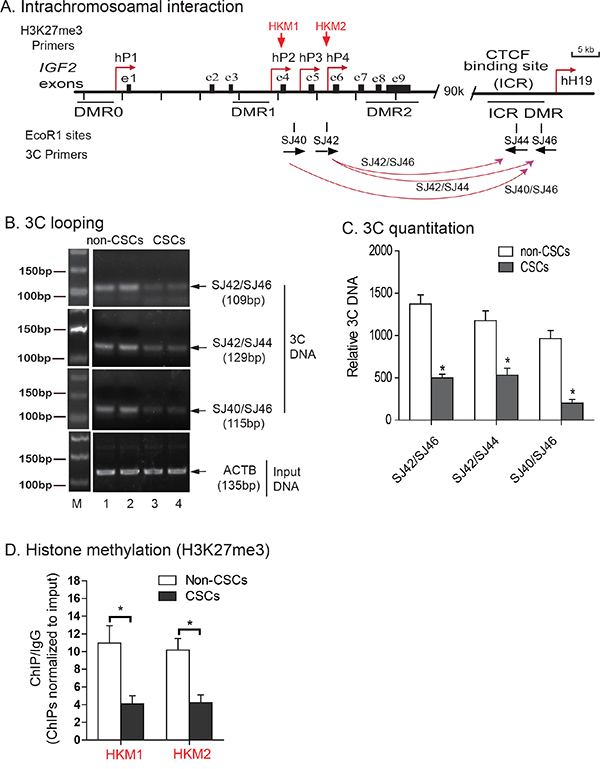
Figure 3: Abnormal intrachromosomal interactions between the ICR and IGF2 promoters in CSCs. A. Schematic diagram of IGF2 intrachromosomal interactions. 3C primers: PCR primers used to detect intrachromosomal interactions; DMRs: Differentially methylated regions; P1-P4: human IGF2 promoters; ICR: imprinting control region. The orientation and location of the 3C primers are shown by arrows under each EcoR1 site. B. The intrachromosomal interaction between the IGF2 promoter and the CTCF-binding site in the ICR of HCT116 cells. M: 100 bp marker. The intrachromosomal interaction products were detected by 3C assay using primers in CTCF site combined with primers in IGF2 promoters. Input DNA was used as the 3C control. Note the reduced 3C signals in CSCs. C. Quantitation of intrachromosomal interaction 3C products by quantitative PCR. All data shown are mean±SD from three independent. *p<0.01 as compared with non-CSCs. D. Histone methylation in the IGF2 promoter. Levels of histone modifications in the IGF2 promoter were measured by ChIP assay using antibodies specific for H3K27me3 in HCT116 non-CSCs and HCT116 CSCs. Normal rabbit IgG was used as a negative control. Precipitated DNA was subjected to qPCR. Bar graphs represent the ratio of precipitated DNA signals to IgG after normalization over the input. Error bars represent the standard error of the mean of three independent experiments. * p<0.05 between HCT116, non-CSCs and HCT116 CSCs.
In the HCT116 non-CSCs that maintain normal IGF2 imprinting, we detected three intrachromosomal interaction products: SJ42/SJ46 (109 bp), SJ42/SJ44 (129 bp), and SJ40/SJ46 (115 bp)(Figure 3B, lanes 1-2). In CSCs, however, only a weak intrachromosomal interaction signal was detected at all these three sites (lanes 3-4) in parallel with loss of IGF2 imprinting. Quantitation of 3C products also showed a significantly lower intrachromosomal interaction signal in CSCs than that seen in non-CSCs (Figure 3C, p<0.01). These data suggest that the loss of this intrachromosomal interaction is associated with IGF2 LOI [32, 33].
We then focused on IGF2 promoter suppression by histone H3K27 methylation to determine whether this epigenetic suppressive mark was altered in CSCs in an association with loss of imprinting. Using chromatin immunoprecipitation (ChIP), we examined H3K27 methylation in the IGF2 promoters. We observed a significant decrease in IGF2 promoter H3K27 methylation in HCT116 CSCs as compared with the non-CSCs (Figure 3D), suggesting that H3K27 methylation is needed for IGF2 imprinting.
Upregulation of IGF2 in CSCs
Loss of imprinting can be associated with overexpression of the gene [36]. IGF2 was significantly upregulated in HCT116 and ASPC CSCs, where there was loss of IGF2 imprinting, compared to their non-CSC counterparts that maintain IGF2 imprinting (Figure 4A). Increased IGF2 expression was also observed in CSCs derived from HRT18 and HT29, in which there is IGF2 LOI, as well as from Hep3B and MCF7 cell lines, which are homozygous at the SNP and are thus of unknown imprinting status. Using Western blotting, we also confirmed that IGF2 was significantly upregulated in CSCs as compared with their non-CSC counterparts (Figure 4B, p<0.01).
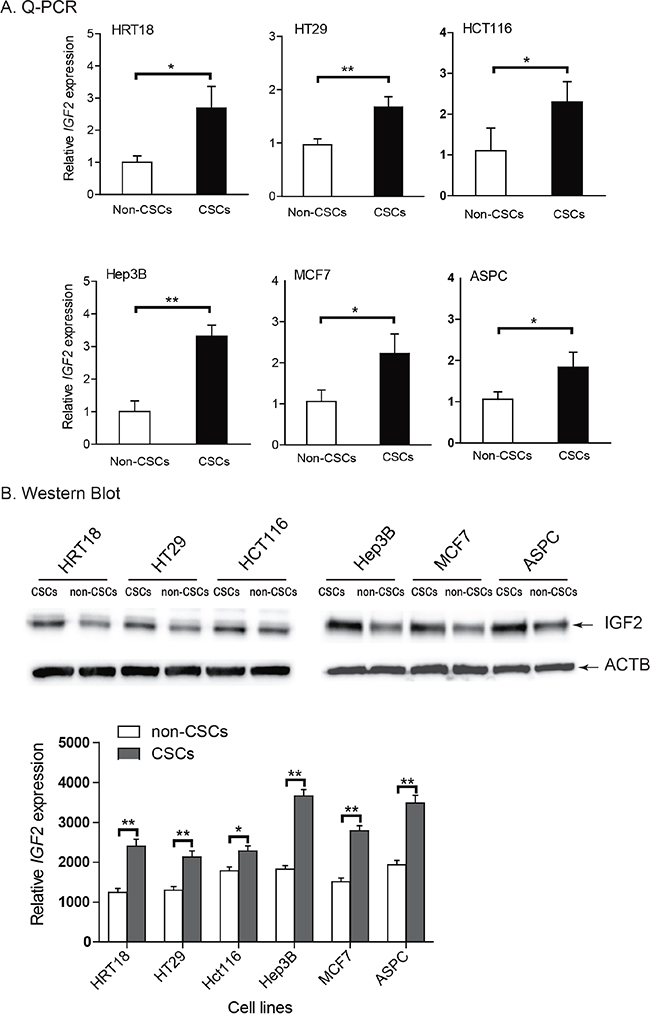
Figure 4: Upregulation of IGF2 in CSCs. A. Differential expression of IGF2 between the non-CSCs and CSCs as measured by quantitative RT-PCR. Note the upregulated IGF2 in CSCs as compared with that in non-CSCs. B. IGF-II protein as quantitated by Western blot. Protein expression was measured by imaging system Quantity One. All data shown are mean±SD from three independent experiments. * p<0.05, ** p<0.01 between the two groups.
Enhanced tumor clonogenic activity in CSCs
A characteristic hallmark of CSCs is the capacity for self-renewal. The growth hormone/IGF axis plays an important role in regulating self-renewal of cancer stem cells [16, 17, 37, 38]. We used a clonogenic assay to examine the ability of a single cell to form a colony from CSCs that exhibited IGF2-upregulation. After incubation in soft agar for 13 days, colonies formed from both non-CSCs and CSCs, indicating their capacity for anchorage-independent growth. Figure 5A shows a typical tumor colony derived from HCT116 non-CSCs (MOI) and CSCs (LOI), showing that the CSCs formed more colonies. Similarly, we found that CSCs with IGF2 upregulation exhibited a significantly greater ability to form colonies than did the non-CSC cells in all cell lines tested (Figure 5B, p<0.05).
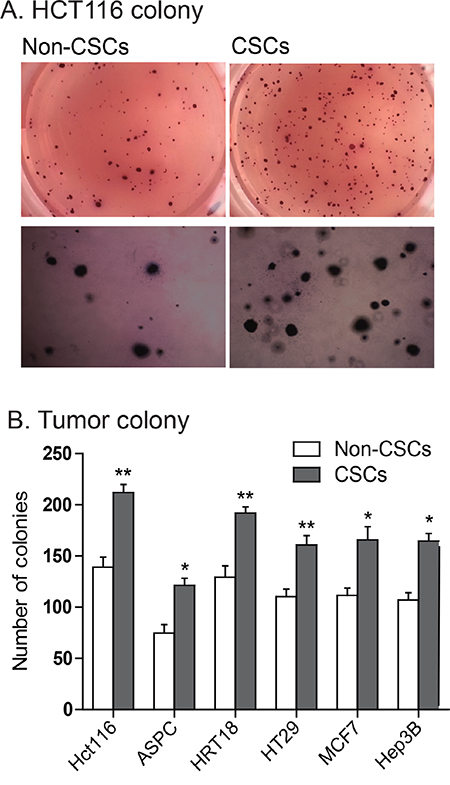
Figure 5: Enhanced ability to form tumor colonies in IGF2-upregulated CSCs. A. Representative images of colonies of HCT116 cells stained with MTT in soft agar. B. Quantitation of tumor colonies in CSCs. Colonies were counted under microscopy and the results were presented as colonies per 500 cells. *P<0.05, **P<0.01 as compared with the non-CSCs. The results are expressed as the mean±standard deviation of three independent experiments.
The IGF2-upregulated CSCs are resistant to chemo/radiotherapies.
We then compared drug-sensitivity between the IGF2 MOI non-CSCs and the IGF2 LOI CSCs. Cells were treated with 5-fluorouracil (5-FU) and oxaliplatin, respectively, for 48 hours and were then assessed for cell viability. We found that HCT116 CSCs that had IGF2 LOI were significantly more resistant to both 5-FU and oxaliplatin than were non-CSCs that exhibited normal IGF2 imprinting (Figures 6A-6B, p<0.05). Similarly, greater resistance to 5-FU and oxaliplatin was also observed in ASPC CSCs with IGF2 LOI than in the non-CSCs with IGF2 MOI (Figures 6C-6D, p<0.05).
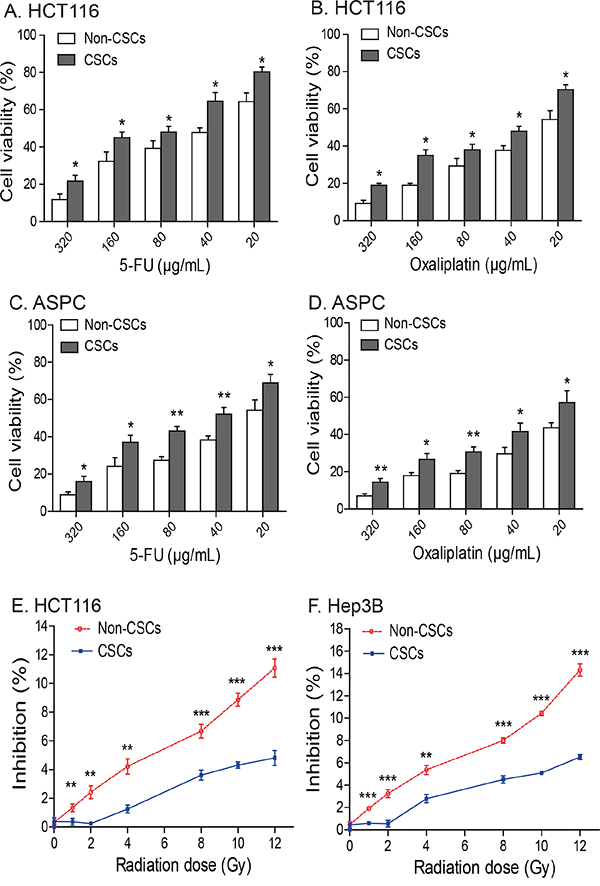
Figure 6: Chemotherapy and radiotherapy-resistance in CSCs. A-D. IGF2-upregulated CSCs isolated from HCT16 and ASPC cells are resistant to treatment with 5-FU and oxalipatin. * p<0.05, ** p<0.01 as compared to the non-CSCs. The results are expressed as the mean ± standard deviation of three independent experiments. E-F. The IGF2-upregulated CSCs from HCT116 and Hep3B cells are resistant to radiotherapy. Cells were irradiated with 1-12Gy radiation and evaluated by WST-1 cell proliferation assays. ** p<0.01, *** p<0.001 as compared to the non-CSCs.
We also examined radiotherapy-resistance in two CSCs (HCT116 and Hep3B) with upregulated IGF2 expression. In HCT116 non-CSCs that expressed IGF2 monoallelically, there was an apparent dose-dependent inhibition of cell growth for all radiation doses. In CSCs that showed biallelic expression of IGF2, however, there was a much less inhibitory effect when the cells were exposed to <4 Gy of radiation. When exposure was > 4 Gy, CSCs still exhibited greater radiation-resistance than did the non-CSCs (Figure 6E). A similar radiation-resistant pattern was also observed in Hep3B CSCs (Figure 6F).
IGF2 is critical to maintain the features of CSCs
To further examine the role of IGF2 in CSCs, we used two siRNAs (siIGF2 1# and siIGF2 2#) to knock down IGF2 in HCT116 CSCs (Figure 7A). IGF2 knockdown significantly reduced the CD133+ cell population in HCT116 CSCs (Figure 7B), suggesting that IGF2 is a critical growth factor in maintaining self-renewal of CSCs in colorectal cancer cells.
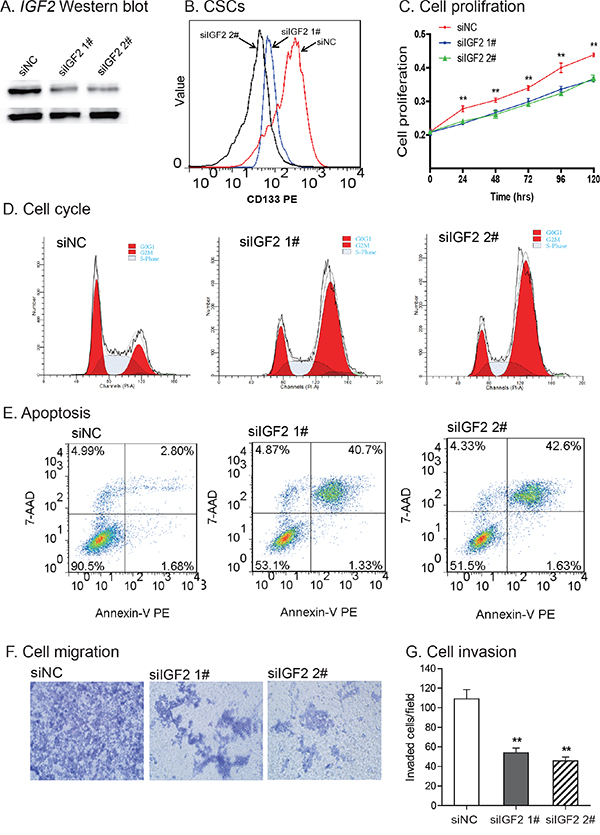
Figure 7: Knockdown of IGF2. A. Knockdown of IGF2 by siRNAs (siIGF2 1#, siIGF2 2#). siNC: negative control siRNA. The abundance of IGF-II protein was quantitated by Western blot. B. IGF2 knockdown reduced CD133-positive cells. After siRNA treatment, CD133+ cells were analyzed by FACS. C. Reduced cell proliferation in IGF2-knockdown CSCs. **P<0.01 vs. control cells (siNC). D. Cell cycle analysis after interference of IGF2 expression. After treatment with the control siRNA (siNC) and IGF2 siRNA (siIGF2 1# and siIGF2 2#), cell cycle was analyzed by FACS. E. Apoptosis as measured by FITC Annexin V-FACS assay. F. Cell migration. IGF2 knockdown reduced cell migration in HCT116 CSCs. G. Cell invasion. Cells that invaded through the collagen-coated membrane of the transwell were counted. All data shown are mean±SEM from three independent experiments. *p < 0.05 as compared with control cells (siNC).
After IGF2 knockdown, we also noticed a time-dependent inhibition of cell proliferation (Figure 7C). Using flow cytometry, we found that IGF2-knockdown induced an increased percentage of cells in G2/M-phase (23.46% in siNC vs 60.14% in siIGF2 1# and 67.08% in siIGF2 2#), in parallel with a decrease in G0/G1 phase (40.77% in siNC vs 17.73% in siIGF2 1# and 14.94% in siIGF2 2#)(Figure 7D).
Following IGF2 knockdown, there was an increase in cell apoptosis in HCT116 CSCs (2.80% in siNC vs 40.7% in siIGF2 1# and 42.6% in siIGF2 2#)(Figure 7E). In addition, IGF2-knockdown in CSCs led to a reduction in cell migration (Figure 7F), invasion (Figure 7G), and resistance to chemo/radiotherapies (Supplementary Figure S3).
DISCUSSION
IGF2 is often overexpressed in a variety of human malignancies, partially due to the loss of genomic imprinting. However, the role of IGF2 epigenetic regulation in cancer stem cells has not been elucidated. By examining allelic expression using an IGF2 exon 9 SNP, we have shown that IGF2 imprinting is lost in CSCs, including CSCs derived from two cancer cell lines in which IGF2 is monoallelically expressed. This biallelic expression pattern is associated with upregulation of IGF2 mRNA and IGF-II protein, leading to tumor growth and CSC self-renewal. CSCs exhibit significantly higher capacity to form tumor spheres than do the non-CSCs. Knockdown of IGF2 led to a reduction of CD133-positive cells and decreased tumorigenesis, suggesting a role for loss of IGF2 imprinting in the maintenance of stem cell renewal.
Specific biallelic expression of IGF2 in CSCs suggests that IGF2 imprinting can be a differential trait in a cell line with a mixed cell population. IGF2 LOI is maintained in the CSC niche during cell passaging. In previous studies, allelic expression was examined in RNA extracted from the totality of the cells, and not specifically from the very small population of cancer stem cells. Similarly, IGF2 LOI has been reported in a variety of human cancers at widely varying rates, including Wilms' tumor, colorectal cancer, hepatoma, lung cancer, ovarian cancer, bladder cancer, leiomyosarcoma, and esophagus cancer [39]. Because all of those published studies examined the status of IGF2 imprinting in whole cancer tissues or cell lines, rather than in purified CSCs, it is likely that the true incidence of IGF2 LOI, particularly in CSCs, has been greatly underestimated. It is also interesting to note that the increased IGF2 expression was also observed in HRT18 and HT29 cell lines, where both the non-CSCs and CSCs exhibit loss of IGF2 imprinting. Thus, aberrant imprinting is not the only factor that determines the abundance of IGF2. Future studies are needed to track IGF2 imprinting at a single daughter cell level and identify other pathway factors that upregulate IGF2 in CSCs.
An important characteristic of cancer stem cells and other stem cells is their asymmetrical division, resulting in two unequal daughter cells. Due to this unsymmetrical division, only one of the daughter cells resembles the parent stem cell and can maintain stemness. Currently, it is not clear if IGF2 imprinting is inherited in this unsymmetrical division.
Loss of IGF2 imprinting in peripheral blood leukocytes may provide a potential biomarker for diagnosing individuals who have a high risk of colorectal cancer [27, 40]. Tumor phenotype in Apc+/Min mice can be modified simply by altering the IGF2 epigenotype [41]. By introducing DNA hypermethylation in the gene promoter with methylated hairpin oligonucleotides, we have previously demonstrated that silencing IGF2 reduced the growth of implanted human hepatocarcinomas and prolonged lifespan in an animal model [42, 43]. Future studies are needed to examine if IGF2 is also aberrantly imprinted in CSCs isolated from clinical tumor samples.
In summary, our data demonstrate for the first time that loss of IGF2 imprinting is present in CSCs, even when the imprinting is maintained in the Non-CSC cells derived from the same population of cells. CSC IGF2 LOI may underlie the stem cell characteristics of self-renewal and resistance to chemo/radiotherapies. We have shown that we can specifically target tumor cells in which IGF2 is biallelically expressed [31, 44], and such targeting might prove to be a magic bullet to specifically kill the CSCs within a tumor.
MATERIALS AND METHODS
Cell lines and cell culture
Six cancer cell lines that exhibit distinct IGF2 imprinting patterns were purchased for this study from American Type Culture Collection (ATCC, VA): HT29 (colon cancer), HRT-18 (colon cancer), HCT-116 (colon cancer), Hep3B (liver cancer), MCF-7 (breast cancer), and ASPC (pancreatic cancer). HT29 and HRT18 were shown to have loss of IGF2 imprinting, while HCT116 and ASPC were shown to maintain normal IGF2 imprinting [32, 34]. Hep3B and MCF7 were not informative at a variety of polymorphic sites, so we were unable to identify their imprinting status.
HT29, HRT-18, HCT- 116, and ASPC cell lines were maintained in RPMI 1640. Hep-3B and MCF-7 cells were cultured in Dulbecco's modified Eagle's medium (DMEM) media (HyClone, UT). Both media were supplemented with 10% fetal bovine serum (FBS), penicillin (100 U/ml), and streptomycin (100 μg/ml). Exponentially growing cells were collected by trypsin-EDTA for imprinting analyses.
Isolation of CSCs
As previously reported [45–47], expression of the CSC marker CD133 was used to isolate CSCs. Briefly, nonspecific binding of cell membranes was blocked by incubating with 5% BSA for 30 min at room temperature. Cells were then incubated with CD133 antibody (MACS, Miltenyi Biotec, Germany) for 30 min before being subjected to flow cytometry analysis (FACSAria, BD, CA). Cells with the highest and the lowest fluorescence levels of CD133 were sorted and collected and they were designated as CD133+ cells (CSCs) and CD133− cells (non-CSCs). CSCs were expanded in CSC spheres as in the following section for analyses.
Flow cytometry analysis of CSCs
Cells were stained with the conjugated fluorescent antibody for 30 min at 4°C. Anti-CD133-PE was purchased from Miltenyi Biotec. After being washed with phosphate-buffered saline (PBS), ten thousand events per sample were acquired and the number of CD133+ cells was determined by flow cytometry.
CSC sphere culturing
To evaluate the self-renewal characteristics of the isolated CSCs, the CD133+ cells were reseeded and cultured in CSC-culturing medium consisting of serum-free DMEM-F12 (HyClone, UT), supplemented with 20 ng/mL basic fibroblast growth factor (bFGF), 20 ng/mL epidermal growth factor (EGF)(Peprotech, NJ), and 20 μl/ml B27 supplement (Invitrogen, CA) in a ultra-low attachment 6-well plate (Corning, CA) at a density of < 5000 cells/well. CD133− cells were cultured as the attached cells in RPMI 1640 or EMEM medium supplemented with 10% FBS, and they served as a control.
CSC spheres were defined as cell colonies with a diameter >200 μm and area >50% showing three-dimensional structure and blurred cell margins. Spheres began to form at day 4-5 of culturing. When the sphere-forming cells reached a diameter of >200 μm in the suspension culture, the cells were collected and dissociated with Accutase (Millipore/Upstate, CA) at 37°C for 3-5 min. After centrifugation, cells were washed with two volumes of PBS to inactivate the enzyme. Single CSCs were resuspended in CSC-culturing medium, and seeded for generation of secondary spheres. Spheres were observed under a microscope and images were photographed under a phase contrast fluorescence microscope (Nikon, ECLIPSE 80i, Japan).
After 4-5 passages, CSC spheres were collected and used for assays in this study, including IGF2 imprinting, epigenetic mechanisms, cell migration and invasion, and chemo/radiotherapies.
Immunofluorescence analysis
Cells were fixed in PBS containing 4% paraformaldehyde (NJ-reagent, Nanjing, China) for 30 min and permeabilized with phosphate-buffered saline containing 0.1% Triton X-100 (NJ-reagent) for 10 min. The samples were incubated with anti-CD133 antibody (1:100; Santa Cruz Biotechnology, Santa Cruz, CA, USA), followed by the secondary antibody conjugated to Cy3 NHS Ester goat anti-rabbit immunoglobulin (1:100; Beyotime, Shanghai, China).
The isolated CSCs was also stained with anti-ALDH antibody (1:100; Becton, Dickinson and Company, NJ, USA), followed by the secondary antibody conjugated to Alexa-Fluor 488-conjugated goat anti-rabbit IgG (1:200; Beyotime, Shanghai, China). Hoechst 33258 (Beyotime, Shanghai, China) was used for nuclear counterstaining.
Allelic expression of IGF2
Tumor cell lines were first genotyped for the heterozygosity of SNPs in IGF2 exon 9 mRNA. Tumor cells that were informative for SNP sites were used for IGF2 imprinting studies (Supplementary Table S1). IGF2 transcripts were amplified by RT–PCR (40 cycles of 96°C for 20 s, 58°C for 20 s and 72°C for 20 s, followed by a 3-min extension at 72°C) using primers specific for two polymorphic restriction enzymes (ApaI, AluI) in the last exon of human IGF2 [32]. To determine the status of IGF2 imprinting, the amplified products were sequenced by MyGenostics (Beijing, China). Cells that maintain normal imprinting (MOI) express a single parental allele, while the LOI showed biallelic expression of IGF2. PCR primers used for IGF2 imprinting are listed in Supplementary Table S1.
Chromosome conformation capture (3C)
The 3C assay was performed as described previously [32, 35, 48, 49]. In brief, HCT116 cells were cross-linked with 2% formaldehyde and lysed with cell lysis buffer (10 mM Tris, pH 8.0, 10 mM NaCl, 0.2% NP-40, and protease inhibitors). Nuclei were suspended in 1×restriction enzyme buffer in the presence of 0.3% SDS, and incubated at 37°C for 1 h. Triton X-100 was then added to a final concentration of 1.8% to sequester the SDS. An aliquot of nuclei (2×10⁶) was digested with 800 U of restriction enzyme EcoRI at 37°C overnight. After stopping the reaction by adding 1.6% SDS and incubating the mixture at 65°C for 20 min, chromatin DNA was diluted with ligation reaction buffer, and 2 μg DNA was ligated with 4,000 U T4 DNA ligase (New England Biolabs, MA) at 16°C for 4 h (final DNA concentration of 2.5 μg/ml). After treatment with 10 mg/ml proteinase K at 65°C overnight to reverse cross-links and with 0.4μg/ml RNase A for 30 min at 37°C, DNA was extracted with phenol-chloroform and ethanol precipitated. The ligated DNA products were detected by PCR amplification and quantitative PCR. PCR primers used for 3C assay are listed in Supplementary Table S1.
Histone methylation by chromatin immunoprecipitation (ChIP) assay
ChIP assay was used to quantitate the status of histone modification in the isolated CSCs, following the manufacturer’s protocol (Upstate Biotechnology, Lake Placid, NY). Specific anti-trimethyl-histone H3 (Lys27) antibody (Merck Millipore, Darmstadt, Germany) was used to determine histone methylation and the normal isotype-matched IgG from the same species was used as negative control. Precipitated DNA was subjected to qPCR. ChIP PCR data are expressed as fold enrichment versus IgG chromatin input using comparative ΔΔCt analysis [32, 33].
Soft-agar clonogenic assay
The clonogenic assay was performed using the method previously reported [50, 51] to examine the tumorigenicity of the cultured CSCs. Briefly, 0.5% and 0.25% soft agarose (Sigma, MO) were prepared with sterile H2O and stored at 4°C. DMEM culture medium containing 10% FBS was kept in a 37°C water bath. 60μl of 0.5% agarose and 540μl DMEM were mixed and layered onto 24-well plates as the base agar. CSCs were digested, centrifuged and resuspended in DMEM medium to form a single cell suspension. The top agar cell suspension (2×10³ cells/ml) was prepared by mixing cells with 0.25 ml DMEM and 0.25 ml 0.5% agarose, and then adding this onto the base agar. The plates were incubated at 37°C, 5% CO2 until visible colonies (N>50/group) were observed. After ~2 weeks, colonies were visualized by staining with 5 mg/ml MTT for 3 hr. Cloning forming efficiency (CFE) was calculated by the number of colony formations/the number of inoculated cells×100%.
Chemotherapy sensitivity assays
The chemo-resistance of tumor sphere cells was assessed using WST-1 cell proliferation assays as previously reported [52]. Briefly, 1.25×10⁴ cells per well were seeded in 96-well plates in 200 μl culture medium (three wells per group). After 24 hr culture, cells were treated with various concentrations (0, 20, 40, 80, 160, 320 μg/ml) of 5-FU and oxaliplatin, respectively, for another 48 hrs. Cell proliferation was evaluated by adding 20 μl WST-1 reagent to each well. The reaction proceeded for 3 h at 37°C with 5% CO2. The absorbance of the samples at 450 nm was measured using a microplate reader. The effects of 5-FU and oxaliplatin on the viability of tumor sphere cells were expressed as the cell viability (%) = A450 of treated cells/A450 of control cells×100%. Three independent experiments were performed.
Radiotherapy resistance assay
Tumor sphere cells were dissociated by trypsinization and were seeded at 2.5×10⁴ cells per well in 200μL medium in 96-well plates. The cells were exposed to various doses of radiation using an X-ray machine at room temperature. The sham-irradiated (control) cells were treated similarly but were not irradiated. Cells were irradiated by a Philips deep X-ray machine with 200 kVp, 10 mA and filters of 0.5 mm copper plus 1.0 mm aluminum. The dose rate was 1Gy/min X rays. Radiation doses were 1, 2, 4, 8, 10, and 12Gy. Immediately after irradiation or sham irradiation, cells were returned to the same culturing conditions.
DNA extraction
Genomic DNA from cultured cells was extracted using the Cell/tissue genome DNA Extraction Kit (Generay Biotechnology, China) according to the manufacturer's protocol. DNA was dissolved in a final volume of 80 μL of buffer and quantified using a NanoVue spectrophotometer (GE, USA).
Reverse transcription
Total RNA was extracted from the tumor cells using Trizol reagent (Invitrogen, CA). To eliminate residual genomic DNA, total RNAs (or total nucleic acids) were treated with DNase I (2 units/1mg of RNA)(Takara, Japan) for 50 min. Reverse transcription (RT) was performed with a cDNA Reverse Transcription Kit (Invitrogen).
Quantitative real-time PCR (Q-PCR) was performed using Faststart Universal SYBR Green Master (Roche). The Q-PCR assays were run in triplicate on 96-well plates using the ABI Prism 7900HT sequence detector, following the ABI protocol. Thermal cycling was performed by an initial denaturing step at 95°C for 10 min followed by 40cycles of denaturation at 95°C for 10 sec, 60°C for 45 sec forannealing and data collection. At the end of the Q-PCR, a melting curve analysis was used to confirm the homogeneity of all Q-PCR products. Relative transcript levels of each gene were calculated using the delta-delta Ct method, using a housekeeping gene (ACTB) as the reference gene. PCR primers used for ACTB and IGF2 gene expression and are listed in Supplementary Table S1.
Western blotting
Cells were lysed with immunoprecipitation assay buffer (1% Nonidet P-40, 50 mM Tris-HCl, pH 7.4, 150 mM NaCl, 1% sodium deoxycholate, 0.1% SDS, plus protease inhibitor cocktail and 1 mM phenylmethylsulfonyl fluoride). Proteins were separated by SDS-PAGE and analyzed by Western blotting. Antibodies to IGF-II and ACTB were obtained from Santa Cruz Biotechnology (Santa Cruz Biotechnology, CA, USA). IGF-II protein expression of was measured by imaging system Quantity One.
Knockdown of IGF2 by RNA interference
IGF2-specific siRNAs were purchased from Life Technologies Corporation (CA, USA). siIGF2 1#: sence:5′-GAGGAGUGCUGUUUCCGCAtt-3′, antisense: 5′- UGC GGAAACAGCACUCCUCaa-3′; siIGF2#2: 5′-ACAACCCUCUUAAAACUAAtt-3′, antisense: 5′-UUAGUUUUAAGAGGGUUGUtg-3′. The control siRNA (siNC) against photinus pyralis luciferase gene (Invitrogen, CA, USA) was 5′-GGAUUUC GAGUCGUCUUAAUGUAUA-3′. RNAiMAX transfection reagent was used for transient transfection following manufacturer’s protocol (Invitrogen, CA, USA).
Cell migration and invasion assay
Cell migration and invasion assays were carried out using Transwell membrane filters inserted in 24-well tissue culture plates (6.5-mm diameter, 8-μm pore size)(Corning, MA) as previously described [52]. For the migration assay, 4 × 10⁴ cells suspended in serum-free medium were seeded on the top chamber of transwell filters. Serum containing medium was added to the bottom chamber and incubated for 16 h at 37°C. The non-migrating cells were removed by wiping the upper side of the filter, and the migrated cells on the bottom side of the filter were fixed with 4% formaldehyde and stained with crystal purple.
A similar protocol was used for the invasion assay, except that cells were seeded in Transwell chambers coated with 0.5μg/μl type I collagen (Invitrogen, CA, USA) [56]. Each assay represents the average of three independent experiment.
Cell cycle analysis by flow cytometry
The cells were washed with PBS twice, pelleted and fixed with cold 70% ethyl alcohol for at least 30 minutes. After being washed twice with cold PBS, cells were incubated with 200 μg/ml RNaseA for 30 minutes at 37 °C. The cells were stained with 100 μg/ml propidium iodide for 30 minutes at room temperature. The samples were immediately analyzed by flow cytometry. Cell cycle phase distribution was determined using Cell Quest Pro software.
Statistical analysis
All experiments were performed in triplicate, and the data are expressed as mean ± SD. The comparative CT method was applied in the quantitative real-time RT-PCR assay according to the delta-delta CT method [31, 34]. The data were analyzed with one-way analysis of variance (ANOVA), and results were considered statistically significant at P ≤ 0.05.
ACKNOWLEDGMENTS
This work was supported by California Institute of Regenerative Medicine (CIRM) grant (RT2-01942), Jilin International Collaboration Grant (20120720), the National Natural Science Foundation of China grant (81272294, 31430021) to J.F.H.; the National Natural Science Foundation of China grant (81071920, 81372835) and Jilin Science and Technique Program grant (11GG003), Development and Reform Commission Fund of Jilin Province (2014N147), Provincial Science Fund of Jilin Provincial Department of Science and Technology (20140414014GH, 20150101176), and Norman Bethune Program of Jilin University (2012202).to J.C., Natural Science Foundation for Young Scientists of Jilin Province, China (20140520035JH) to L.X.L.; “13th Five-Year” science and technology research of the Education Department of Jilin Province, China (2016-483) to Z.X.; Health and Family Planning Commission for Young Scientists of Jilin Province, China (2015Q008) to L.X.L.; and the VA Merit-Review grant to A.R.H.
CONFLICTS OF INTEREST
No potential conflicts of interest were disclosed.
REFERENCES
1. Frank NY, Schatton T, Frank MH. The therapeutic promise of the cancer stem cell concept. J Clin Invest. 2010; 120:41-50.
2. Schulenburg A, Blatt K, Cerny-Reiterer S, Sadovnik I, Herrmann H, Marian B, Grunt TW, Zielinski CC, Valent P. Cancer stem cells in basic science and in translational oncology: can we translate into clinical application? Journal of hematology & oncology. 2015; 8:16.
3. Liao WT, Ye YP, Deng YJ, Bian XW, Ding YQ. Metastatic cancer stem cells: from the concept to therapeutics. American journal of stem cells. 2014; 3:46-62.
4. Li S, Li Q. Cancer stem cells and tumor metastasis (Review). International journal of oncology. 2014; 44:1806-1812.
5. Bhatia M, Wang JC, Kapp U, Bonnet D, Dick JE. Purification of primitive human hematopoietic cells capable of repopulating immune-deficient mice. Proc Natl Acad Sci U S A. 1997; 94:5320-5325.
6. Ginestier C, Hur MH, Charafe-Jauffret E, Monville F, Dutcher J, Brown M, Jacquemier J, Viens P, Kleer CG, Liu S, Schott A, Hayes D, Birnbaum D, Wicha MS, Dontu G. ALDH1 is a marker of normal and malignant human mammary stem cells and a predictor of poor clinical outcome. Cell Stem Cell. 2007; 1:555-567.
7. O'Brien CA, Pollett A, Gallinger S, Dick JE. A human colon cancer cell capable of initiating tumour growth in immunodeficient mice. Nature. 2007; 445:106-110.
8. Zou GM. Liver cancer stem cells as an important target in liver cancer therapies. Anti-cancer agents in medicinal chemistry. 2010; 10:172-175.
9. Lai CY, Schwartz BE, Hsu MY. CD133+ melanoma subpopulations contribute to perivascular niche morphogenesis and tumorigenicity through vasculogenic mimicry. Cancer Res. 2012; 72:5111-5118.
10. Wang J, Li ZH, White J, Zhang LB. Lung cancer stem cells and implications for future therapeutics. Cell biochemistry and biophysics. 2014; 69:389-398.
11. Patrawala L, Calhoun-Davis T, Schneider-Broussard R, Tang DG. Hierarchical organization of prostate cancer cells in xenograft tumors: the CD44+alpha2beta1+ cell population is enriched in tumor-initiating cells. Cancer Res. 2007; 67:6796-6805.
12. Li C, Heidt DG, Dalerba P, Burant CF, Zhang L, Adsay V, Wicha M, Clarke MF, Simeone DM. Identification of pancreatic cancer stem cells. Cancer Res. 2007; 67:1030-1037.
13. Shah MM, Landen CN. Ovarian cancer stem cells: are they real and why are they important? Gynecologic oncology. 2014; 132:483-489.
14. Bao B, Ahmad A, Azmi AS, Ali S, Sarkar FH. Overview of cancer stem cells (CSCs) and mechanisms of their regulation: implications for cancer therapy. Current protocols in pharmacology. 2013; Chapter 14:Unit 14 25.
15. Vinogradov S, Wei X. Cancer stem cells and drug resistance: the potential of nanomedicine. Nanomedicine. 2012; 7:597-615.
16. Eliasz S, Liang S, Chen Y, De Marco MA, Machek O, Skucha S, Miele L, Bocchetta M. Notch-1 stimulates survival of lung adenocarcinoma cells during hypoxia by activating the IGF-1R pathway. Oncogene. 2010; 29:2488-2498.
17. Bodzin AS, Wei Z, Hurtt R, Gu T, Doria C. Gefitinib resistance in HCC mahlavu cells: upregulation of CD133 expression, activation of IGF-1R signaling pathway, and enhancement of IGF-1R nuclear translocation. J Cell Physiol. 2012; 227:2947-2952.
18. Jones RA, Campbell CI, Wood GA, Petrik JJ, Moorehead RA. Reversibility and recurrence of IGF-IR-induced mammary tumors. Oncogene. 2009; 28:2152-2162.
19. Seccareccia E, Brodt P. The role of the insulin-like growth factor-I receptor in malignancy: an update. Growth Horm IGF Res. 2012; 22:193-199.
20. Heidegger I, Pircher A, Klocker H, Massoner P. Targeting the insulin-like growth factor network in cancer therapy. Cancer Biol Ther. 2011; 11:701-707.
21. Chapuis N, Tamburini J, Cornillet-Lefebvre P, Gillot L, Bardet V, Willems L, Park S, Green AS, Ifrah N, Dreyfus F, Mayeux P, Lacombe C, Bouscary D. Autocrine IGF-1/IGF-1R signaling is responsible for constitutive PI3K/Akt activation in acute myeloid leukemia: therapeutic value of neutralizing anti-IGF-1R antibody. Haematologica. 2010; 95:415-423.
22. Xu Q, Simpson SE, Scialla TJ, Bagg A, Carroll M. Survival of acute myeloid leukemia cells requires PI3 kinase activation. Blood. 2003; 102:972-980.
23. Ogawa O, Eccles MR, Szeto J, McNoe LA, Yun K, Maw MA, Smith PJ, Reeve AE. Relaxation of insulin-like growth factor II gene imprinting implicated in Wilms' tumour. Nature. 1993; 362:749-751.
24. Ohlsson R, Nystrom A, Pfeifer OS, Tohonen V, Hedborg F, Schofield P, Flam F, Ekstrom TJ. IGF2 is parentally imprinted during human embryogenesis and in the Beckwith-Wiedemann syndrome. Nat Genet. 1993; 4:94-97.
25. Rainier S, Johnson LA, Dobry CJ, Ping AJ, Grundy PE, Feinberg AP. Relaxation of imprinted genes in human cancer. Nature. 1993; 362:747-749.
26. Hofmann WK, Takeuchi S, Frantzen MA, Hoelzer D, Koeffler HP. Loss of genomic imprinting of insulin-like growth factor 2 is strongly associated with cellular proliferation in normal hematopoietic cells. Exp Hematol. 2002; 30:318-323.
27. Cui H, Cruz-Correa M, Giardiello FM, Hutcheon DF, Kafonek DR, Brandenburg S, Wu Y, He X, Powe NR, Feinberg AP. Loss of IGF2 imprinting: a potential marker of colorectal cancer risk. Science. 2003; 299:1753-1755.
28. Church DN, Phillips BR, Stuckey DJ, Barnes DJ, Buffa FM, Manek S, Clarke K, Harris AL, Carter EJ, Hassan AB. Igf2 ligand dependency of Pten(+/-) developmental and tumour phenotypes in the mouse. Oncogene. 2012; 31:3635-3646.
29. Soroceanu L, Kharbanda S, Chen R, Soriano RH, Aldape K, Misra A, Zha J, Forrest WF, Nigro JM, Modrusan Z, Feuerstein BG, Phillips HS. Identification of IGF2 signaling through phosphoinositide-3-kinase regulatory subunit 3 as a growth-promoting axis in glioblastoma. Proc Natl Acad Sci U S A. 2007; 104:3466-3471.
30. Visvader JE, Lindeman GJ. Cancer stem cells in solid tumours: accumulating evidence and unresolved questions. Nat Rev Cancer. 2008; 8:755-768.
31. Chen HL, Li T, Qiu XW, Wu J, Ling JQ, Sun ZH, Wang W, Chen W, Hou A, Vu TH, Hoffman AR, Hu JF. Correction of aberrant imprinting of IGF2 in human tumors by nuclear transfer-induced epigenetic reprogramming. EMBO J. 2006; 25:5329-5338.
32. Li T, Chen H, Li W, Cui J, Wang G, Hu X, Hoffman AR, Hu J. Promoter histone H3K27 methylation in the control of IGF2 imprinting in human tumor cell lines. Hum Mol Genet. 2014; 23:117-128.
33. Vu TH, Nguyen AH, Hoffman AR. Loss of IGF2 imprinting is associated with abrogation of long-range intrachromosomal interactions in human cancer cells. Hum Mol Genet. 2010; 19:901-919.
34. Li T, Hu JF, Qiu X, Ling J, Chen H, Wang S, Hou A, Vu TH, Hoffman AR. CTCF regulates allelic expression of Igf2 by orchestrating a promoter-polycomb repressive complex-2 intrachromosomal loop. Mol Cell Biol. 2008; 28:6473-6482.
35. Dekker J, Rippe K, Dekker M, Kleckner N. Capturing chromosome conformation. Science. 2002; 295:1306-1311.
36. Feinberg AP, Tycko B. The history of cancer epigenetics. Nat Rev Cancer. 2004; 4:143-153.
37. Xu C, Xie D, Yu SC, Yang XJ, He LR, Yang J, Ping YF, Wang B, Yang L, Xu SL, Cui W, Wang QL, Fu WJ, Liu Q, Qian C, Cui YH, et al. beta-Catenin/POU5F1/SOX2 transcription factor complex mediates IGF-I receptor signaling and predicts poor prognosis in lung adenocarcinoma. Cancer Res. 2013; 73:3181-3189.
38. Osuka S, Sampetrean O, Shimizu T, Saga I, Onishi N, Sugihara E, Okubo J, Fujita S, Takano S, Matsumura A, Saya H. IGF1 receptor signaling regulates adaptive radioprotection in glioma stem cells. Stem Cells. 2013; 31:627-640.
39. Leick MB, Shoff CJ, Wang EC, Congress JL, Gallicano GI. Loss of imprinting of IGF2 and the epigenetic progenitor model of cancer. American journal of stem cells. 2012; 1:59-74.
40. Cruz-Correa M, Cui H, Giardiello FM, Powe NR, Hylind L, Robinson A, Hutcheon DF, Kafonek DR, Brandenburg S, Wu Y, He X, Feinberg AP. Loss of imprinting of insulin growth factor II gene: a potential heritable biomarker for colon neoplasia predisposition. Gastroenterology. 2004; 126:964-970.
41. Sakatani T, Kaneda A, Iacobuzio-Donahue CA, Carter MG, de Boom Witzel S, Okano H, Ko MS, Ohlsson R, Longo DL, Feinberg AP. Loss of imprinting of Igf2 alters intestinal maturation and tumorigenesis in mice. Science. 2005; 307:1976-1978.
42. Yao XM, Hu JF, Daniels M, Shiran H, Zhou XJ, Yien HF, Lu HQ, Zeng ZL, Wang QX, Li T, Hoffman AR. A methylated oligonucleotide inhibits IGF2 expression and enhances survival in a model of hepatocellular carcinoma. J Clin Invest. 2003; 111:265-273.
43. Yao XM, Hu JF, Daniels M, Yien HF, Lu HQ, Sharan H, Li T, Vu TH, Hoffman AR. A novel orthotopic tumor model to study growth factors and oncogenes in hepatocarcinogenesis. Clin Cancer Res. 2003; 9:2719-2726.
44. Nie ZL, Pan YQ, He BS, Gu L, Chen LP, Li R, Xu YQ, Gao TY, Song GQ, Hoffman AR, Wang SK, Hu JF. Gene therapy for colorectal cancer by an oncolytic adenovirus that targets loss of the insulin-like growth factor 2 imprinting system. Mol Cancer. 2012; 11:86.
45. Schneider M, Huber J, Hadaschik B, Siegers GM, Fiebig HH, Schuler J. Characterization of colon cancer cells: a functional approach characterizing CD133 as a potential stem cell marker. BMC cancer. 2012; 12:96.
46. Fan X, Ouyang N, Teng H, Yao H. Isolation and characterization of spheroid cells from the HT29 colon cancer cell line. International journal of colorectal disease. 2011; 26:1279-1285.
47. Puglisi MA, Sgambato A, Saulnier N, Rafanelli F, Barba M, Boninsegna A, Piscaglia AC, Lauritano C, Novi ML, Barbaro F, Rinninella E, Campanale C, Giuliante F, Nuzzo G, Alfieri S, Doglietto GB, et al. Isolation and characterization of CD133+ cell population within human primary and metastatic colon cancer. European review for medical and pharmacological sciences. 2009; 13:55-62.
48. Sun J, Li W, Sun Y, Yu D, Wen X, Wang H, Cui J, Wang G, Hoffman AR, Hu JF. A novel antisense long noncoding RNA within the IGF1R gene locus is imprinted in hematopoietic malignancies. Nucleic Acids Res. 2014; 42:9588-9601.
49. Wang H, Li W, Guo R, Sun J, Cui J, Wang G, Hoffman AR, Hu JF. An intragenic long noncoding RNA interacts epigenetically with the RUNX1 promoter and enhancer chromatin DNA in hematopoietic malignancies. Int J Cancer. 2014; 135:2783-2794.
50. Franken NA, Rodermond HM, Stap J, Haveman J, van Bree C. Clonogenic assay of cells in vitro. Nat Protoc. 2006; 1:2315-2319.
51. Zhang S, Zhong B, Chen M, Yang G, Li Y, Wang H, Wang G, Li W, Cui J, Hoffman AR, Hu J. Epigenetic reprogramming reverses the malignant epigenotype of the MMP/TIMP axis genes in tumor cells. Int J Cancer. 2014; 134:1583-1594.
52. Wang L, Guo H, Lin C, Yang L, Wang X. Enrichment and characterization of cancer stemlike cells from a cervical cancer cell line. Molecular medicine reports. 2014; 9:2117-2123.