
INTRODUCTION
Gliomas make up about 30% of all brain and central nervous system tumors and 80% of primary malignant brain tumors, and they are essentially incurable [1]. Glioblastoma multiforme (GBM), the most common type of glioma, is highly aggressive and associated with very poor survival outcomes [2, 3]. Local invasiveness and neo-angiogenesis are hallmarks of aggressiveness of GBMs [4, 5]. Mesenchymal features including uncontrolled ability to invade and stimulate angiogenesis, and the corresponding molecular signatures such as alterations of Neurofibromatosis-1 (NF1) expression can be found in a portion of GBMs [6]. These mesenchymal (MES) GBMs are mostly primary tumors and, in some studies, display a worse prognosis than proneural (PN) GBMs, which have higher expression of PDGFR along with IDH1 point mutations [7, 8]. A subset of radio- and chemo-resistant cells have been characterized in the GBM bulk, which exhibit stem-like features such as stem cell biomarker expression, self-renewal, differentiation upon mitogen retraction and intracranial GBM formation in xenografted immunocompromised mice [9-11]. Interestingly, these so-called glioma-initiating cells or glioma stem cells (GICs/GSCs) isolated from MES or PN GBMs usually generate xenograft tumors with MES or PN features respectively [12]. Recent studies revealed that mesenchymal phenotypes of GICs could be induced by master transcription factors (TFs) including Signal transducer and activator of transcription 3 (STAT3), CCAAT enhancer-binding protein-β (C/EBPβ), and Transcriptional coactivator with PDZ-binding motif (TAZ) [13, 14]. In addition, the expressions of these master TFs were induced in GICs by TNF-α secreted by infiltrating macrophages/microglia to promote mesenchymal differentiation and radiation resistance [15].
Similar to features of neural progenitor/stem cells in embryonic and adult brain, GICs preferentially resides in close proximity to tumor microvasculature, which could provide favorable environment (niche) [16]. Most normal and tumor microvessels have two distinct but interdependent cellular components, endothelial cells (ECs) and contractile perivascular mural cells called pericytes. The crosstalk between ECs and pericytes via direct physical contact and paracrine signaling helps to maintain vessel structures and functions [17]. However, the tumor microvessels often exhibit structural and functional anomalies with irregular pericytes on endothelial tubules or microvasculature consisting of pericytes only but lacking ECs [18]. Moreover, the GICs are capable of generating ECs and pericytes both in vivo and in vitro, further supporting the cellular hierarchies in GBMs with tumorigenic GICs at the tip [18-21]. Thus, dissecting molecular mechanisms underlying GIC differentiating into mesenchymal and pericyte progenies would be crucial to developing therapeutic means that specifically target invasiveness and neo-angiogenesis.
HMGA2, a member of the high-mobility group A (HMGA) family, encodes a small, chromatin-associated protein that preferentially binds to AT-rich stretches of B-form DNA via its “AT hooks”. HMGA2 can modulate transcription by altering chromatin structure and through protein-protein interactions [22-24]. HMGA2 plays crucial roles in a variety of developmental and tumorigenic processes. Hmga2 knockout mice exhibit a pygmy phenotype [25]. Knockdown of Hmga2 and Hmga1, a HMGA2 paralogue, in cortical neural progenitor cells (NPCs) results in chromatin condensation and precocious astrocytic differentiation [24]. HMGA2 is also highly expressed in a variety of benign and malignant tumors of mesenchymal and epithelial origin including astrocytomas [23, 26, 27].
Here we explored roles of HMGA2 in maintaining key properties of GICs. Down-regulation of HMGA2 in GICs led to diminished self-renewal and tumorigenic capabilities, as well as undermined mesenchymal or pericyte differentiation. We also characterized novel HMGA2 target genes that may be involved in these processes.
RESULTS
HMGA2 is overrepresented in mesenchymal glioblastomas and labels GICs and pericytes
}HMGA2 is highly expressed in a variety of embryonic cells such as in neural progenitor cells but becomes silent in most adult tissues [25, 28]. Consistently, prominent HMGA2 expression can be detected in early (E10.5 – E12.5) embryonic cortical neural precursor cells, but was diminished in mid-gestation (E16.5) mouse cerebrum, subventricular zone (SVZ) and dentate gyrus of adult mice (Supplementary Figure S1A-S1B). Gliomas can be originated from mutated neural precursors [29, 30], and targeting self-renewal of GICs prolongs survival in animal models [31]. We therefore checked HMGA2 expressions in various glioma specimens (6 WHO grade I, 12 grade II, 4 grade III, 13 Grade IV/GBMs) and 5 normal brain tissues on a tissue array using immunohistochemistry followed by quantitation. In contrast to neglected HMGA2 expressions in normal brain tissues (NAT), profound HMGA2 expression can be seen in glioma samples, especially in WHO Grade II-IV gliomas (Figure 1A; Figure 1B, the left panel). Notably, both nuclear and cytosolic HMGA2 can be detected in some samples, which indicates the presence of nuclear localization signal (NLS) truncated forms [32]. We further quantitated HMGA2 densities to take into account denser cellularity in gliomas, and detected significant stronger HMGA2 signals in Grade III and Grade IV (GBM) gliomas (Figure 1B, the right panel). Notably, HMGA2 is enriched in highly aggressive regions of GBMs with typical features of pseudopalisading necrosis, where markers for stem-like cells (SOX2, NESTIN, CD133, β-catenin), proliferation (Ki67 and PH3), microvessels (α-SMA) and invasion (CD44, IBA-1) are also highly expressed (Supplementary Figure S1C-S1D). Next, we examined HMGA2 expression in four subtypes of GBMs using expression data retrieved from The Cancer Genome Atlas (TCGA). Consistent with HMGA2 roles in mediating EMT in a number of solid tumors, HMGA2 expression is significantly higher only in mesenchymal (MES) GBMs (Figure 1C). Moreover, HMGA2 expression is positively correlated with expressions of STAT3 and C/EBPβ, two essential transcription factors that promote mesenchymal phenotypes in GBMs; as well as that of CD44 [33], another hallmark of glioma invasiveness (Figure 1D). Moreover, high HMGA2 expression levels correlate with shorter survival time in glioma patients using the CGGA (The Chinese Glioma Genome Atlas) dataset [34] (Supplementary Figure S1E), which is consistent with reports showing higher levels of IL-6/HMGA2/SOX2 expression indicated shorter overall survival period in GBM patients [35].
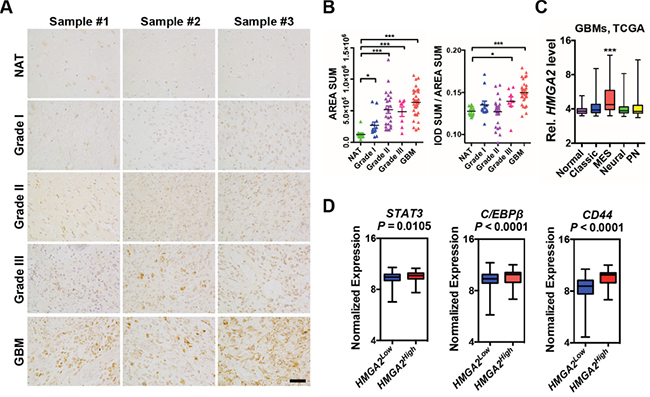
Figure 1: Elevated HMGA2 expression in gliomas. A. Representative immuno-histochemistry images of HMGA2 expressions in gliomas and normal adjacent brain tissues (NAT) using a tissue array. B. Scattered dot plots of total HMGA2+ expression area (left) and intensity (right) of HMGA2 expression in each section. Each sample has two duplicate sections. Measuring and quantifications of IHC images were performed using the Image-pro Plus 6.0 software (Media Cybernetics). C. Box and whisker plots showing expressions of HMGA2 in normal and four subtypes of GBM (grade IV) specimens using data retrieved from TCGA. D. Box plots showing normalized expressions of STAT3, C/EBPβ and CD44 metagene in HMGA2Low and HMGA2High GBMs using data retrieved from TCGA. HMGA2low (n = 471) and HMGA2high (n = 87) expression groups were defined using the minimum P-value approach (maximal chi square statistics approach). P values were determined using a nonparametric Wilcoxon test. IOD, integrated optical density; MES, mesenchymal; PN, proneural. Scale bar: 50 μm.
Next, we use immunofluorescent (IF) stainings to study cell types labeled by HMGA2 in GBM samples. First, a significant portion of HMGA2+ cells (24%-55%) express SOX2, a neural stem cell marker; and 11%-35% SOX2+ cells are HMGA2 positive (Figure 2A-2B). Consistently, HMGA2 is ubiquitously co-expressed with SOX2 in adherent cultured glioma-initiating cells (GICs) (Figure 2C). Intriguingly, in some GBM samples, HMGA2-labelled cells have close proximity to tumor microvessels, or even positive for α-SMA/ACTA2 (smooth muscle α-actin), CD146, CD248 and PDGFRB (platelet-derived growth factor receptor beta), which are pericyte (the smooth muscle cell for microvessels) biomarkers (Figure 2D, Supplementary Figure S2A-S2C). As many as 45% HMGA2+ cells are α-SMA positive, and 70-80% α-SMA+ cells express HMGA2 (Figure 2E). However, HMGA2 largely doesn't label CD34+ or CD31+ endothelial cells (ECs, Supplementary Figure S2D). Since GICs can generate glioma pericytes [21], we postulate HMGA2 might have a role in this process.
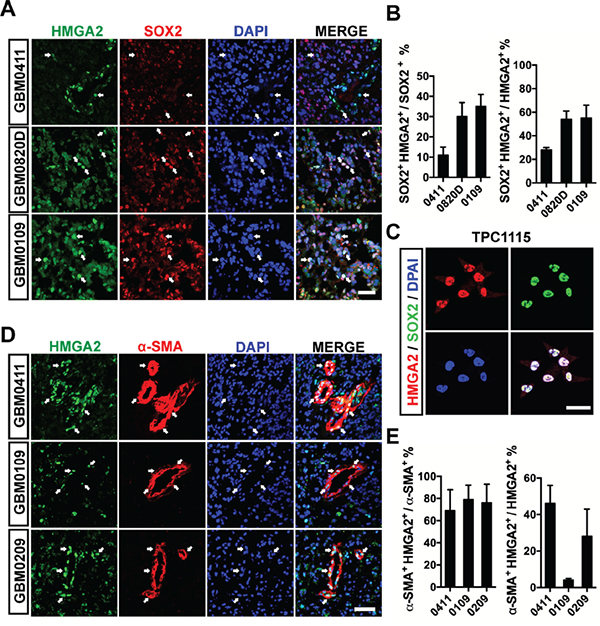
Figure 2: HMGA2 labels GICs and pericytes in glioma tissues. A. Representative immunofluorescent images showing co-expression of HMGA2 and SOX2 in three GBM samples. B. Quantification of co-localization of HMGA2+ and SOX2+ glioma cells of three fields under a 20× object (44,100 μm2 per field). C. Co-localization of HMGA2 and SOX2 in primary glioma-initiating cells, TPC1115. D. Representative immunofluorescent images showing co-expression of HMGA2 and α-SMA in three GBM samples. E. Quantification of co-localization of HMGA2+ and α-SMA+ glioma cells of three fields under a 20× object (44,100 μm2 per field). Arrows indicate HMGA2-expressing GBM cells. Scale bars: (A and D) 50 μm; (C) 40 μm.
HMGA2 maintains self-renewal and tumorigenicity of glioma-initiating cells
The high expression of HMGA2 in glioma-initiating cells/glioma stem cells/tumor propagating cells (GICs/GSCs/TPCs) prompted us to examine whether HMGA2 is essential for GIC propagating (self-renewal) and tumorigenicity. To this end, we established a few GIC lines from surgical resected high-grade glioma samples using free-floating neurosphere or adherent cultures. These GICs ubiquitously express stem-like biomarkers (SOX2 and NESTIN), can self-renew in the presence of mitogens (fibroblast growth factor and epidermal growth factors), and give rise to a variety of differentiated progenies such as neurons, astrocytes and pericytes (Figure 2C and Supplementary Figure S2E-S2G). Moreover, they are capable of generating intracranial tumors when xenografted into immune-compromised nude mice (Figure 3E and Figure 7G).
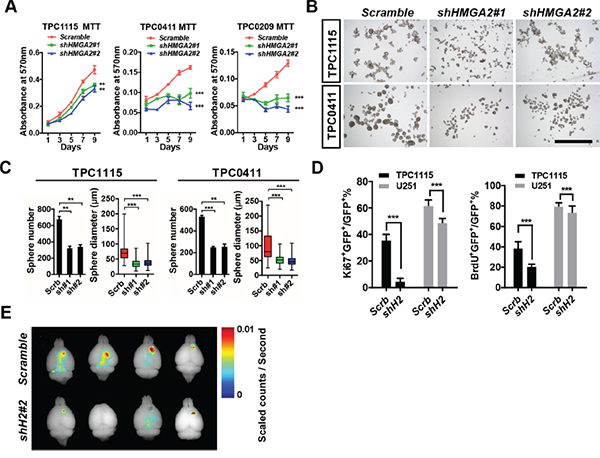
Figure 3: HMGA2 sustains GIC self-renewal and tumorigenicity. A. MTT assay showing effects of HMGA2 knockdown on GIC cell propagation in adherent cultures. B. Representative images showing TPC1115 and TPC0411 GICs maintained in neurosphere conditions for 7 days after transducing with indicated lentiviruses. C. Quantification of sphere numbers and diameters of three independent experiments in (B). D. Quantification of Ki67- (left) and BrdU- (right) labeled TPC1115 GICs and U251 glioma cells upon depletion of HMGA2. E. Xenografted nude mice were perfused with 4% PFA 10 weeks after intracranial TPC1115 transplantation (1×10⁵) and brains were dissected out. Fluorescent images of brains were captured using the Maestro In-vivo Imaging System. Scrb, scramble shRNA; sh#(1-2), shHMGA2#(1-2). Scale bar: 1mm.
Having the tools ready, we first asked whether HMGA2 is essential for GIC self-renewal. We prepared shRNA-expressing lentiviruses to target the expression of HMGA2. Among them, shHMGA2#1 and shHMGA2#2 can efficiently down-regulate HMGA2 mRNA and protein levels in U251 cells (Supplementary Figure S3A-S3C). We therefore transduced them into three GIC lines, TPC1115, TPC0411 and TPC0209. In both adherent (Figure 3A) and free-floating neurosphere (Figure 3B-3C) culture conditions, HMGA2 knockdown leads to compromised propagating capabilities in all tested GICs. Furthermore, when GICs transduced with shHMGA2 lentiviruses were xenografted intracranially into striata of athymic nude mice, they produced much smaller tumors compared to GICs expressing scramble control shRNAs (Figure 3E and Figure 7G). In contrast, HMGA2 knockdown has minimal effects on proliferation of U251 and U87MG glioma cells, which is exemplified by much milder changes in MTT assays, ratios of Ki67-positive cells and BrdU incorporation (Figure 3D, Supplementary Figure S3D-S3F and data not shown). This indicated that HMGA2 preferentially sustains GIC self-renewal. We’d like to point out that HMGA2-depleted U251 cells also displayed compromised subcutaneous tumorigenicity, suggesting HMGA2 roles in promoting tumorigenesis in vivo (Supplementary Figure S3G-S3H).
HMGA2 potentiates pericyte differentiation and invasive properties of glioma-initiating cells
We next studied HMGA2’s function in promoting mesenchymal phenotypes and invasiveness in gliomas. We first explored whether HMGA2 is crucial for pericyte differentiation of GICs induced by cytokines. TGF-β treatment greatly enhanced expression levels of ACTA2 (α-SMA coding gene) and PDGFRB (platelet-derived growth factor receptor, beta polypeptide), two pericyte biomarkers in TPC1115 GICs (Figure 4A and Supplementary Figure S2F). Consistent with previous studies, the expressions of HMGA2 [36], and NG2 (another pericyte marker), were also moderately elevated upon TGF-β treatment (Supplementary Figure S4A). TNF-α treatment has similar effects on expressions of pericyte markers (Supplementary Figure S4A). However, treating GICs with PDGFBB, one of the ligands for PDGFRB, has minimal effects (Supplementary Figure S4A). Next, we knocked down expression of HMGA2 during GIC differentiation elicited by TGF-β, and found the elevated expressions of ACTA2 and PDGFRB were largely abrogated (Figure 4A). Furthermore, the expression densities of PDGFRB and NG2 were much lower in cells derived from HMGA2-depleted GICs that were inoculated subcutaneously along with the matrigel matrix (Figure 4B-4C). Similarly, the expression levels of key mesenchymal molecules including YKL40/CHI3L1 and FN1 (FIBRONECTIN 1) in GICs can be greatly induced by TNF-α treatment or overexpressing C/EBPβ, a transcription factor essential in mesenchymal transformation of gliomas (Supplementary Figure S4A-S4B). TGF-β treatment also enhanced the expression of FN1 (Supplementary Figure S4A). We next explored whether HMGA2 is crucial in maintaining expression of these molecules during mesenchymal differentiation. As expected, depleting of HMGA2 leads to significant downregulation of YKL40, FN1 and SNAIL2/SLUG in TNF-α, TGF-β and C/EBPβ induced differentiation of TPC1115 GICs (Supplementary Figure S4C-S4E).
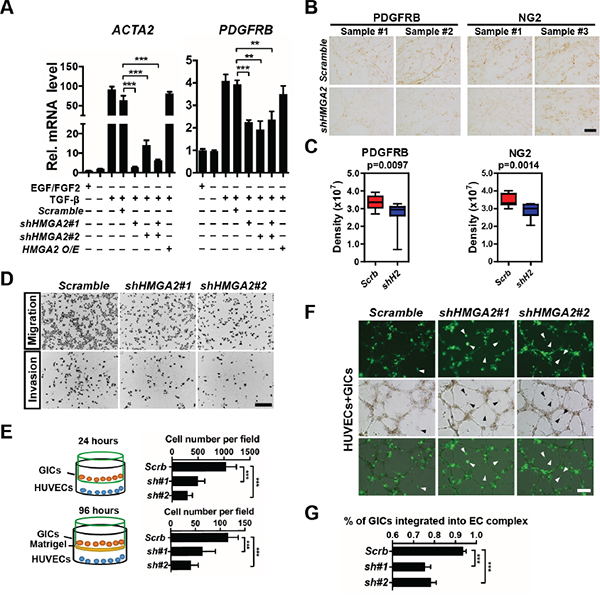
Figure 4: HMGA2 is required for invasive properties, pericyte differentiation, and EC integration of glioma-initiating cells. A. Quantification and statistical analyses of ACTA2 (α-SMA) and PDGFRB expression levels in TPC1115 GICs upon indicated treatments. B. Representative images showing immunohistochemistry of PDGFRB and NG2 in GICs/matrigel transplants transduced with scramble- and shHMGA2-lentiruses. C. Quantification and statistical analyses of PDGFRB and NG2 expression in B (n=4 samples). Measuring and quantifications of IHC images were performed using the Image-pro Plus 6.0 software (Media Cybernetics). D. Representative images showing migratory (top) and invasive (bottom) TPC1115-derived cells transduced with indicated lentiviruses in transwell assays. Trans-welled Cells were stained with DAPI for counting. E. Quantification of migratory (top) and invasive (bottom) GIC-derived cells in three independent experiments. F. HUVECs were plated onto matrigel to form endothelial cell (EC) complexes for 16-18 hours. Next, transduced TPC1115 GICs (ZsGreen+) were plated onto EC complexes and co-cultured for 24 hours. Top: cell derived from lentiviral transduced GICs; middle: phase-contrast images; bottom: merged images. Arrowheads point to unincorporated GICs. G. Quantification and statistical analyses of GIC integration into EC complexes. Scrb, scramble shRNA; sh#(1-2), shHMGA2#(1-2). Scale bars: (B) 100 μm, (D) 200 μm, (F) 300 μm.
We next studied whether HMGA2 is required for migration and invasion of GIC-derived cells. In transwell migration assays, human umbilical vein endothelial cells (HUVECs) were plated on the bottom surface of Boyden chambers, and GICs onto the insert membranes with the presence of TGF-β. In invasion assays, matrigel was coated on the top of the insert membrane prior to GIC plating. HMGA2-depleted GICs were much less potent in both migration and invasion (Figure 4D-4E). HUVECs can form vessel-like tubular structures (EC complex) in vitro (Figure 4F, Supplementary Figure S4F). Co-cultured GICs were mostly integrated into the complex in 24 hours post-plating (Supplementary Figure S4F). However, in accordance with transwell assays, HMGA2-depleted GICs were less capable of integrating into the EC complex than control GICs (Figure 4F-4G). Furthermore, xenografted brain tumors derived from HMGA2-depleted GICs contained much fewer vascular structures (Figure 7G, Supplementary Figure S6H). Collectively, HMGA2 is essential for chemotactic, invasive and angiogenic potentials of GIC-derived cells.
HMGA2 is required for expression of genes essential for GIC cell-cycle progression and invasion
To understand molecular signaling regulated by HMGA2, we performed RNA-seq transcriptome analysis of TPC1115 GICs tranduced with shRNAs against HMGA1 or HMGA2 or both for 72 hours in the absence of EGF/FGF2 mitogens. Since HMGA1/2 promotes loosening of chromatin, thus facilitates gene expression, we focused on genes down-regulated upon HMGA2 knockdown (KD). Consistent with reduced proliferation of GICs upon HMGA2 (Figure 3A-3C) or HMGA1 knockdown (data not shown), down-regulated transcripts shared in HMGA1-KD, HMGA2-KD and HMGA1/HMGA2-KD GICs are enriched with those encoding key regulators for cell-cycle progression (Figure 5A, Supplementary Table S1A). Twenty-four out of fifty-six transcripts in this group were categorized into genes involved in cell cycle regulation, including CCND1, CCNE2, MCM2, MCM6, E2F1, DSN1, ASPM, BIRC5, SKA3 and THBS1 (Supplementary Table S1). Consistently, cell-cycle analysis of HMGA2-depleted GICs showed more cells were at G1 phase and fewer cells at S phase relative to scramble-transduced GICs (Figure 5C). However, we reasoned that these cell-cycle regulators are unlikely to be HMGA2/HMGA1 direct targets, because HMGA2 depletion in immortal cells (e.g. U251 and U87MG) has neglected effects on cell proliferation (Figure 3D, Supplementary Figure S3D-S3F). Surprisingly, the SOX2 expressions were not altered after HMGA2 knockdown or overexpression. HMGA2 has also been reported to promote SOX2 expression by directly binding to the SOX2 promoter in GBM cells [35]. This discrepancy might be due to heterogeneity between tumors.
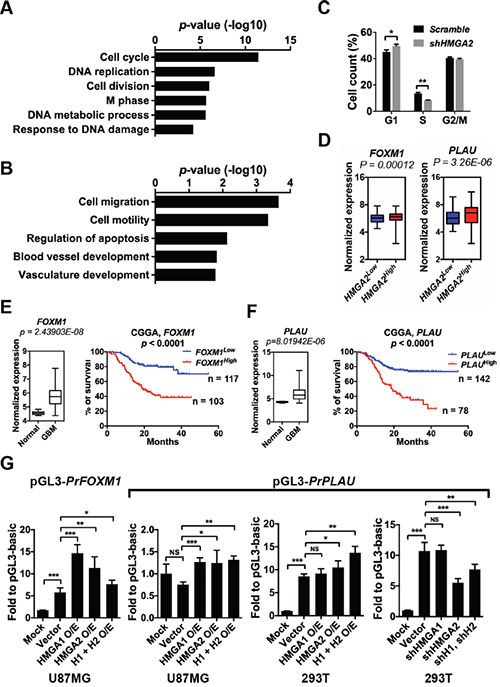
Figure 5: HMGA2 facilitates the expressions of FOXM1 and PLAU. A. Gene Ontology (GO) analyses of commonly down-regulated genes in TPC1115 GICs depleted with HMGA2, HMGA1 and HMGA2/HMGA1. B. List of GO terms summarizing down-regulated genes in TPC1115 GICs depleted with HMGA2. C. Cell cycle changes of TPC1115 GICs upon knockdown of HMGA2. D. Box plots showing normalized expressions of FOXM1 and PLAU metagene in HMGA2Low and HMGA2High GBMs using data retrieved from TCGA. P values were determined using a nonparametric Wilcoxon test. HMGA2low (n = 471) and HMGA2high (n = 87) expression groups were defined using the minimum P-value approach (maximal chi square statistics approach). E-F. Left: expression levels of FOXM1 (E) and PLAU (F) in 10 normal brains and 557 GBM samples using data retrieved from TCGA; right: Kaplan-Meier survival plots showing correlations of glioma patients’ survival with expression levels of FOXM1 (E) and PLAU (F) using the CGGA (Chinese Glioma Genome Atlas) dataset. G. Dual-luciferase assays showing relative luciferase activities of FOXM1 and PLAU promoter fragments (PrFOXM1 and PrPLAU) in U87MG and 293T cells transfected with indicated vectors. O/E, overexpression; H1, HMGA1; H2, HMGA2.
One of the molecules, FOXM1 (Foxhead Box M1), is an attractive candidate that may be a downstream target of HMGA2. First, FOXM1 expression levels are positively correlated with HMGA2 expression in GBM specimens from the TCGA dataset and glioma samples from the CGGA dataset (Figure 5D; Supplementary Figure S5A, the left panels). Second, FOXM1 is overrepresented in GBM patients and its expression levels are inversely correlated with glioma patients’ survival period using the CGGA dataset [34] (Figure 5E). Last, FOXM1 stimulates self-renewal, tumorigenicity and invasiveness of glioblastoma stem-like cells by transactivating a number of molecules, including IPO7 (importing-7), CDC20, PDGF-A, ANXA1, MMP-2 and VEGF [37-41]. FOXM1 also promotes β-catenin nuclear localization and controls Wnt target-gene expression during glioma tumorigenesis [42].
Moreover, the transcripts specifically down-regulated in HMGA2-depleted GICs are enriched with molecules implicated in cytoskeleton, cell migration, cell motility, and blood vessel development, including genes encoding ADAM9 (ADAM metallopeptidase domain 9), ROCK1 (Rho-associated, coiled-coil containing protein kinase 1), KIF4 (kinesin family member 4), PLAU/u-PA (plasminogen activator, urokinase), ITGA4 (integrin, alpha 4), CYR61 (cysteine-rich, angiogenic inducer, 61) (Figure 5B, Supplementary Table S1B). Among them, PLAU, a serine protease involved in degradation of the extracellular matrix and tumor cell migration and proliferation, might mediate migration and invasion of U87MG glioma cells [43]. Similarly, PLAU is highly expressed in GBM specimens (Figure 5F), and its expression level is positively correlated with HMGA2 expression in GBM specimens and inversely correlated with glioma patients’ survival period (Figure 5D, 5F; Supplementary Figure S5A, the right panels).
Using qRT-PCR, we confirmed that the expression levels of FOXM1, PLAU, CYR61, THBS1 and ADAM9 are indeed significantly down-regulated upon HMGA2 depletion in TPC1115 GICs, U87MG glioma cells and SK-N-SH neuroblastoma cells (Supplementary Figure S5B-S5D). Consistent with the transcriptome analysis, depletion of HMGA1 in these cells has minimum or opposite effects on the expressions of PLAU, CYR61 and ADAM9 (Supplementary Figure S5B-S5D).
Next, we carried out luciferase reporter assays to explore whether HMGA2 can facilitate the expression of FOXM1 and PLAU. The promoter region of FOXM1 (-2019 to +57 relative to the transcription starting site/TSS), and PLAU (-1886 to +26 relative to the TSS) were cloned into pGL3-Basic luciferase reporter vector. In U87MG glioma cells, overexpression of either HMGA1 or HMGA2 or both significantly enhances luciferase activities driven by the two promoters. In 293T cells, there was robust basic luciferase activity driven by the PLAU promoter. Knocking down or overexpressing HMGA2 significantly reduces or enhances the luciferase activities driven by the PLAU promoter respectively, whereas manipulating the expression of HMGA1 has no effect (Figure 5G).
Expression of FOXM1 or PLAU in HMGA2-depleted GICs rescued their defects in self-renewal, invasion and tumorigenicity
To elucidate whether these candidates are responsible for HMGA2’s roles in GIC self-renewal and invasive properties, we carried out functional rescue experiments. In limiting dilution assays (Figure 6A), adherent (Figure 6B) and neurosphere cultures (Figure 6C-6D, Supplementary Figure S6E-S6G), overexpression of FOXM1 or PLAU mostly reversed the proliferative defects of TPC0411 GICs caused by HMGA2 knockdown in both the first and second passages (Supplementary Figure S6F). Moreover, FOXM1 or PLAU overexpression can partially rescue migratory and invasive potentials in HMGA2-depleted GICs, which is similar to putting back shRNA-resistant HMGA2 (Figure 7A-7D, Supplementary Figure S6A). Similarly, re-expression of HMGA2, FOXM1 or PLAU largely reversed defects in EC complex integration of HMGA2-depleted GICs (Figure 7E-7F). The FOXM1 gene transcribes several transcript variants encoding different isoforms. Intriguingly, it’s the expression of the transcript variant 3 of FOXM1 (FOXM1v3/FOXM1b, NM_202003.2), but not FOXM1v2/FOXM1c (NM_021953.3) that is more prominently down-regulated upon HMGA2 knockdown (Supplementary Figure S6B). Accordingly, it was the overexpression of FOXM1b but not FOXM1c that restored the self-renewal and invasiveness potentials in HMGA2 depleted GICs (Supplementary Figure S6C-S6D), which coincides with previous studies [44]. Finally, expression of FOXM1b or PLAU in HMGA2-depleted GICs largely reverted their tumorigenic potentials when transplanted intracranially. Histological and immunofluorescent analyses showed restored cellularity and tumor neo-angiogenesis in FOXM1b- or PLAU-expressing GICs that were devoid of HMGA2 (Figure 7G and Supplementary Figure S6H).
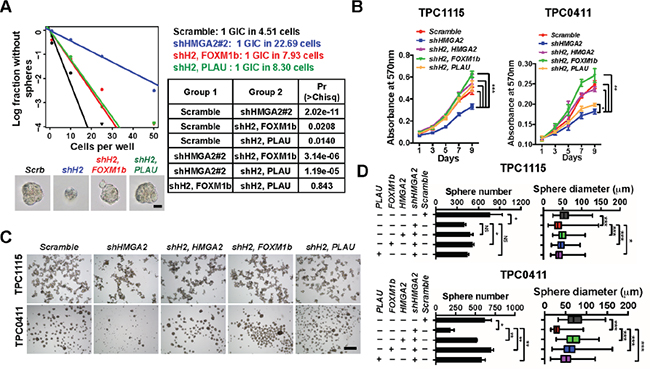
Figure 6: HMGA2 relies on FOXM1 and PLAU to maintain GIC self-renewal. A. TPC1115 GICs were transduced with indicated lentiviruses before plating into 96-well plates for limiting dilution assays. Cultures were maintained until day 10, when the number of wells containing spheres for each cell plating density (number of positive cultures) was recorded, calculated and plotted using online ELDA analysis program. Bottom, representative sphere images in each group. Right, incidence of sphere-forming glioma initiating cells (GICs), and P values [Pr(>Chisq)] between groups. B. MTT assay showing effects of HMGA2 knockdown on GIC cell propagation in adherent culture conditions. C. Representative images showing TPC1115 and TPC0411 GICs cultured in neurosphere conditions for 7 days after transducing with indicated lentiviruses. D. Quantification of sphere numbers and diameters of three independent experiments in (C). shH2, shHMGA2#2. Scale bars: (A) 50 μm; (C) 500 μm.
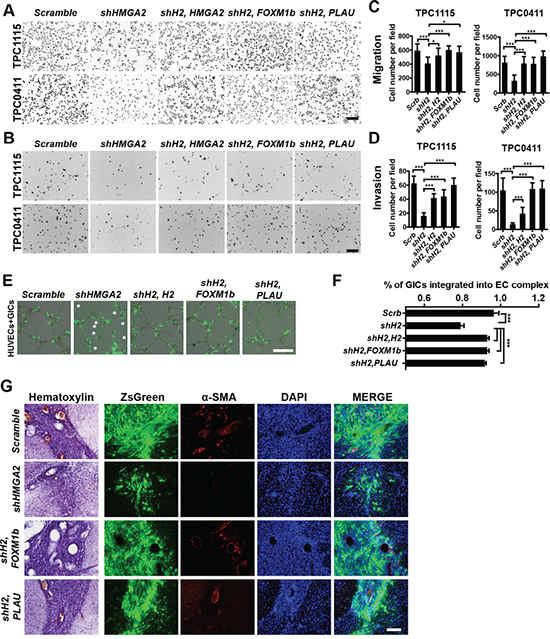
Figure 7: Overexpression of FOXM1 or PLAU restores invasive, tumorigenic and angiogenic potentials in HMGA2-depleted GICs. A-B. Representative images showing migratory (A) and invasive (B) TPC1115- and TPC0411-derived cells transduced with indicated lentiviruses in transwell assays. Trans-welled Cells were stained with DAPI for counting. C-D. Quantification of migratory (C) and invasive (D) GIC-derived cells in three independent experiments. E. Representative images showing integration of transduced GICs (ZsGreen+) with EC complexes. Arrowheads point to unincorporated GICs. F. Quantification and statistical analyses of GIC integration into EC complexes. G. Representative immuohistochemical and immunofluorescent images showing sections from brains implanted with TPC1115 GICs transduced with indicated lentiviruses (ZsGreen expression) and stained with α-SMA and DAPI. shH2, shHMGA2#2; H2, HMGA2. Scale bars: (A-B) 200 μm; (E) 300 μm; (G) 100 μm.
To summarize, we showed FOXM1 and PLAU are two key downstream targets of HMGA2 to maintain GIC propagation, gliomagenesis and aggressiveness both in vitro and in vivo.
DISCUSSION
In this study, we unveiled that HMGA2 is highly expressed in mesenchymal GBMs, labels glioma-initiating cells (GICs) and glioma pericytes. Furthermore, HMGA2 is essential for GICs’ potentials of self-renewal, tumorigenecity, mesenchymal and pericyte differentiation. Using transcriptome analyses and rescuing experiments, we also characterized FOXM1 and PLAU as two direct target genes of HMGA2. Future studies will elucidate whether targeting HMGA2-mediated signaling would improve survivals in GBM genetic mouse models.
Although HMGA2 depletion has little effects on proliferation of regular glioma cells, it’s essential for self-renewal of GICs. Previous studies have proposed several mechanisms that may account for HMGA2 abilities to promote stem/progenitor cell self-renewal and tumor cell transformation. For example, HMGA2 promotes NSC self-renewal by negatively regulating Ink4a/Arf expression from the CDKN2A locus [45]. Moreover, HMGA2 may control expression from this locus indirectly by repressing the expression of JunB, whose gene product is a component of AP1 complex and an activator of Ink4a/Arf expression, in neoplastic transformation of thyroid cells [46]. However, the expressions of JUNB, INK4A and ARF are unaltered in HMGA1 and/or HMGA2 depleted GICs, suggesting GICs utilize distinct mechanisms directed by HMGA2.
Utilizing transcriptome profiling and functional rescuing assays, we demonstrated that HMGA2 sustains self-renewal and invasiveness of GICs by allowing expression of FOXM1 and PLAU, two core players that have been implicated in gliomagenesis and aggressiveness. FOXM1 is a transcriptional activator involved in cell proliferation. It is phosphorylated in M phase and induces the expression of several cell cycle genes, such as cyclin B1 and cyclin D1 [47-49]. PLAU (uPA), via signals through its receptor PLAUR (uPAR), exerts multiple functions not only in invasion of migrating cells by digesting extracellular molecules, but also in cellular adhesion, differentiation, proliferation and migration in a non-proteolytic fashion [50]. The expression of PLAU is drastically reduced in HMGA2- but not HMGA1-depleted GICs. Further, overexpression of PLAU largely rescued self-renewal, migration, invasion and vascular formation defects induced by HMGA2 knockdown. Interestingly, FOXM1 transactives PLAUR expression to promote colon cancer progression and metastasis [51]. These suggest the presence of the HMGA2-FOXM1/PLAU-PLAUR axis in maintaining GIC self-renewal and aggressiveness.
HMGA2 is expressed in both GICs and pericytes (perivascular mural cells). We and other groups found GICs are able to generating pericytes in a xenografted GBM model or in culture by applying TGF-β [21]. We also revealed HMGA2’s essential roles in this process, as depletion of HMGA2 mostly abolishes GICs’ potential of pericyte differentiation. On the other hand, a subgroup of pericytes are mesenchymal stem cells (MSCs) capable of differentiating into multiple cell types, including osteoblasts, fibroblasts, adipocytes, myogenic cells and odontoblasts [52, 53]. Therefore, pericytes in gliomas could be stem-like cell pools and it would be tempting to explore if HMGA2 is key to regulating the fate switch between the two cell populations.
MATERIALS AND METHODS
Glioma specimen and brain tissue collection
Glioma surgical specimens were collected in Wuhan Union Hospital and The Tenth Affiliated Hospital, Tongji University in accordance with institution-approved protocols. All patients signed and approved consent forms prior to surgery. Collected specimens were split into three parts for protein/RNA isolation, 4% paraformaldehyde (PFA) fixation/cryo-sectioning and GIC establishment (see below sections) respectively. Specimens were examined by neuropathologists to verify tumor types and grades.
Cell culture
U251 and U87MG glioma cells were gifts from Dr. Xiaozhong Peng at Peking Union Medical College. SK-N-SH neuroblastoma cells were purchased from China Center for Type Culture Collection. Cells were maintained in according culture media (DMEM or MEM) containing 10% fetal bovine serum (Life Technologies, Grand Island, NY, USA).
Analysis of glioma patients’ survival and expression data
Tumor gene expression and survival data of glioma patients were retrieved from The Cancer Genome Atlas (TCGA) and The Chinese Glioma Genome Atlas (CGGA). Patients were divided into HMGA2low and HMGA2high expression groups using the minimum P-value approach (maximal chi square statistics approach) or by the median expression levels.
Establishment, propagating and differentiation of glioma-initiating cells (GICs)
Surgically removed GBM specimens were washed with and minced in filter-sterilized hibernation buffer (30 mM KCl, 5 mM NaOH, 5 mM NaH2PO4, 5.5 mM glucose, 0.5 mM MgCl2, 20 mM Na-pyruvate, 200 mM Sorbitol, pH 7.4) followed by dissociating into single cells using pre-warmed Papain (Worthington Biochemical, Lakewood, NJ, USA) enzyme solution (1×DMEMD, 1 mM Na-pyruvate, 1 mM L-Glutamine, 1 mM N-Acetyl-L-Cysteine, 20 U/mL Papain, 12 μg/mL DNase I). Dissociated cells were cultured in low-adhesion plates (Corning, NY, USA) using serum-free media consisting of DMEM/F12 media (Life Technologies), N2 and B27 supplements (1×, Life Technologies), 1 mM Na-pyruvate, 1 mM L-Glutamine, 1 mM N-Acetyl-L-Cysteine (NAC), human recombinant FGF2 and EGF (20 ng/mL each; Life Technologies) to form neurospheres. Fresh N2, B27, NAC, FGF2 and EGF supplements (10×) were added every 3-4 days. Alternatively, dissociated GBM cells (1×10⁶ cells per 10cm plate) were plated onto laminin (L2020, Sigma-Aldrich, St. Louis, MO, USA) coated plates using aforementioned serum-free media. Medium was replaced every 3-4 days. Floating or adherent GIC cells were passed every 7 days. We tested the expression of stemness proteins such as SOX2 and NESTIN and the differentiation capability at the 3rd passage using immunofluorescent assays. Differentiation of GICs was achieved by removing FGF2 and EGF from the medium and adding 1-10% FBS, 5ng/mL TGF-β or 5ng/mL TNF-α for 6-7 days. For mesenchymal differentiation, GICs were transduced with lentiviruses expressing C/EBPβ and further cultured for 6 days. GICs between passages 7 and 12 were used in all studies. For neurosphere formation assays, GICs were grown in 6-well low-adhesion plates (3×10⁴ cells per well) for 6-7 days followed by neurosphere measurement and cell number counting.
Preparation of lentiviruses for overexpression and shRNA-mediated knockdown
Annealed DNA fragments containing scrambled sequences and short-hairpin RNA (shRNA) sequences against HMGA1 and HMGA2 were cloned into a modified pLKO.1 lentiviral vector in which the puromyin-resistant cassette is replace with an ZsGreen-expressing cassette. HMGA1, HMGA2, FOXM1 and PLAU cDNAs were cloned into pCDH lentiviral vectors for overexpression. For production of lentiviruses, pLKO.1 or pCDH vectors were co-transfected into 293T cells with psPAX and pMD2.G packaging plasmids using calcium-phosphate methods. To prepare viruses used in GIC culture, regular 293T culture medium was replaced with serum-free GIC medium (see above section) 24 hours after transfection; and supernatants were collected 24 hours later. ShRNA targeting sequences: shHMGA1 (5’-CAA CTC CAG GAA GGA AAC CAA-3’); shHMGA2#1 (5’-AGT CCC TCT AAA GCA GCT CAA-3’); shHMGA2#2 (5’-GCC CAA GGC ACT TTC AAT CTC-3’).
Cell proliferation assay (MTT assay) and cell cycle analysis
GICs were transduced with indicated lentiviruses. Forty-eight hours later, 1000 cells were plated into 96-well plates with the presence of 5 μL MTT solutions (5 mg/mL) in each well. Cell proliferation assays were performed on days 1, 3, 5, 7 and 9 post-plating using the classical MTT reduction assay. Briefly, cells were added with 100 μL dissolving solutions (50% dimethylformamide, 30% SDS, pH4.7), and were incubated for 4 hours at 37°C. The absorbance was detected at 570 nm with a Versamax Microplate Reader (Molecular Devices, Sunnyvale, CA, USA).
For cell cycle analysis, ethanol-fixed cells were treated with RNase A and stained with propidium iodide (100 μg/mL in PBS) at 4°C for 15 minutes. The stained cells were detected using CyAn-ADP flow cytometer (Beckman Coulter, Brea, CA, USA). Data were analyzed using a cell-cycle analysis program (Flowjo 7.6) to calculate percentiles of cells at G1, G2/M and S phases.
In vitro limiting dilution assay
GICs were transduced with lentiviruses. Forty-eight hours later, viable cells were counted and decreasing numbers of cells per well (50, 20, 10 and 1) were plated into 96-well plates. Cultures were fed 25μl of medium every 3 days until day 10, when the number of positive cultures was recorded. Extreme limiting dilution analyses were carried out using a web-based software available at http://bioinf.wehi.edu.au/software/elda/ [54]. Regression lines were plotted and x-intercept values calculated, which represent the number of cells required to form at least one tumor sphere in every well.
In vitro endothelial cell (EC) complex formation
Human umbilical vein endothelial cells (HUVECs) were gifts from Dr. Luyang Yu at Zhejiang University and were maintained in EBM-2 medium (LONZA, Basel, Switzerland) at 37°C and 5% CO2. HUVECs between passages 7 and 10 were used for EC formation. HUVECs (2.0×10⁴cells per well) were plated onto 48-well plates coated with Matrigel (125 μL per well, BD Biosciences, Franklin Lakes, New Jersey, USA) in the presence of 2-5 ng/mL TGF-β. 16-18 hours later, tubule or mesh-like structures were formed. Then lentivirus-transduced GICs (2.0×10⁴) were seeded onto the preformed EC complex. After 24 hours incubation, EC-GIC cultures were fixed, imaged, and quantified.
Transwell migration and invasion assays
HUVECs (4.0-5.0×10⁴ cells per well for migration assays; 1.0-2.0 × 10⁴ cells per well for invasion assays) were pre-cultured in 24-well plates for 16-18 hours. Dissociated GICs were seeded into Boyden chambers (8 μm pore size with polycarbonate membrane) supplemented with 2 ng/ml TGF-β. The chambers were coated with Matrigel Matrix (354234, BD Biosciences) for invasion assays. After 24 hours (migration) or 96 hours (invasion), cells on the top surface of the insert were removed by wiping with cotton swabs. Cells that migrated to the bottom surface of the insert were stained in DAPI and subjected to microscopic inspection. Images of five random fields were captured from each membrane, and then numbers of migratory or invasive cells was counted.
Immunohistochemistry (IHC), immunofluorescence (IF), and immunoblotting
Paraffin-embedded glioma tissue arrays were purchased from Alenabio (Xi’an, China). Sections were baked in oven at 60°C for 30 minutes on a vertical rack to melt the extra layer of coated paraffin. Then slides were immersed in xylene twice, rehydrated in graded concentrations of ethyl alcohol, and then washed in dH2O. Then slides were incubated in 10 mM sodium citrate (pH 6.4) retrieval solution and heated at 95°C for 15 minutes. Slides were then sequentially cooled, washed in phosphate-buffered saline for 10 minutes, and incubated in 0.3% H2O2 for 15 minutes to deplete endogenous peroxidase activity. The tissue arrays were blocked with blocking buffer (3% heat-inactivated normal goat serum, 0.1% bovine serum albumin and 0.1% Triton-X 100 in 10 mM Tris, 100 mM NaCl, pH 7.4) for at least 1 hour. Sections were then incubated overnight with the anti-HMGA2 antibody diluted in blocking buffer. The next day, the staining was revealed using 3,3'-diaminobenzidine (DAB) as the substrate after peroxidase-conjugated avidin/biotinylated enzyme complex incubation (VECTASTAIN Elite ABC system, Vector Labs, Burlingame, CA, USA). Measuring and quantifications of IHC images were performed using the Image-pro Plus 6.0 software (Media Cybernetics). For immunofluorescent stainings, 4% paraformaldehyde (PFA) fixed 14 μm cryo-sections or cells were permeabilized and blocked with blocking buffer for one hour at R/T. Samples were then incubated with primary antibodies diluted in blocking buffer overnight at 4°C or at R/T. The next day, slides were washed 3 times for 10 minutes with 1 × PBS and incubated with second antibodies in blocking buffer at R/T for an hour. Slides were mounted with anti-fade solution with DAPI after PBS-wash for three times. For BrdU (5-bromo-2'-deoxyuridine) IF stainings, BrdU was applied to culture media to a final concentration of 3 μg/mL three hours before fixation. Post-fixed cells were treated with 2 mol/L HCl for 15 minutes before blocking. All immunofluorescent images comparing expression levels were acquired at equal exposure times. Immunoblotting assays were carried out according to standard procedures. The following primary antibodies were used: human SOX2 (IF, 1:200, AM2048A, Abgent, Suzhou, China), HMGA1 (IF/IHC, 1:800; WB, 1:10000, ab129153, Abcam, Cambridge, MA, USA), HMGA2 (IF/IHC, 1:400; WB, 1:3000, ab97276, Abcam), NESTIN (IHC, 1:200, SC-23927, Santa Cruz, CA, USA), CD133 (IHC, 1:200, 293C3, Miltenyi Biotec, Bergisch Gladbach, Germany), α-SMA/ACTA2 (IF, 1:200, a gift from Dr. Hongliang Li), Ki67 (IF/IHC, 1:400, #9449, Cell Signaling, Danvers, MA, USA), IBA-1 (IHC, 1:400, ab5076, Abcam), β-catenin (IHC, 1:200, 610153, BD Biosciences), CD44 (IHC, 1:200, 550392, BD Biosciences). CD146 (IHC, 1:100, 550315, BD Biosciences), CD248 (IHC, 1:100, 564994, BD Biosciences), PDGFRB (WB, 1:2000, sc-432, Santa cruz), PDGFRB/CD140b (IHC 1:100, 564994, BD Biosciences), CD34 (IHC, 1:100, 555821, BD Biosciences), FLAG (WB, 1:10000, F1804, Sigma-Aldrich). The following secondary antibodies were used: anti-rabbit, anti-rat, anti-goat and anti-mouse conjugated to Alexa Fluor 488, Alexa Fluor 555 and Alexa Fluor 647 (IF, 1:1000, Life Technologies), or to biotin (IHC, 1:200, Jackson ImmunoResearch, West Grove, PA, USA), or to HRP (WB, 1:5000, Jackson ImmunoResearch).
Matrigel angiogenesis assay
Suspended 1×10⁵ lentivirus-transduced GICs were mixed with 200 μL Matrigel Matrix at a volume ratio of 1:1 on ice. The mix was injected subcutaneously to the back of 6-week-old male Balb/c athymic nude mice to form plugs (n = 4 samples for each group). Fourteen days after injection, the Matrigel plugs were dissected out and freshly cryosectioned at the thickness of 5 μm. Sections were immunohistochemically stained with anti-PDGFRB and anti-NG2 antibodies.
Subcutaneous xenografting of U251 glioma cells and intracranial xenografting of GICs
All animal procedures were approved by the Animal Care and Ethical Committee of College of Life Sciences at Wuhan University. Xenografting experiments were carried out using 6-week-old male Balb/c athymic nude mice (HNSJA, Changsha, China). Mice were housed in a certified specific-pathogen-free (SPF) facility. U251 glioma cells were transfected with lentivirus (moi≈10) expressing scramble control or HMGA2 shRNAs 48 hours before inoculation. A total of 1×10⁶ suspended cells (in 1×PBS) were inoculated subcutaneously in each side of the anterior lateral thoracic wall. Tumor dimensions were measured every week and animals were sacrificed 4 weeks after inoculation. A total of 1×10⁵ lentivirus-transduced GICs (in culture medium) were injected intracranially using a stereotactic device (RWD) and a Hamilton syringe at a depth of 2.5 mm into the right striata of cerebral hemisphere [55]. Animals were 8 weeks post-surgery or when they showed significant signs of tumor formation (tremor, hunching or seizure). Xenografted nude mice were transcardiac perfused with 4% PFA and brains were dissected out. Fluorescent images of brains were captured using the Maestro In-vivo Imaging System (PerkinElmer, Waltham, MA, USA).
RNA-seq transcriptome analysis
TPC1115 glioma-initiating cells were transduced with shRNAs against HMGA1 or HMGA2 or both (moi≈10). Cells were collected 72 hours post-transfection and subjected to RNA extraction using Trizol solution (Life Technologies) and the integrity of RNAs was analyzed using Agilent Bioanalyzer 2100. Library construction and paired-end sequencing were performed in Berry Genomics using Hiseq 2500. Quality control, reads alignment and gene-expression analysis were also carried out in Berry Genomics. Clean reads were mapped to the human genome using the TopHat software. An R package, edgeR was applied for transcription quantification and differential expression analysis using a cutoff of P<0.05. Gene-ontology analysis was conducted using the Database for Annotation, Visualization and Integrated Discovery, a web-accessible program [56].
Luciferase reporter assay
Luciferase reporter assays were conducted in U87MG and 293T cells using the Dual-Luciferase Reporter Assay System (Promega, Madison, WI, USA) according to manufacturer’s manual with slight modifications. The promoter region of FOXM1 (-2019 to +57 relative to TSS), and PLAU (-1886 to +26 relative the TSS) were amplified from genomic DNA of human fetal brain using KOD polymerase (Toyobo, Osaka, Japan) and cloned into pGL3-Basic luciferase reporter vector and confirmed by sequencing. Cells were transfected using the calcium phosphate transfection protocol or Lipofectamine 3000 (Life Technologies). Luciferase activity was determined 36 hours post transfection, cells were lysed with the passive lysis buffer and read the GloMax multidectection system (Promega) according to the manufacturer’s instructions. Relative luciferase activity was determined by a ratio of firefly luciferase activity to control Renilla luciferase activity.
Real-time quantitative reverse transcription PCR (qRT-PCR)
Total RNAs (1-2 μg) were reverse-transcribed at 42°C using PrimerScript™ Reverse Transcriptase (Takara Bio, Shiga, Japan). Then iTaq™ Universal SYBR® Green Supermix (Bio-rad, Hercules, CA, USA) was employed to perform quantitative PCR on a CFX Connect™ Real-Time PCR Detection System (Bio-rad). Gene expressions were determined using the 2-ΔΔCt method, normalizing to housekeeping genes GAPDH or ACTB. Oligo sequences for qRT-PCR: GAPDH (forward: 5’-AAT CAA GTG GGG CGA TGC TG-3’, reverse: 5’-TGG TTC ACA CCC ATG ACG AA-3’); ACTIN (forward: 5’-CTC TTC CAG CCT TCC TTC CT-3’, reverse: 5’-AGC ACT GTG TTG GCG TAC AG-3’); HMGA1 (forward: 5’-ACT GGA GTC TCC TGT GGT GTG T-3’, reverse: 5’-AGT GCT ATT TCC CCT CCC TTC-3’); HMGA2 (forward: 5’-CAC TTC AGC CCA GGG ACA AC-3’, reverse: 5’-GCC TCT TGG CCG TTT TTC TC-3’); ACTA2 (forward: 5’-CAA TGA GCT TCG TGT TGC CC-3’, reverse: 5’-GCA AGG CAT AGC CCT CAT AGA-3’); SOX2 (forward: 5’-CAC AAC TCG GAG ATC AGC AA-3’, reverse: 5’-CGG GGC CGG TAT TTA TAA TC-3’); FOXM1 (forward: 5’-AGT AGT GGG CCC AAC AAA TTC AT-3’, reverse: 5’-CTT TTG GCA TCA TAG CTG GTT TG-3’); CYR61 (forward: 5’-GGT CAA AGT TAC CGG GCA GT-3’, reverse: 5’-GGA GGC ATC GAA TCC CAG C-3’); PLAU (forward: 5’-TGT GAA GCT GAT TTC CCA CCG-3’, reverse: 5’-GCC TTG GAG GGA ACA GAC GAG-3’).
Statistical analyses
Data were presented as the mean ± SD (standard deviation) unless otherwise indicated. Statistical significance was determined by unpaired Student’s t test, and a P value of less than 0.05 was considered statistically significant and marked as ‘ * ’; a P values less than 0.01 or 0.001 was marked as ‘ ** ’ and ‘ *** ’ respectively.
ACKNOWLEDGMENTS
We thank all members in Zhou lab for critical reading of the manuscript. We appreciate technical supports from Dr. Qin Shen at Tsinghua University, Drs. Zishu Pan, Hongliang Li and Wenhua Li at Wuhan University and Ms. Lin Song at Zhejiang University. We thank Dr. Xiaozhong Peng at PUMC for providing glioma cell lines.
CONFLICTS OF INTEREST
The authors have no conflicts of interest to disclose.
GRANT SUPPORT
This work was supported by grants from National Key Basic Research Program of China (No. 2012CB967002), the National Natural Science Foundation of China (No. 31471361 and No. 31171314), the Fundamental Research Funds for the Central Universities (2042014kf0213) and New Century Excellent Talents in University (NCET-12-0421) to Yan Zhou; and grants from Science and Technology Commission of Shanghai Municipality (15JC1400202) and Key Project of Shanghai Health and Family Planning Commission (201540376) to Liang Gao.
REFERENCES
1. Goodenberger ML, Jenkins RB. Genetics of adult glioma. Cancer genetics. 2012; 205:613-621.
2. Louis DN, Ohgaki H, Wiestler OD, Cavenee WK, Burger PC, Jouvet A, Scheithauer BW, Kleihues P. The 2007 WHO classification of tumours of the central nervous system. Acta neuropathologica. 2007; 114:97-109.
3. Wen PY, Kesari S. Malignant gliomas in adults. The New England journal of medicine. 2008; 359:492-507.
4. Demuth T, Berens ME. Molecular mechanisms of glioma cell migration and invasion. Journal of neuro-oncology. 2004; 70:217-228.
5. Jain RK, di Tomaso E, Duda DG, Loeffler JS, Sorensen AG, Batchelor TT. Angiogenesis in brain tumours. Nature reviews Neuroscience. 2007; 8:610-622.
6. Verhaak RG, Hoadley KA, Purdom E, Wang V, Qi Y, Wilkerson MD, Miller CR, Ding L, Golub T, Mesirov JP, Alexe G, Lawrence M, O'Kelly M, Tamayo P, Weir BA, Gabriel S, et al. Integrated genomic analysis identifies clinically relevant subtypes of glioblastoma characterized by abnormalities in PDGFRA, IDH1, EGFR, and NF1. Cancer cell. 2010; 17:98-110.
7. Phillips HS, Kharbanda S, Chen R, Forrest WF, Soriano RH, Wu TD, Misra A, Nigro JM, Colman H, Soroceanu L, Williams PM, Modrusan Z, Feuerstein BG, Aldape K. Molecular subclasses of high-grade glioma predict prognosis, delineate a pattern of disease progression, and resemble stages in neurogenesis. Cancer cell. 2006; 9:157-173.
8. Sturm D, Witt H, Hovestadt V, Khuong-Quang DA, Jones DT, Konermann C, Pfaff E, Tonjes M, Sill M, Bender S, Kool M, Zapatka M, Becker N, Zucknick M, Hielscher T, Liu XY, et al. Hotspot mutations in H3F3A and IDH1 define distinct epigenetic and biological subgroups of glioblastoma. Cancer cell. 2012; 22:425-437.
9. Galli R, Binda E, Orfanelli U, Cipelletti B, Gritti A, De Vitis S, Fiocco R, Foroni C, Dimeco F, Vescovi A. Isolation and characterization of tumorigenic, stem-like neural precursors from human glioblastoma. Cancer research. 2004; 64:7011-7021.
10. Singh SK, Hawkins C, Clarke ID, Squire JA, Bayani J, Hide T, Henkelman RM, Cusimano MD, Dirks PB. Identification of human brain tumour initiating cells. Nature. 2004; 432:396-401.
11. Bleau AM, Hambardzumyan D, Ozawa T, Fomchenko EI, Huse JT, Brennan CW, Holland EC. PTEN/PI3K/Akt pathway regulates the side population phenotype and ABCG2 activity in glioma tumor stem-like cells. Cell stem cell. 2009; 4:226-235.
12. Mao P, Joshi K, Li J, Kim SH, Li P, Santana-Santos L, Luthra S, Chandran UR, Benos PV, Smith L, Wang M, Hu B, Cheng SY, Sobol RW, Nakano I. Mesenchymal glioma stem cells are maintained by activated glycolytic metabolism involving aldehyde dehydrogenase 1A3. Proceedings of the National Academy of Sciences of the United States of America. 2013; 110:8644-8649.
13. Carro MS, Lim WK, Alvarez MJ, Bollo RJ, Zhao X, Snyder EY, Sulman EP, Anne SL, Doetsch F, Colman H, Lasorella A, Aldape K, Califano A, Iavarone A. The transcriptional network for mesenchymal transformation of brain tumours. Nature. 2010; 463:318-325.
14. Bhat KP, Salazar KL, Balasubramaniyan V, Wani K, Heathcock L, Hollingsworth F, James JD, Gumin J, Diefes KL, Kim SH, Turski A, Azodi Y, Yang Y, Doucette T, Colman H, Sulman EP, et al. The transcriptional coactivator TAZ regulates mesenchymal differentiation in malignant glioma. Genes & development. 2011; 25:2594-2609.
15. Bhat KP, Balasubramaniyan V, Vaillant B, Ezhilarasan R, Hummelink K, Hollingsworth F, Wani K, Heathcock L, James JD, Goodman LD, Conroy S, Long L, Lelic N, Wang S, Gumin J, Raj D, et al. Mesenchymal differentiation mediated by NF-kappaB promotes radiation resistance in glioblastoma. Cancer cell. 2013; 24:331-346.
16. Calabrese C, Poppleton H, Kocak M, Hogg TL, Fuller C, Hamner B, Oh EY, Gaber MW, Finklestein D, Allen M, Frank A, Bayazitov IT, Zakharenko SS, Gajjar A, Davidoff A, Gilbertson RJ. A perivascular niche for brain tumor stem cells. Cancer cell. 2007; 11:69-82.
17. Winkler EA, Bell RD, Zlokovic BV. Central nervous system pericytes in health and disease. Nature neuroscience. 2011; 14:1398-1405.
18. Scully S, Francescone R, Faibish M, Bentley B, Taylor SL, Oh D, Schapiro R, Moral L, Yan W, Shao R. Transdifferentiation of glioblastoma stem-like cells into mural cells drives vasculogenic mimicry in glioblastomas. The Journal of neuroscience. 2012; 32:12950-12960.
19. Wang R, Chadalavada K, Wilshire J, Kowalik U, Hovinga KE, Geber A, Fligelman B, Leversha M, Brennan C, Tabar V. Glioblastoma stem-like cells give rise to tumour endothelium. Nature. 2010; 468:829-833.
20. Ricci-Vitiani L, Pallini R, Biffoni M, Todaro M, Invernici G, Cenci T, Maira G, Parati EA, Stassi G, Larocca LM, De Maria R. Tumour vascularization via endothelial differentiation of glioblastoma stem-like cells. Nature. 2010; 468:824-828.
21. Cheng L, Huang Z, Zhou W, Wu Q, Donnola S, Liu JK, Fang X, Sloan AE, Mao Y, Lathia JD, Min W, McLendon RE, Rich JN, Bao S. Glioblastoma stem cells generate vascular pericytes to support vessel function and tumor growth. Cell. 2013; 153:139-152.
22. Reeves R. Molecular biology of HMGA proteins: hubs of nuclear function. Gene. 2001; 277:63-81.
23. Fusco A, Fedele M. Roles of HMGA proteins in cancer. Nature reviews Cancer. 2007; 7:899-910.
24. Kishi Y, Fujii Y, Hirabayashi Y, Gotoh Y. HMGA regulates the global chromatin state and neurogenic potential in neocortical precursor cells. Nature neuroscience. 2012; 15:1127-1133.
25. Zhou X, Benson KF, Ashar HR, Chada K. Mutation responsible for the mouse pygmy phenotype in the developmentally regulated factor HMGI-C. Nature. 1995; 376:771-774.
26. Schoenmakers EF, Wanschura S, Mols R, Bullerdiek J, Van den Berghe H, Van de Ven WJ. Recurrent rearrangements in the high mobility group protein gene, HMGI-C, in benign mesenchymal tumours. Nature genetics. 1995; 10:436-444.
27. Akai T, Ueda Y, Sasagawa Y, Hamada T, Date T, Katsuda S, Iizuka H, Okada Y, Chada K. High mobility group I-C protein in astrocytoma and glioblastoma. Pathology, research and practice. 2004; 200:619-624.
28. Hirning-Folz U, Wilda M, Rippe V, Bullerdiek J, Hameister H. The expression pattern of the Hmgic gene during development. Genes, chromosomes & cancer. 1998; 23:350-357.
29. Zheng H, Ying H, Yan H, Kimmelman AC, Hiller DJ, Chen AJ, Perry SR, Tonon G, Chu GC, Ding Z, Stommel JM, Dunn KL, Wiedemeyer R, You MJ, Brennan C, Wang YA, et al. p53 and Pten control neural and glioma stem/progenitor cell renewal and differentiation. Nature. 2008; 455:1129-1133.
30. Zhu Y, Guignard F, Zhao D, Liu L, Burns DK, Mason RP, Messing A, Parada LF. Early inactivation of p53 tumor suppressor gene cooperating with NF1 loss induces malignant astrocytoma. Cancer cell. 2005; 8:119-130.
31. Zhu Z, Khan MA, Weiler M, Blaes J, Jestaedt L, Geibert M, Zou P, Gronych J, Bernhardt O, Korshunov A, Bugner V, Lichter P, Radlwimmer B, Heiland S, Bendszus M, Wick W, et al. Targeting Self-Renewal in High-Grade Brain Tumors Leads to Loss of Brain Tumor Stem Cells and Prolonged Survival. Cell stem cell. 2014; 15:185-198.
32. Cattaruzzi G, Altamura S, Tessari MA, Rustighi A, Giancotti V, Pucillo C, Manfioletti G. The second AT-hook of the architectural transcription factor HMGA2 is determinant for nuclear localization and function. Nucleic acids research. 2007; 35:1751-1760.
33. Pietras A, Katz AM, Ekstrom EJ, Wee B, Halliday JJ, Pitter KL, Werbeck JL, Amankulor NM, Huse JT, Holland EC. Osteopontin-CD44 signaling in the glioma perivascular niche enhances cancer stem cell phenotypes and promotes aggressive tumor growth. Cell stem cell. 2014; 14:357-369.
34. Yan W, Zhang W, You G, Zhang J, Han L, Bao Z, Wang Y, Liu Y, Jiang C, Kang C, You Y, Jiang T. Molecular classification of gliomas based on whole genome gene expression: a systematic report of 225 samples from the Chinese Glioma Cooperative Group. Neuro-oncology. 2012; 14:1432-1440.
35. Chiou GY, Chien CS, Wang ML, Chen MT, Yang YP, Yu YL, Chien Y, Chang YC, Shen CC, Chio CC, Lu KH, Ma HI, Chen KH, Liu DM, Miller SA, Chen YW, et al. Epigenetic regulation of the miR142-3p/interleukin-6 circuit in glioblastoma. Molecular cell. 2013; 52:693-706.
36. Thuault S, Valcourt U, Petersen M, Manfioletti G, Heldin CH, Moustakas A. Transforming growth factor-beta employs HMGA2 to elicit epithelial-mesenchymal transition. The Journal of cell biology. 2006; 174:175-183.
37. Dai B, Kang SH, Gong W, Liu M, Aldape KD, Sawaya R, Huang S. Aberrant FoxM1B expression increases matrix metalloproteinase-2 transcription and enhances the invasion of glioma cells. Oncogene. 2007; 26:6212-6219.
38. Zhang Y, Zhang N, Dai B, Liu M, Sawaya R, Xie K, Huang S. FoxM1B transcriptionally regulates vascular endothelial growth factor expression and promotes the angiogenesis and growth of glioma cells. Cancer research. 2008; 68:8733-8742.
39. Cheng SX, Tu Y, Zhang S. FoxM1 promotes glioma cells progression by up-regulating Anxa1 expression. PloS one. 2013; 8:e72376.
40. Xie Q, Wu Q, Mack SC, Yang K, Kim L, Hubert CG, Flavahan WA, Chu C, Bao S, Rich JN. CDC20 maintains tumor initiating cells. Oncotarget. 2015; 6:13241-13254. doi: 10.18632/oncotarget.3676.
41. Xue J, Zhou A, Tan C, Wu Y, Lee HT, Li W, Xie K, Huang S. Forkhead Box M1 Is Essential for Nuclear Localization of Glioma-associated Oncogene Homolog 1 in Glioblastoma Multiforme Cells by Promoting Importin-7 Expression. The Journal of biological chemistry. 2015; 290:18662-18670.
42. Zhang N, Wei P, Gong A, Chiu WT, Lee HT, Colman H, Huang H, Xue J, Liu M, Wang Y, Sawaya R, Xie K, Yung WK, Medema RH, He X, Huang S. FoxM1 promotes beta-catenin nuclear localization and controls Wnt target-gene expression and glioma tumorigenesis. Cancer cell. 2011; 20:427-442.
43. Bernhart E, Damm S, Wintersperger A, DeVaney T, Zimmer A, Raynham T, Ireson C, Sattler W. Protein kinase D2 regulates migration and invasion of U87MG glioblastoma cells in vitro. Experimental cell research. 2013; 319:2037-2048.
44. Liu M, Dai B, Kang SH, Ban K, Huang FJ, Lang FF, Aldape KD, Xie TX, Pelloski CE, Xie K, Sawaya R, Huang S. FoxM1B is overexpressed in human glioblastomas and critically regulates the tumorigenicity of glioma cells. Cancer research. 2006; 66:3593-3602.
45. Nishino J, Kim I, Chada K, Morrison SJ. Hmga2 promotes neural stem cell self-renewal in young but not old mice by reducing p16Ink4a and p19Arf Expression. Cell. 2008; 135:227-239.
46. Vallone D, Battista S, Pierantoni GM, Fedele M, Casalino L, Santoro M, Viglietto G, Fusco A, Verde P. Neoplastic transformation of rat thyroid cells requires the junB and fra-1 gene induction which is dependent on the HMGI-C gene product. The EMBO journal. 1997; 16:5310-5321.
47. Wang X, Kiyokawa H, Dennewitz MB, Costa RH. The Forkhead Box m1b transcription factor is essential for hepatocyte DNA replication and mitosis during mouse liver regeneration. Proceedings of the National Academy of Sciences of the United States of America. 2002; 99:16881-16886.
48. Laoukili J, Kooistra MR, Bras A, Kauw J, Kerkhoven RM, Morrison A, Clevers H, Medema RH. FoxM1 is required for execution of the mitotic programme and chromosome stability. Nature cell biology. 2005; 7:126-136.
49. Wang Z, Banerjee S, Kong D, Li Y, Sarkar FH. Down-regulation of Forkhead Box M1 transcription factor leads to the inhibition of invasion and angiogenesis of pancreatic cancer cells. Cancer research. 2007; 67:8293-8300.
50. Blasi F, Carmeliet P. uPAR: a versatile signalling orchestrator. Nat Rev Mol Cell Biol. 2002; 3:932-943.
51. Li D, Wei P, Peng Z, Huang C, Tang H, Jia Z, Cui J, Le X, Huang S, Xie K. The critical role of dysregulated FOXM1-PLAUR signaling in human colon cancer progression and metastasis. Clinical cancer research. 2013; 19:62-72.
52. Crisan M, Yap S, Casteilla L, Chen CW, Corselli M, Park TS, Andriolo G, Sun B, Zheng B, Zhang L, Norotte C, Teng PN, Traas J, Schugar R, Deasy BM, Badylak S, et al. A perivascular origin for mesenchymal stem cells in multiple human organs. Cell stem cell. 2008; 3:301-313.
53. Feng J, Mantesso A, De Bari C, Nishiyama A, Sharpe PT. Dual origin of mesenchymal stem cells contributing to organ growth and repair. Proceedings of the National Academy of Sciences of the United States of America. 2011; 108:6503-6508.
54. Hu Y, Smyth GK. ELDA: extreme limiting dilution analysis for comparing depleted and enriched populations in stem cell and other assays. J Immunol Methods. 2009; 347:70-78.
55. Guryanova OA, Wu Q, Cheng L, Lathia JD, Huang Z, Yang J, MacSwords J, Eyler CE, McLendon RE, Heddleston JM, Shou W, Hambardzumyan D, Lee J, Hjelmeland AB, Sloan AE, Bredel M, et al. Nonreceptor tyrosine kinase BMX maintains self-renewal and tumorigenic potential of glioblastoma stem cells by activating STAT3. Cancer cell. 2011; 19:498-511.
56. Huang da W, Sherman BT, Lempicki RA. Systematic and integrative analysis of large gene lists using DAVID bioinformatics resources. Nature protocols. 2009; 4:44-57.