
INTRODUCTION
Epithelial ovarian cancer (EOC) is the fifth leading cause of cancer-related death among women in the United States, with approximately 21,290 new patients and 14,180 deaths in 2015 [1]. Serous ovarian cancer (SOC) is the most common histological subtype of EOC, accounting for 87% of advanced stage cases and 78% of total cases [2]. To date, the gold standard treatment for ovarian cancer involves cytoreductive surgery followed by platinum- and paclitaxel-based chemotherapy. Although a substantial proportion of individuals achieve a complete clinical response [3, 4], 50-75% of the patients suffer relapse within 18 months after first-line treatment [3], which means that SOC are scarcely ever curable, and generally have short-term progression-free survival [5]. In brief, recurrence is the first critical clinical episode that has a significant impact on prognosis. Recurrence under the premise of optimal debulking reflects the essence of tumor heterogeneity more than external factors. Nevertheless, with only clinical indicators, such as patient age, tumor stage, tumor grade and so on, it is difficult to predict which SOC patients will develop recurrence after optimal debulking surgery and standard first-line chemotherapy.
The development of high-throughput techniques, such as microarray and sequencing, will be helpful to gain insight into the molecular profiles of tumor cells in the context of recurrence. For the past few years, several studies have applied gene expression profiling to ovarian cancer [6–11]. However, only a small number of genes were shared among these gene profiles identified in separate studies [12]. No robust prediction models on recurrence or overall survival have been established. It is urgent to establish novel and pragmatic gene signatures robustly applicable in multiple datasets with a large number of cases.
In this study, we strived to excavate novel gene signatures for recurrence in patients with SOC under the premise of optimal debulking surgery. We discovered 2 candidate gene markers, KCNN4 and S100A14, relevant for recurrence from 7 publicly available microarray datasets. Recurrence forecasting models based on the 2 genes performed well. Consistent with our study, prior studies demonstrated that S100A14 was overexpressed in SOC at both mRNA and protein levels [13]. To our knowledge, there is little valuable information on the role of KCNN4 in ovarian cancer or other cancers [14, 15]. This is the first report indicating that the KCNN4 gene acts as an independent predictor for recurrence in SOC patients and also may be a very attractive therapeutic target. Also, the KCNN4-UBA52-KLF4-S100A14 axis we constructed may be the potential regulatory pathway between KCNN4 and S100A14 proteins, representing a novel regulatory mode impacting the early prognosis of SOC. Finally, we examined the protein expressions of KCNN4 and S100A14 in an independent clinical cohort of 127 SOC patients, which also supported the conclusion drawn from these 7 public datasets that these genes could be independent prognostic factors for recurrence in optimally debulked SOC patients.
RESULTS
Dataset characteristics and the identification of genes associated with an increased incidence of recurrence
After rigorous screening, 7 datasets (TCGA [16], TCGA.RNASeqV2 [16], GSE17260 [17], GSE26193 [18], GSE30161 [19], GSE49997 [20], and GSE9891 [21]) were obtained from the curatedOvarianData package according to the screening criteria detailed in Methods. In these 7 datasets, 305, 156, 37, 77, 17, 120, and 126 samples, respectively, met the inclusion criteria for our analysis. The general characteristics of the 7 datasets are listed in Table 1. In these datasets, patients who received optimal debulking surgery and relapsed after more than 90 days from the termination of first-line treatments were classified into two groups according to their recurrence status (recurrence versus no recurrence). The top 2000 genes were selected with a signal-to-noise ratio (SNR) criteria for the 7 datasets, and the common genes obtained via intersection were exactly KCNN4 and S100A14.
Table 1: general information of involved 7 public datasets
Datasets |
Platform |
Sample number |
Screened Samples* |
Age (year)# median (range) |
Recurrence status# |
Days to recurrence# median (range) |
Vital status# |
Days to death# Median (range) |
||
|---|---|---|---|---|---|---|---|---|---|---|
no recurrence |
recurrence |
deceased |
living |
|||||||
TCGA |
hthgu133a |
481 |
305 |
57 (30 - 84) |
131 |
174 |
453 (92 - 3378) |
156 |
149 |
981 (92 - 4623) |
TCGA RNASeq |
RNASeqV2 |
242 |
156 |
56 (34 - 84) |
68 |
88 |
423 (92 - 2648) |
83 |
73 |
913 (92 - 4623) |
GSE17260 |
hgug4112a |
84 |
37 |
- |
19 |
18 |
690 (120 - 2250) |
10 |
27 |
990 (270 - 2250) |
GSE26193 |
hgu133plus2 |
79 |
77 |
- |
16 |
61 |
595 (121 – 7386) |
58 |
19 |
1136 (194 - 7386) |
GSE30161 |
hgu133plus2 |
45 |
17 |
55 (47 - 75) |
3 |
14 |
566 (162 - 4208) |
9 |
8 |
1846 (377 - 4208) |
GSE49997 |
ABI |
171 |
120 |
56 (27 - 85) |
51 |
69 |
533 (122 - 1461) |
30 |
90 |
776 (122 - 1491) |
GSE9891 |
hgu133plus2 |
239 |
126 |
59.5 (39 - 80) |
42 |
84 |
540 (120 - 3060) |
50 |
76 |
900 (180 - 6420) |
* Samples screened according to the criteria mentioned in the method section: optimal debulking and days_to_tumor_recurrence > 90d.
# summarized according to screened samples.
Correlation analysis of KCNN4 and S100A14
Through linear regression analysis, we preliminarily explored the linear relationship between the expression of KCNN4 and S100A14 in SOC, and the mRNA expressions of KCNN4 and S100A14 were significantly positively correlated in 6 datasets (p<0.05) except in the GSE26193 dataset (p=0.7694) (Figure 1A). The expression distributions of KCNN4 and S100A14 are shown based on recurrence status with dot and density plots in the 7 datasets (Supplementary Figure S1). Nearly half (42.9% (6/14)) of these expression distributions showed significant differences between the recurrence statuses (p=0.00473~0.4195). Furthermore, for detecting possible regulation mechanisms associated with the KCNN4 and S100A14 expression values, we measured the correlations of the mRNA expression values of KCNN4 and S100A14 with their respective copy number alterations (CNA) as well as DNA methylation (Figure 1B). The copy number aberrations had 5 distinct statuses: homozygous deletion (-2), hemizygous deletion (-1), neutral (no change, 0), gain (+1), and high level amplification (+2). CNA status was significantly positively correlated with mRNA expression values of KCNN4 (p=1.918e-05). Moreover, we found a significant expression difference between the hemizygous deletion (-1) and neutral (0) (p=0.00003) statuses, as well as between the hemizygous deletion (-1) and gain (+1) (p=0.0024) statuses. However, no statistical significance was observed between the CNA status and the mRNA expression values of S100A14 (p=0.4349). Both KCNN4 and S100A14 had significant negative correlations between their mRNA expression values and DNA methylation values (p=0.0179 and 2.787e-13, respectively).
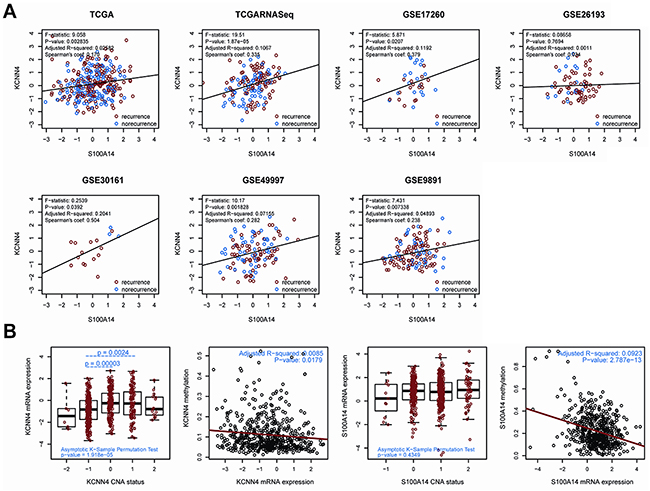
Figure 1: A. The correlation of gene expression between KCNN4 and S100A14 in 7 public datasets. In each dataset, recurrent samples and norecurrent samples were marked in red and blue, respectively. Some statistical results are also listed. The black solid line represents the linear regression; B. the correlation of the expression profiles of KCNN4 and S100A14 with CNA status as well as methylation values. For CNA status, -2 = homozygous deletion, -1 = hemizygous deletion, 0 = neutral/no change, 1 = gain, and 2 = high level amplification. The total significance was estimated from the null distribution constructed by the asymptotic K-sample permutation test. If significant, pairwise comparisons were then performed via TukeyHSD test, and the p values were adjusted with the BH method. The p values are also labeled. For methylation status, the red lines represent the linear regression between the expression values and methylation values.
KCNN4 and S100A14 act as independent predictors of recurrence
We determined the expression cut-off points of KCNN4 and S100A14 in The Cancer Genome Atlas (TCGA) dataset as described in Methods, and their expression levels were classified as “low”(-) and “high”(+) accordingly. The KCNN4 expression status, S100A14 expression status, and their crossed combination status were significantly correlated with recurrence status in 7 datasets, and their odds ratios (ORs), 95% confidence indexes (CI), and p values are listed (Table 2). Higher mRNA expressions of KCNN4 or S100A14 were significantly correlated with higher recurrence rates of optimal debulked SOC patients in all datasets. Nevertheless, more significant expression difference were obtained by combining their expression statuses to form 4 crossed groups, namely, KCNN4(-)S100A14(-), KCNN4(+)S100A14(-), KCNN4(-)S100A14(+), and KCNN4(+)S100A14(+). The expression difference according to the 4 crossed groups seemed to be more significant than those of 2 combined groups in which KCNN4(-)S100A14(-) was compared with the other 3 statuses. Furthermore, statistical analysis of the relationships of the various clinical factors and their mRNA expression levels/statuses was systematically performed for the 7 datasets, and there were no obviously significant relationships among them except for recurrence status (Supplementary Table S1). According to our statistical outcomes, the KCNN4 expression status were significantly correlated with recurrence in 5 datasets (TCGA, TCGA.RNASeqV2, GSE17260, GES26193 and GSE30161), and the KCNN4 expression values were significantly correlated with recurrence in 2 datasets (TCGA.RNASeqV2 and GSE30161). Both of the S100A14 expression status and the S100A14 expression values were correlated with recurrence in the same 4 datasets (TCGA, TCGA.RNASeqV2, GSE26193, and GSE30161). As shown in Figure 2A-2C, the Kaplan-Meier curves and log-rank tests emphasized the classification abilities on recurrence of the univariate expression statuses and combined expression status. It is noteworthy that, because they were initially screened according to differential expression on recurrence status, we could classify overall survival based on them in some datasets, but the results were not as robust as observed upon recurrence (Supplementary Figure S2). Moreover, according to the univariate and multivariate Cox regression analyses, the S100A14 and KCNN4 mRNA expression levels tended to be independently correlated with recurrence in the majority of datasets, while the KCNN4 mRNA expression level might serve as an independent prognostic factor for overall survival in the TCGA and GSE17260 datasets, as well as S100A14 expression levels in the GSE26193 and GSE49997 datasets (Supplementary Table S2).These results suggest that there were significant expression differences in early prognosis rather than late prognosis between the mRNA expression statuses of KCNN4 and S100A14. Thus, these genes could be employed as recurrence predictors and were not suitable for the prediction of overall survival. Prediction models were built in the TCGA dataset on the basis of KCNN4 and S100A14 mRNA expression values, as well as their combination, using linear kernel SVM (svmLinear) to explore their prediction power for recurrence (Figure 2D). The area under ROC curve(AUC) and 95% confidence intervals (CI) of these 3 models showed good performance in the other 6 datasets (the highest AUC: 0.9524, 95%CI: 0.848-1; the lowest AUC: 0.5442, 95%CI: 0.4364-0.652). Additional 9 models were built by 3 other machine learning algorithms: random forest (rf), radial kernel SVM (svmRadial), and the artificial neural network (nnet), and the AUC and 95%CIs of these models are also presented (Supplementary Figure S3). Basically, these models had prediction abilities consistent with the 3 models built by linear SVM, which means that the mRNA expression levels of KCNN4 and S100A14 had a stable prediction power for recurrence, regardless of which machine learning algorithm was adopted. From the above results, we can conclude that the mRNA expressions of KCNN4 and S100A14 are independent prognostic indicators for recurrence in optimal debulked SOC patients.
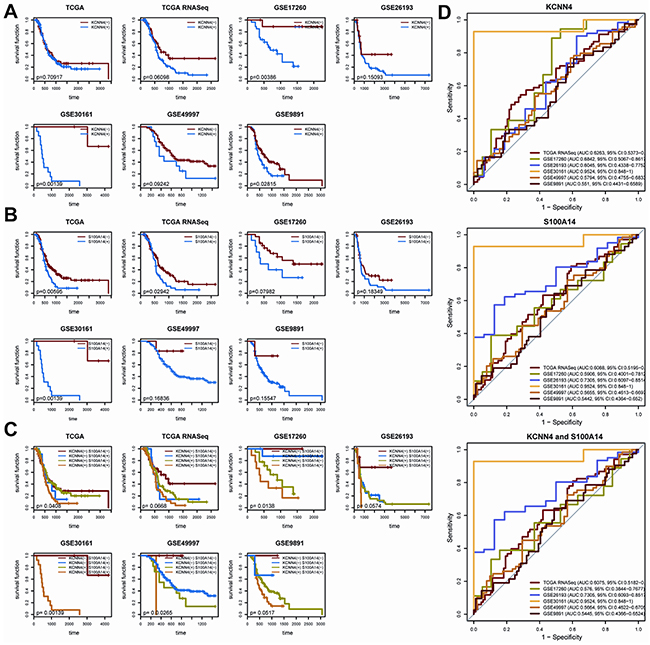
Figure 2: A. The KM plot of recurrence with different KCNN4 expression states. (-) means lower expression and (+) means higher expression; B. The KM plot of recurrence with different S100A14 expression states; C. The KM plot of recurrence with combined KCNN4 and S100A14 states; D. The prediction power of the recurrence prediction model built with TCGA dataset in the other 6 datasets. The model was built with linear kernel SVM via 5-repeats of 10-fold cross validation, coupled with internal parameter selection procedures. For each dataset, the AUCs and 95%CIs are also listed.
Table 2: Expression difference of KCNN4 and S100A14 on SOC recurrence
Dataset |
KCNN4 |
S100A14 |
KCNN4+S100A14 |
|||||||
|---|---|---|---|---|---|---|---|---|---|---|
OR |
95%CI |
P |
OR |
95%CI |
P |
OR |
95%CI |
Pa |
Pb |
|
TCGA |
1.79 |
1.08 – 2.98 |
0.0206 |
2.12 |
1.13 – 4.13 |
0.0146 |
1.87 |
1.11 – 3.18 |
0.0161 |
0.0117 |
TCGA RNASeq |
3.18 |
1.52 – 6.79 |
0.0011 |
2.91 |
1.33 - 6.68 |
0.0051 |
4.13 |
1.87 - 9.51 |
0.0001 |
0.0005 |
GSE17260 |
14.23 |
1.58 – 705.97 |
0.0078 |
3.28 |
0.59 – 24.07 |
0.151 |
3.28 |
0.59 – 24.07 |
0.151 |
0.0165 |
GSE26193 |
5.34 |
1.17 – 24.84 |
0.0142 |
9.18 |
1.86 – 90.23 |
0.0016 |
1.53 |
0.44 – 5.41 |
0.5704 |
0.0004 |
GSE30161 |
Inf |
1.98 – Inf |
0.0059 |
Inf |
1.98 – Inf |
0.0059 |
Inf |
1.98 – Inf |
0.0059 |
0.0059 |
GSE49997 |
4.11 |
0.82 – 40.35 |
0.0691 |
7.28 |
0.78 – 353.95 |
0.0821 |
Inf |
0.02 - Inf |
1 |
0.0068 |
GSE9891 |
1.82 |
0.76 – 4.58 |
0.1689 |
6.28 |
0.49 – 338.42 |
0.1075 |
2.06 |
0.85 – 5.35 |
0.111 |
0.0878 |
a. This comparison were done between KCNN4(-)S100A14(-) and KCNN4(+)S100A14(+)/KCNN(+)S100A14(-)/KCNN(-)S100A14(+)
b. Comparisons among 4 groups such as KCNN4(-)S100A14(-), KCNN4(+)S100A14(+), KCNN(+)S100A14(-) and KCNN(-)S100A14(+)
A KCNN4- and S100A14-centered interaction subnetwork
To further interpret the interaction relationship between KCNN4 and S100A14, we built the minimal KCNN4 and S100A14-centered undirected interaction subnetwork from the high quality STRING protein interaction database (combined score ≥ 600) with k nearest neighbors (k=1) (Figure 3A). The shortest path between KCNN4 and S100A14, namely, the KCNN4-UBA52-KLF4-S100A14 axis, was determined. We first speculated the most probable regulation directions using Bayesian network inference based on the hill-climbing algorithm and evaluated their performance with Akaike information criterion (AIC). Intriguingly, the regulatory directions were also almost consistent in the 7 datasets, and S100A14 was always regulated by KCNN4 (Figure 3B). We then measured the pairwise expression correlations of these 4 genes in the 7 datasets (Figure 3C; Supplementary Figure S4), and some consistent negative/positive correlations were identified. Combining the above results, the final hypothetical regulation mode of this axis is shown as well as the relevant proofs (Figure 3D). Because the pairwise interactions were derived from convincing benchwork results and we had confirmed the consistent positive correlations of KCNN4 and S100A14 in all 7 datasets, we speculated that this axis might represent the most direct regulatory pathway between KCNN4 and S100A14 in SOC. In detail, in the axis, the regulation directions tended to flow from KCNN4 to S100A14. The directions between KCNN4 and UBA52, and between UBA52 and KLF4, could not be determined by Bayesian network inference and had no solid support from other traceable resources. The regulation direction between KLF4 and S100A14 was also demonstrated in breast cancer [22], as was the inference from our Bayesian network. The promotion of S100A14 on KCNN4 and UBA52 stimulation, as well as the inhibition of KLF4 by UBA52, was supported by Bayesian network inference. The stimulation and inhibition causality were confirmed by pairwise expression correlations throughout all 7 datasets. Therefore, with the support of Bayesian network inference, pairwise expression correlations, and previous research conclusions, we gained sufficient confidence about the reliability of the hypothetical regulation mode of this axis. Furthermore, we detected the KCNN4 and S100A14 centered subnetwork in the community with a fast greedy algorithm [23], and 4 distinct communities were detected and colored accordingly. We found that these 4 axis genes belonged to 3 communities, that KCNN4, UBA52 and S100A14 were hub genes in their own communities, and that KLF4 was a key connector between UBA25 and S100A14. GO and pathway enrichment analysis of the minimal subnetwork showed that it was primarily involved in potassium ion transport (Figure 3E).
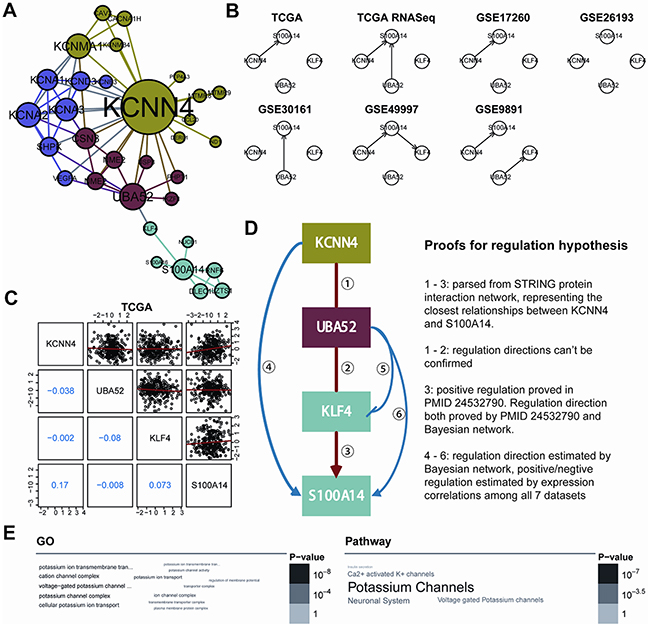
Figure 3: A. The KCNN4 and S100A14 centered interaction subnetwork. The minimum network connected KCNN4 and S100A14 constructed from a high quality STRING database (combined score >= 600) when restricted to 1-NN of KCNN4 and S100A14. Four communities were detected using fast greedy searching and are colored differently. The node sizes are proportional to the degrees of each gene; B. The regulation frameworks of the KCNN4-UBA52-KLF4-S100A14 axis determined by the Bayesian network based on hill-climbing scoring. The arrows are the regulation directions; C. Pairwise correlations of expression profiles of 4 genes in the TCGA dataset. The upper triangle showed the paired expression in all TCGA samples and the red lines represent the linear regression results. The lower triangle illustrated the pairwise Pearson’s correlation coefficients; D. Hypothesized regulation modes of the KCNN4-UBA52-KLF4-S100A14 axis. The frames were colored according to the colors of the communities to which they belong. The arrows mean stimulation and the blocked arrow means inhibition. To the right is the proof for the regulation hypothesis; E. Word cloud representation of enriched GO and pathway terms on genes in the subnetwork (adjusted p<0.05). Their significance are illustrated with different font size and gray scale.
KCNN4 and S100A14 protein expression in SOC assessed by IHC
We examined the protein expression of KCNN4 and S100A14 in an independent SOC cohort using immunohistochemistry (IHC) staining. KCNN4-positive staining was predominantly localized in the nucleus and cytoplasm of cancer cells. S100A14-positive staining was mainly localized to the cytoplasm and cytomembrane in cancer cells. Representative IHC KCNN4 and S100A14 staining shapes are shown in Figure 4. The main clinicopathologic parameters of 127 SOC patients in our independent cohort underwent optimal debulking surgery, and their relationships with the IHC expression of KCNN4 and S100A14 are shown (Table 3). Significant differences in both the KCNN4 and S100A14 IHC expressions were found between recurrent cases and norecurrent cases (p=0.02301 and p=0.002346, respectively). As for the recurrence distribution between the KCNN4 and S100A14 combined groups, higher significance was achieved (p=3.607e-06). Additionally, high KCNN4 IHC expression was associated with FIGO stage (p=0.002668), and high S100A14 IHC expression was significantly associated with positive lymph node metastasis (p=0.02569). According to the univariate and multivariate Cox regression analyses, both KCNN4 and S100A14 IHC expressions were correlated with recurrence, so KCNN4 and S100A14 could also be established as independent predictors for SOC recurrence within our cohort (Table 4). Kaplan-Meier curves were also plotted, and log-rank tests were performed to compare the recurrence predictions of singular KCNN4 and S100A14 IHC expression in our cohort. In all situations, there were significant differences among the different IHC expression levels, and their combined IHC groups seemed to have better prediction abilities than the single genes, as illustrated in the above public SOC datasets (KCNN4: p=0.02016; S100A14: p=0.03589; KCNN4 and S100A14: p=0.00436) (Figure 5).
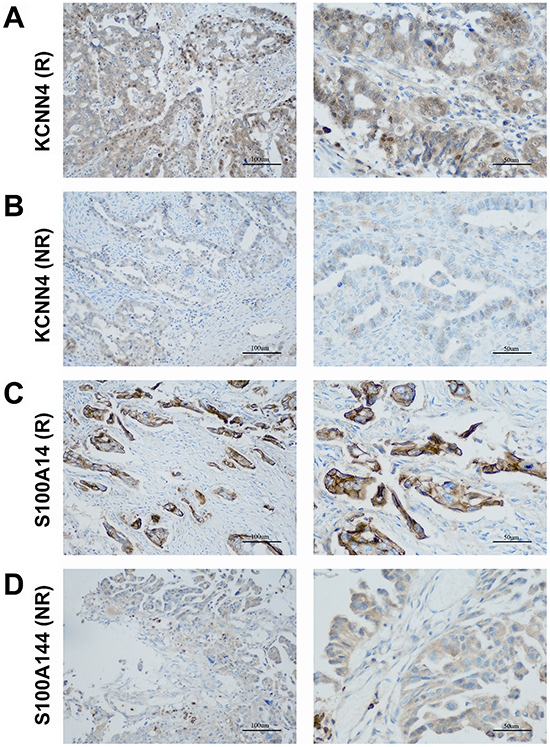
Figure 4: Representative patterns of KCNN4 and S100A14 IHC staining in the SOC cohort. A. KCNN4 staining in SOCs with recurrence (R); B. KCNN4 staining in SOCs with norecurrence (NR); C. S100A14 staining in SOCs with recurrence (R); D. S100A14 staining in SOCs with norecurrence (NR). Original magnification: ×200 and ×400. Scale bars, 100 μm, 50 μm.
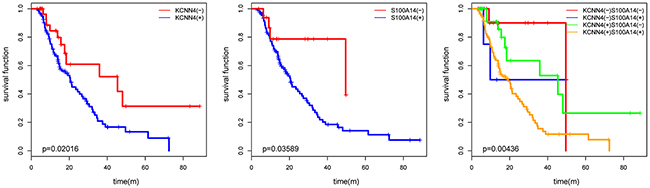
Figure 5: The KM plot of SOC recurrence with KCNN4 and S100A14 expression status in our cohort. The p values from log-rank tests are also presented.
Table 3: Relationship of KCNN4 and S100A14 expression with clinicopathological characteristics in SOC cohort
clinicopathological characteristics |
No. |
KCNN4 |
S100A14 |
||||
|---|---|---|---|---|---|---|---|
high(+) |
χ2 |
p value |
high(+) |
χ2 |
p value |
||
Age(years) |
|||||||
≥60 |
36 |
25(69.4%) |
0.7655 |
0.3816 |
31(86.1%) |
0.0110 |
0.9166 |
<60 |
91 |
70(76.9%) |
79(86.8%) |
||||
Stage |
|||||||
I~II |
37 |
21(56.8%) |
9.0215 |
0.002668 |
33(89.2%) |
0.2986 |
0.5848 |
III~IV |
90 |
74(82.2%) |
77(85.6%) |
||||
Grade |
|||||||
Grade1 |
8 |
5(62.5%) |
0.692 |
0.7075 |
7(87.5%) |
4.6933 |
0.0957 |
Grade2 |
24 |
18(75.0%) |
24(100%) |
||||
Grade3 |
95 |
72(75.8%) |
79(83.2%) |
||||
CA125(U/ml) |
|||||||
≥35 |
32 |
25(78.1%) |
0.2505 |
0.6168 |
24(75.0%) |
4.9771 |
0.02569 |
<35 |
95 |
70(73.7%) |
86(90.5%) |
||||
Ascites |
|||||||
Positive |
77 |
54(70.1%) |
2.2662 |
0.1322 |
67(95.7%) |
0.02683 |
0.8699 |
Negative |
50 |
41(82.0%) |
43(86.0%) |
||||
Tumor size(cm) |
|||||||
≥5 |
87 |
66(75.9%) |
0.1643 |
0.6852 |
72(82.8%) |
0.9981 |
0.3178 |
<5 |
40 |
29(72.5%) |
38(95.0%) |
||||
Lymph node metastasis |
|||||||
Positive |
26 |
19(73.1%) |
0.0517 |
0.8202 |
19(73.1%) |
5.1675 |
0.02301 |
Negative |
101 |
76(75.2%) |
91(90.1%) |
||||
Recurrence status |
|||||||
Positive |
73 |
62(84.9%) |
9.3443 |
0.002237 |
69(94.5%) |
9.2566 |
0.002346 |
Negative |
54 |
33(61.1%) |
41(75.9%) |
||||
Table 4: Univariate and multivariate Cox regression on recurrence in SOC cohort
Clinical factors |
Univariate analysis |
Multivariate analysis |
||||
|---|---|---|---|---|---|---|
OR |
95%CI |
Pr(>|z|) |
OR |
95%CI |
Pr(>|z|) |
|
Age(≥60y/<60y) |
0.9994 |
0.7791 - 1.282 |
0.996 |
1.0227 |
0.7903 – 1.3234 |
0.8646 |
Stage(I-II/III-IV) |
1.279 |
0.7905 - 2.068 |
0.316 |
1.1443 |
0.6615 – 1.9792 |
0.6298 |
Grade(I/II/III) |
0.8208 |
0.5856 - 1.15 |
0.252 |
0.7624 |
0.5155 – 1.1276 |
0.1743 |
CA125(≥35/<35U/ml) |
1.081 |
0.8237 - 1.42 |
0.573 |
0.9872 |
0.7233 – 1.3473 |
0.9345 |
Ascites(+/-) |
0.9758 |
0.7704 - 1.236 |
0.839 |
1.0479 |
0.8181 – 1.3423 |
0.7109 |
Tumor size(≥5/<5cm) |
0.9477 |
0.745 - 1.206 |
0.662 |
0.8903 |
0.6716 – 1.1802 |
0.4192 |
Lymph node metastasis(+/-) |
1.188 |
0.9086 - 1.553 |
0.208 |
1.1910 |
0.8922 – 1.5900 |
0.2356 |
KCNN4(low/high) |
0.4711 |
0.2461 - 0.9018 |
0.0231 |
0.4807 |
0.2402 – 0.9623 |
0.0386 |
S100A14(low/high) |
0.3551 |
0.1292 - 0.9755 |
0.0446 |
0.2955 |
0.1020 – 0.8566 |
0.0248 |
DISCUSSION
During the development of ovarian cancer, recurrence is the first critical clinical episode that has significant influence on late prognosis. The identification of patients who may experience recurrence before first-line treatment would greatly benefit clinical management. Clinical factors have poor predictive power for recurrence. Until now, transcription profiling has been used to derive molecular signatures associated with the prognosis of ovarian cancer [6–11]. However, the gene signatures identified in these studies shared only a small number of genes [12]. The vast majority of previous researches had focused overall survival rather than initial recurrence. Nevertheless, the limited independent cohort datasets and small sample sizes in some studies raised doubts about the generalizability and creditability of these results. Furthermore, multigene signatures are not very convenient to apply in clinical routines, whether as clinical predicting indicators or as therapeutic targets. In our work, we identified that the high expression of KCNN4 and S100A14 was associated with a high incidence of recurrence in optimally debulked SOC patients on both the mRNA and protein levels. To our knowledge, this is the first report about the relationship between KCNN4 and SOC. We established this 2-gene signature as an independent predictor for recurrence on optimally debulked SOC patients, robustly applicable in both multiple public datasets and our cohort data, and at both the mRNA and protein levels.
The KCNN4 gene encodes a KCa3.1 channel. The KCa3.1 channel is an intermediate conductance Ca2+-activated potassium channel that is sensitive to changes in intracellular Ca2+ and is voltage-independent. It had been found to be related to tumor grade, cell proliferation, metastatic spread, and cell cycle progression in several cancer types including prostate, pancreas, and breast cancer [14, 24–27], melanoma [28], endometrial cancer [29], as well as non-small cell lung cancer (NSCLC) [30], but no reports can be seen on SOC. The KCa3.1 channel-specific inhibitor, senicapoc, has been shown to prevent NSCLC proliferation [30].
S100A14 protein is a type of EF-hand calcium-binding protein that can function both intracellularly and extracellularly. It is reported to be upregulated in some cancer types, including ovarian, lung, breast, uterine, and cervical cancer [31], but downregulated in others, for instance, kidney, colon, rectal, and esophageal cancer [32]. The overexpression of S100A14 is related with poor prognoses in breast cancer, liver cancer, cervical cancer and ovarian cancer [13, 31, 33–36] but is associated with favorable outcomes in colorectal and small intestinal cancers [37, 38]. Specifically for ovarian cancer, the prior studies of S100A14 on SOC demonstrated that S100A14 was overexpressed in transformed cells on both the RNA and protein levels, which is consistent with our results. They found that S100A14 expression is associated with advanced stage (p< 0.001) and poor tumor grade (p< 0.001), but this conclusion was neither universal in all public datasets nor could it be replicated with our cohort data. Their assertion that S100A14 overexpression was an independent prognostic factor for overall survival (HR=4.53, p=0.029) could be partially supported by the enrolled public datasets and our data. Based on their results, we found that S100A14 could also be an independent prognosis predictor for recurrence and achieved higher prediction power when combined with KCNN4.
Moreover, we discussed their positive correlations of gene expression, and genomic regulations, with promoter methylation and CNV. We also sponsored a KCNN4 and S100A14-centered subnetwork and extracted the shortest regulation path between them, which was called the KCNN4-UBA52-KLF4-S100A14 axis, and speculated convincible regulation modes among them with the aid of Bayesian network inference, pairwise expression correlations and prior study conclusions. GO and pathway analyses of this subnetwork show that it is primarily involved in potassium ion transport, and the axis may play a central role. Previous studies have also noted that potassium ion channels are related to the proliferation, apoptosis and drug resistance of ovarian cancer cells [39–44]. Because S100A14 is an EF-hand calcium-binding protein that has been reported to be involved in the progression of SOC, and KCa3.1 channel is a Ca2+-dependent potassium channel, we assumed there was some type of regulatory causality between these two genes in SOC. More daringly, we speculated that the recurrence of SOC is associated with potassium ion transport. Our future work will further validate the prognostic value of KCNN4 and S100A14, as well as the regulation hypothesis of the axis, in additional to multicenter prospective studies of optimal debulked SOC patients.
MATERIALS AND METHODS
Public datasets for exploratory studies
All statistical analyses and data mining procedures in this work were carried out with R (version: 3.2.2). The source codes are available upon request. Bioconductor package curatedOvarianData (version: 1.0.5) introduced a manually curated data collection for gene expression meta-analysis of patients with ovarian cancer and software for reproducible preparation of similar databases, providing a comprehensive and flexible resource for clinically oriented investigation of the ovarian cancer transcriptome [45]. We employed an R script called createEsetList which was provided in this package to filter datasets and samples. The screening procedure was based on the following criteria: a. only keep optimal debulked SOC cases; b. should have recurrence related clinical data such as “recurrence status” and “time to tumor recurrence”; c. exclude cases with recurrence time less than 90 days form the termination of first-line therapies in order to avoid ambiguous outcomes; d. only keep common genes in all datasets; e. removed low correlation samples and duplicated samples. According to above criteria, 7 datasets were kept for further analysis. Finally, expression values in all datasets were normalized as standard Z-score. The clinical data of 7 datasets were listed in Table 1.
Cohort specimens for IHC
Paraffin-embedded cancer tissue samples were obtained from 127 SOC patients who underwent optimal debulking surgery at Tongji Hospital from February 2007 to May 2014. Optimal debulking surgery was defined as residual disease ≤1 cm after initial cytoreductive procedure. Postoperative Platinum and Taxol based chemotherapies commonly carried out for 4-8 cycles. The study was approved by the Ethical Committee of the Medical Faculty of Tongji Medical College, and written informed consents were obtained from all patients included. Individuals with preoperative chemotherapy or radiotherapy upon recurrence were excluded from this study. Ultimately, a cohort of 127 patients, who meet standards all above, was selected for our study. The stage of tumors were evaluated based on the InternationalFederation of Gynecology and Obstetrics (FIGO) criteria, while tumor grade were determined according to World Health Organization (WHO) standards. All subjects were reconfirmed for diagnosis by two independent pathologists in a blind manner. The original clinical data were obtained from clinical records database, including age at surgery, tumor stage and grade, serum CA-125 level, tumor size, ascites, lymph node metastasis, recurrence status and so on. Detailed characteristics of all cases are summarized in Table 3. The follow-up period was calculated from the termination date of the first-line therapy to the date of last follow-up evaluation or recurrence. The duration of follow-up time ranged from 3 to 89 months, the median time was 14 months. 73 (57.4%) of these cases relapsed during the follow-up period.
Recurrence related genes screening
We selected recurrence related genes by signal-to-noise (SNR) ratio between 2 recurrence status, that is, recurrence and norecurrence, in all these 7 ovarian cancer datasets. SNR is defined as |(μ1-μ2)/(σ1+σ2)|, in which μ1 and μ2 are mean values in two recurrence status, and σ1and σ2 are standard deviations in each group. Top 2000 genes which had high SNR in each dataset were selected and 2 intersected genes finally obtained, which were KCNN4 and S100A14.
Expression correlation between KCNN4 and S100A14
To explore the mRNA expression correlation between KCNN4 and S100A14, we made linear regressions between their expression in all 7 datasets. Their expression levels and distributions in all 7 datasets were also explored. To uncover the relationships of their mRNA expression with copy number alterations (CNA) and methylation, we extracted matched TCGA mRNA expression data, CNA data and methylation data of KCNN4 and S100A14 from cBioportal via cgdsr package [46, 47]. We estimated mRNA expression difference of KCNN4 and S100A14 among different CNA levels from a null distribution which was respectively constructed by asymptotic K-sample permutation test [48]. TukeyHSD tests were performed to detect pairwise significance, and all pairwise p values were adjusted with the method of Benjamini and Hochberg (BH). The linear regression of mRNA expression and methylation values were also performed.
Survival analysis of KCNN4 and S100A14
Since we screened these 2 targets from intersected recurrence status related genes, we wondered if they have prediction powers in early and late prognosis according to their mRNA expression levels. We decided their expression cutpoints in TCGA dataset to define binary expression status according to MinPvalue criterion from OptimalCutpoints package which aimed to minimize p value generated from χ2 test when measuring the association between the binary results obtained on using the cutpoint [49]. KCNN4 and S100A14 expression status were finally classified into “low” and “high” according to the comparisons between expression values with established cut-offs. The odds ratio (OR), 95% confidence index (CI), and p values of correlations between recurrence status and KCNN4, S100A14 expression status as well as their combination were determined via Fisher’s exact tests. Kaplan-Meier curves were drawn in univariate expression status as well as crossed expression status on recurrence, and log-rank tests were performed to check their significance. In order to check their classification abilities on late prognosis, we also performed log-rank tests on overall survival. We also explored the correlation of either KCNN4, S100A14 expression values or status with various clinical factors such as stage, grade, age, and so on. According to different data types and statistical purposes, different statistical methods were adopted, which were labeled as table legends. At last, univariate and multivariate Cox regressions concerning clinical factors and KCNN4 and S100A14 expression status both in all 7 datasets and our cohort were performed.
Recurrence prediction models construction and validation
To explore the prediction powers of KCNN4 and S100A14 expression on binary recurrence status, we constructed prediction models on TCGA dataset with 4 different machine learning algorithms, that is, random forest (rf), linear kernel support vector machine (svmLinear), radial kernel support vector machine (svmRadial), artificial neural network (nnet) using caret package [50]. The training models were built upon KCNN4, S100A14 and both of them respectively. These training models were built via 5-repeats of 10-fold cross validations based on above algorithms and coupled with internal parameter selection procedures. The prediction performance were judged with ROC and kappa values originated from cross validation processes and the best models confirmed. These models were then validated in other 6 datasets.
KCNN4 and S100A14 centered interaction subnetwork
To further investigate the regulation modes between KCNN4 and S100A14, we constructed KCNN4 and S100A14 centered interaction subnetwork from high quality STRING protein interaction database (combined score ≥ 600) [51]. We built the minimal undirected interaction subnetwork that could connect KCNN4 and S100A14 with k nearest neighbors (k=1). We found KCNN4 and S100A14 were connected by other 2 genes, UBA52 and KLF4. We called the shortest path between them as KCNN4-UBA52-KLF4-S100A14 axis which may represent the most potential and effective regulatory path. In order to investigate the potential regulation modes in this axis, we should confirm the positive or negative regulation modes and upstream or downstream regulation directions. To achieve these purposes, we further calculated pairwise correlation of expression values of axis genes. Then we determined the most appropriate regulation directions among axis genes by constructing Bayesian networks on axis genes in all 7 datasets with hill climbing method, which is a score-based learning algorithm and its conditional independent test is based on AIC [52], then their prediction results were combined. We employed fast greedy searching community detection algorithm on KCNN4 and S100A14 centered interaction subnetwork to find functional modules, and put the axis forward as a regulation hypothesis. Enrichment analysis of all genes involved in KCNN4 and S100A14 centered interaction subnetwork was performed by hypergeometric tests on GO and pathway database such as KEGG and REACTOME, and the significant enriched terms (adjusted p<0.05) were illustrated in word clouds [53].
Immunohistochemistry analysis
IHC analysis was performed as described previously [54]. The treated tissue sections were incubated with rabbit anti-KCNN4 antibody (ABclonal, 1:50) and rabbit anti-S100A14 antibody (Proteintech, 1:100). IHC was performed via the G1210 kit (Wu hanGoodbio technology CO., LTD, Wuhan, China) according to manufacturer’s instructions. Antibody binding was visualized by using 3, 3’-diaminobenzidine (DAB). The nuclei were counterstained with haematoxylin. Human tonsil and colon cancer tissues were selected as positive-control samples according to the manufacturers’ instructions and included in each batch. Negative-control samples were processed as per the standard protocol but with the IgG antibody.All slides were scanned by OLYMPUS (DP73) scanning system. IHC staining of KCNN4 or S100A14 was semi-quantitatively score don the basis of positively stained area and staining intensity by two independent pathologists in a blinded manner. Staining intensity was scored as follows: 0 (negative), 1 (weak), 2 (moderate) and 3 (strong). While the percentage of positive cells wasalso scored as follows, 1(0-25%), 2(26-50%), 3(51-75%), 4 (76-100%). The levels of KCNN4 and S100A14 staining were assessed by immunoreactive score, which is the product of the intensity and percentage scores. KCNN4 and S100A14 staining pattern was defined as low (0–6) and high (8–12). The relationships of KCNN4 and S100A14 expression with clinicopathological characteristics were estimated by Chi-square tests estimated from resampled null distributions. We performed univariate and multivariate Cox regression on recurrence in our cohort to validate their independent prediction powers for recurrence. KM curves were plotted to explore their expression status in different recurrence status, and log-rank tests performed to validate their significance.
CONFLICTS OF INTEREST
The authors indicate no potential conflicts of interest.
FUNDING
This study is supported by the National Basic Research Program of China (973 Program, 2015CB553903), the National High Technology Research and National Development Program of China (863 program, 2012AA02A507), the National Science-technology Support Plan Projects (2015BAI13B05) and Nature and Science Foundation of China (81272859, 30801340, 81230038, 81202061, 81502258, 81501530, 81402163, 81402164, G30973184).
REFERENCES
1. Siegel RL, Miller KD and Jemal A. Cancer statistics, 2015. CA Cancer J Clin. 2015; 65:5-29.
2. Seidman JD, Horkayne-Szakaly I, Haiba M, Boice CR, Kurman RJ and Ronnett BM. The histologic type and stage distribution of ovarian carcinomas of surface epithelial origin. Int J Gynecol Pathol. 2004; 23:41-44.
3. McGuire WP, Hoskins WJ, Brady MF, Kucera PR, Partridge EE, Look KY, Clarke-Pearson DL and Davidson M. Cyclophosphamide and cisplatin compared with paclitaxel and cisplatin in patients with stage III and stage IV ovarian cancer. The New England journal of medicine. 1996; 334:1-6.
4. Ozols RF, Bundy BN, Greer BE, Fowler JM, Clarke-Pearson D, Burger RA, Mannel RS, DeGeest K, Hartenbach EM, Baergen R and Gynecologic Oncology G. Phase III trial of carboplatin and paclitaxel compared with cisplatin and paclitaxel in patients with optimally resected stage III ovarian cancer: a Gynecologic Oncology Group study. Journal of clinical oncology: official journal of the American Society of Clinical Oncology. 2003; 21:3194-3200.
5. Salani R, Backes FJ, Fung MF, Holschneider CH, Parker LP, Bristow RE and Goff BA. Posttreatment surveillance and diagnosis of recurrence in women with gynecologic malignancies: Society of Gynecologic Oncologists recommendations. American journal of obstetrics and gynecology. 2011; 204:466-478.
6. Berchuck A, Iversen ES, Lancaster JM, Dressman HK, West M, Nevins JR and Marks JR. Prediction of optimal versus suboptimal cytoreduction of advanced-stage serous ovarian cancer with the use of microarrays. American journal of obstetrics and gynecology. 2004; 190:910-925.
7. Berchuck A, Iversen ES, Lancaster JM, Pittman J, Luo J, Lee P, Murphy S, Dressman HK, Febbo PG, West M, Nevins JR and Marks JR. Patterns of gene expression that characterize long-term survival in advanced stage serous ovarian cancers. Clin Cancer Res. 2005; 11:3686-3696.
8. Hartmann LC, Lu KH, Linette GP, Cliby WA, Kalli KR, Gershenson D, Bast RC, Stec J, Iartchouk N, Smith DI, Ross JS, Hoersch S, Shridhar V, Lillie J, Kaufmann SH, Clark EA, et al. Gene expression profiles predict early relapse in ovarian cancer after platinum-paclitaxel chemotherapy. Clin Cancer Res. 2005; 11:2149-2155.
9. Lancaster JM, Dressman HK, Whitaker RS, Havrilesky L, Gray J, Marks JR, Nevins JR and Berchuck A. Gene expression patterns that characterize advanced stage serous ovarian cancers. Journal of the Society for Gynecologic Investigation. 2004; 11:51-59.
10. Spentzos D, Levine DA, Ramoni MF, Joseph M, Gu X, Boyd J, Libermann TA and Cannistra SA. Gene expression signature with independent prognostic significance in epithelial ovarian cancer. J Clin Oncol. 2004; 22:4700-4710.
11. Dressman HK, Berchuck A, Chan G, Zhai J, Bild A, Sayer R, Cragun J, Clarke J, Whitaker RS, Li L, Gray J, Marks J, Ginsburg GS, Potti A, West M, Nevins JR, et al. An integrated genomic-based approach to individualized treatment of patients with advanced-stage ovarian cancer. J Clin Oncol. 2007; 25:517-525.
12. Konstantinopoulos PA, Spentzos D and Cannistra SA. Gene-expression profiling in epithelial ovarian cancer. Nature clinical practice Oncology. 2008; 5:577-587.
13. Cho H, Shin HY, Kim S, Kim JS, Chung JY, Chung EJ, Chun KH, Hewitt SM and Kim JH. The role of S100A14 in epithelial ovarian tumors. Oncotarget. 2014; 5:3482-3496. doi: 10.18632/oncotarget.1947.
14. Lallet-Daher H, Roudbaraki M, Bavencoffe A, Mariot P, Gackiere F, Bidaux G, Urbain R, Gosset P, Delcourt P, Fleurisse L, Slomianny C, Dewailly E, Mauroy B, Bonnal JL, Skryma R and Prevarskaya N. Intermediate-conductance Ca2+-activated K+ channels (IKCa1) regulate human prostate cancer cell proliferation through a close control of calcium entry. Oncogene. 2009; 28:1792-1806.
15. De Marchi U, Sassi N, Fioretti B, Catacuzzeno L, Cereghetti GM, Szabo I and Zoratti M. Intermediate conductance Ca2+-activated potassium channel (KCa3.1) in the inner mitochondrial membrane of human colon cancer cells. Cell calcium. 2009; 45:509-516.
16. Cancer Genome Atlas Research N. Integrated genomic analyses of ovarian carcinoma. Nature. 2011; 474:609-615.
17. Yoshihara K, Tajima A, Yahata T, Kodama S, Fujiwara H, Suzuki M, Onishi Y, Hatae M, Sueyoshi K, Fujiwara H, Kudo Y, Kotera K, Masuzaki H, Tashiro H, Katabuchi H, Inoue I, et al. Gene expression profile for predicting survival in advanced-stage serous ovarian cancer across two independent datasets. PloS one. 2010; 5:e9615.
18. Mateescu B, Batista L, Cardon M, Gruosso T, de Feraudy Y, Mariani O, Nicolas A, Meyniel JP, Cottu P, Sastre-Garau X and Mechta-Grigoriou F. miR-141 and miR-200a act on ovarian tumorigenesis by controlling oxidative stress response. Nature medicine. 2011; 17:1627-1635.
19. Ferriss JS, Kim Y, Duska L, Birrer M, Levine DA, Moskaluk C, Theodorescu D and Lee JK. Multi-gene expression predictors of single drug responses to adjuvant chemotherapy in ovarian carcinoma: predicting platinum resistance. PloS one. 2012; 7:e30550.
20. Pils D, Hager G, Tong D, Aust S, Heinze G, Kohl M, Schuster E, Wolf A, Sehouli J, Braicu I, Vergote I, Cadron I, Mahner S, Hofstetter G, Speiser P and Zeillinger R. Validating the impact of a molecular subtype in ovarian cancer on outcomes: a study of the OVCAD Consortium. Cancer science. 2012; 103:1334-1341.
21. Tothill RW, Tinker AV, George J, Brown R, Fox SB, Lade S, Johnson DS, Trivett MK, Etemadmoghadam D, Locandro B, Traficante N, Fereday S, Hung JA, Chiew YE, Haviv I, Australian Ovarian Cancer Study G, et al. Novel molecular subtypes of serous and endometrioid ovarian cancer linked to clinical outcome. Clin Cancer Res. 2008; 14:5198-5208.
22. He H, Li S, Chen H, Li L, Xu C, Ding F, Zhan Y, Ma J, Zhang S, Shi Y, Qu C and Liu Z. 12-O-tetradecanoylphorbol-13-acetate promotes breast cancer cell motility by increasing S100A14 level in a Kruppel-like transcription factor 4 (KLF4)-dependent manner. The Journal of biological chemistry. 2014; 289:9089-9099.
23. Clauset A, Newman ME and Moore C. Finding community structure in very large networks. Phys Rev E Stat Nonlin Soft Matter Phys. 2004; 70:066111.
24. Ohya S, Kimura K, Niwa S, Ohno A, Kojima Y, Sasaki S, Kohri K and Imaizumi Y. Malignancy grade-dependent expression of K+-channel subtypes in human prostate cancer. Journal of pharmacological sciences. 2009; 109:148-151.
25. Jager H, Dreker T, Buck A, Giehl K, Gress T and Grissmer S. Blockage of intermediate-conductance Ca2+-activated K+ channels inhibit human pancreatic cancer cell growth in vitro. Molecular pharmacology. 2004; 65:630-638.
26. Haren N, Khorsi H, Faouzi M, Ahidouch A, Sevestre H and Ouadid-Ahidouch H. Intermediate conductance Ca2+ activated K+ channels are expressed and functional in breast adenocarcinomas: correlation with tumour grade and metastasis status. Histology and histopathology. 2010; 25:1247-1255.
27. Ouadid-Ahidouch H, Roudbaraki M, Delcourt P, Ahidouch A, Joury N and Prevarskaya N. Functional and molecular identification of intermediate-conductance Ca(2+)-activated K(+) channels in breast cancer cells: association with cell cycle progression. American journal of physiology Cell physiology. 2004; 287:C125-134.
28. Tajima N, Schonherr K, Niedling S, Kaatz M, Kanno H, Schonherr R and Heinemann SH. Ca2+-activated K+ channels in human melanoma cells are up-regulated by hypoxia involving hypoxia-inducible factor-1alpha and the von Hippel-Lindau protein. The Journal of physiology. 2006; 571:349-359.
29. Wang ZH, Shen B, Yao HL, Jia YC, Ren J, Feng YJ and Wang YZ. Blockage of intermediate-conductance-Ca(2+) -activated K(+) channels inhibits progression of human endometrial cancer. Oncogene. 2007; 26:5107-5114.
30. Bulk E, Ay AS, Hammadi M, Ouadid-Ahidouch H, Schelhaas S, Hascher A, Rohde C, Thoennissen NH, Wiewrodt R, Schmidt E, Marra A, Hillejan L, Jacobs AH, Klein HU, Dugas M, Berdel WE, et al. Epigenetic dysregulation of K 3.1 channels induces poor prognosis in lung cancer. International journal of cancer. 2015.
31. Wang X, Yang J, Qian J, Liu Z, Chen H and Cui Z. S100A14, a mediator of epithelial-mesenchymal transition, regulates proliferation, migration and invasion of human cervical cancer cells. American journal of cancer research. 2015; 5:1484-1495.
32. Pietas A, Schluns K, Marenholz I, Schafer BW, Heizmann CW and Petersen I. Molecular cloning and characterization of the human S100A14 gene encoding a novel member of the S100 family. Genomics. 2002; 79:513-522.
33. McKiernan E, McDermott EW, Evoy D, Crown J and Duffy MJ. The role of S100 genes in breast cancer progression. Tumour Biol. 2011; 32:441-450.
34. Ehmsen S, Hansen LT, Bak M, Brasch-Andersen C, Ditzel HJ and Leth-Larsen R. S100A14 is a novel independent prognostic biomarker in the triple-negative breast cancer subtype. International journal of cancer. 2015.
35. Xu C, Chen H, Wang X, Gao J, Che Y, Li Y, Ding F, Luo A, Zhang S and Liu Z. S100A14, a member of the EF-hand calcium-binding proteins, is overexpressed in breast cancer and acts as a modulator of HER2 signaling. The Journal of biological chemistry. 2014; 289:827-837.
36. Zhao FT, Jia ZS, Yang Q, Song L and Jiang XJ. S100A14 promotes the growth and metastasis of hepatocellular carcinoma. Asian Pac J Cancer Prev. 2013; 14:3831-3836.
37. Wang HY, Zhang JY, Cui JT, Tan XH, Li WM, Gu J and Lu YY. Expression status of S100A14 and S100A4 correlates with metastatic potential and clinical outcome in colorectal cancer after surgery. Oncology reports. 2010; 23:45-52.
38. Kim G, Chung JY, Jun SY, Eom DW, Bae YK, Jang KT, Kim J, Yu E and Hong SM. Loss of S100A14 expression is associated with the progression of adenocarcinomas of the small intestine. Pathobiology. 2013; 80:95-101.
39. Innamaa A, Jackson L, Asher V, Van Shalkwyk G, Warren A, Hay D, Bali A, Sowter H and Khan R. Expression and prognostic significance of the oncogenic K2P potassium channel KCNK9 (TASK-3) in ovarian carcinoma. Anticancer research. 2013; 33:1401-1408.
40. Han X, Xi L, Wang H, Huang X, Ma X, Han Z, Wu P, Ma X, Lu Y, Wang G, Zhou J and Ma D. The potassium ion channel opener NS1619 inhibits proliferation and induces apoptosis in A2780 ovarian cancer cells. Biochemical and biophysical research communications. 2008; 375:205-209.
41. Innamaa A, Jackson L, Asher V, van Schalkwyk G, Warren A, Keightley A, Hay D, Bali A, Sowter H and Khan R. Expression and effects of modulation of the K2P potassium channels TREK-1 (KCNK2) and TREK-2 (KCNK10) in the normal human ovary and epithelial ovarian cancer. Clin Transl Oncol. 2013; 15:910-918.
42. Zhanping W, Xiaoyu P, Na C, Shenglan W and Bo W. Voltage-gated K+ channels are associated with cell proliferation and cell cycle of ovarian cancer cell. Gynecologic oncology. 2007; 104:455-460.
43. Shen MR, Lin AC, Hsu YM, Chang TJ, Tang MJ, Alper SL, Ellory JC and Chou CY. Insulin-like growth factor 1 stimulates KCl cotransport, which is necessary for invasion and proliferation of cervical cancer and ovarian cancer cells. The Journal of biological chemistry. 2004; 279:40017-40025.
44. Samuel P, Pink RC, Caley DP, Currie JM, Brooks SA and Carter DR. Over-expression of miR-31 or loss of KCNMA1 leads to increased cisplatin resistance in ovarian cancer cells. Tumour Biol. 2015.
45. Ganzfried BF, Riester M, Haibe-Kains B, Risch T, Tyekucheva S, Jazic I, Wang XV, Ahmadifar M, Birrer MJ and Parmigiani G. curatedOvarianData: clinically annotated data for the ovarian cancer transcriptome. Database. 2013; 2013:bat013.
46. Cerami E, Gao J, Dogrusoz U, Gross BE, Sumer SO, Aksoy BA, Jacobsen A, Byrne CJ, Heuer ML and Larsson E. The cBio cancer genomics portal: an open platform for exploring multidimensional cancer genomics data. Cancer discovery. 2012; 2:401-404.
47. Jacobsen A. cgdsr: R-Based API for Accessing the MSKCC Cancer Genomics Data Server (CGDS). R package version 125. 2015; http://CRAN.R-project.org/package=cgdsr.
48. Zeileis A, Wiel MA, Hornik K and Hothorn T. Implementing a class of permutation tests: The coin package. Journal of statistical software. 2008; 28:1-23.
49. Lopez-Raton M, Rodriguez-Alvarez MX, Cadarso-Suárez C and Gude-Sampedro F. OptimalCutpoints: An R Package for Selecting Optimal Cutpoints in Diagnostic Tests. Journal of statistical software. 2014; 61:1-36.
50. Core MKCfJWaSWaAWaCKaAEaTCaZMaBKatR. caret: Classification and Regression Training. R package version 60-58. 2015; http://CRAN.R-project.org/package=caret.
51. Szklarczyk D, Franceschini A, Kuhn M, Simonovic M, Roth A, Minguez P, Doerks T, Stark M, Muller J and Bork P. The STRING database in 2011: functional interaction networks of proteins, globally integrated and scored. Nucleic acids research. 2011; 39:D561-D568.
52. Scutari M. Learning Bayesian networks with the bnlearn R package. arXiv preprint arXiv:09083817. 2009.
53. Kolde R. GOsummaries: Word cloud summaries of GO enrichment analysis. R package version 220. 2014; https://github.com/raivokolde/GOsummaries.
54. Li J, Cheng Y, Tai D, Martinka M, Welch DR and Li G. Prognostic significance of BRMS1 expression in human melanoma and its role in tumor angiogenesis. Oncogene. 2011; 30:896-906.