
Introduction
The annual incidence of brain and other nervous system tumors in the United States is approximately 23,000, with an associated annual mortality of nearly 14,000[1]. These tumors comprise a widely heterogeneous array of neoplasms, each affecting an extremely small but important fraction of the population. Given their rarity, these tumors are difficult to study and clinical decision-making is often based on extrapolated data generated from adult tumors with similar pathological and histological findings. However, it is becoming increasingly apparent that pediatric and adult tumors are widely disparate in their biology, genetics, and clinical behavior. Much work has already been conducted on the global genetic profiling of adult glioblastomas and pediatric medulloblastoma[2-9]. Pontine gliomas and anaplastic oligodendrogliomas have also been sequenced at a genome-wide level[10-13]. In this work, we studied four tumors, with either astrocytic or ependymal differentiation: 1) pleomorphic xanthoastrocytoma (PXA), 2) non-brainstem pediatric glioblastoma (PGBM), 3) intracranial ependymoma (IEP) and 4) spinal cord ependymoma (SCEP).
PXAs (Figure 1A) are rare astrocytic malignancies that are classified by the World Health Organization (WHO) as grade II lesions. They typically present with seizures and are often superficially located within the brain. The current treatment paradigm calls for maximal safe surgical resection, with no clear role for adjuvant radiation or chemotherapy[14]. The overall prognosis is favorable, with a ten-year survival rate of 70%[15]. However, malignant transformation has been reported in nearly a third of these tumors[15, 16].
Grade IV astrocytomas (Figure 1B), otherwise known as glioblastoma, are uniformly lethal tumors with a two-year life expectancy of only 5-30% in children[17, 18]. PGBMs are amongst the most challenging pediatric tumors to treat and do not respond to even the most aggressive regimens, including surgery, radiation, and chemotherapy[19]. PGBMs are typically classified as either arising from the brainstem (diffuse pontine glioma) or non-brainstem glioblastoma. The current study focuses on non-brainstem lesions.
Ependymoma is the third most common pediatric brain tumor and these neoplasms exhibit differentiation in the direction of cells lining the ventricular system in the brain and the central canal in the spinal cord. Over 90% of pediatric ependymomas are intracranial, while the vast majority of adult ependymomas arise in the spinal cord[20]. Intracranial ependymomas (IEPs) (Figure 1C) are challenging lesions to treat, with surgery being the mainstay of therapy given the lack of efficacious chemotherapy or radiation regimens. Progression free-survival is only 30% at 5 years, with 5 year-survival rates of 60%[20]. Spinal cord ependymomas (SCEPs) (Figure 1D) are rare neoplasms that are typically WHO grade I- III lesions that can be cured with gross total resection. However, given the delicate nature of the spinal cord, post-operative neurological deficits are common. In addition, when complete surgical excision is not possible, chemotherapeutic strategies have not been shown to be of benefit. Given the paucity of effective adjuvant therapy, 5 year-survival rate for grade III SCEPs is ~65%[21].
To understand better the pathogenesis of astrocytic and ependymal tumors, we sequenced the coding exons of 20,687 genes in tumor and matched normal DNA from 12 PXA, 17 non-brainstem PGBM, 8 IEP and 8 SCE using massively-parallel sequencing. Using a previously described process, all sequencing data were passed through a series of stringent filters[12, 22, 23]. All putative alterations were then manually inspected and curated and a subset of mutations was validated using Sanger sequencing.
Results
We evaluated 12 PXAs from ten patients; in two patients, we were able to analyze both the primary and recurrent tumors. An average of 6.7 x 10⁹ high quality bases were sequenced per sample, with an average of 72 distinct reads per targeted base; 90% of these bases having at least 10 distinct reads (Table 1). After filtering and visual inspection, the sequencing results revealed 113 high confidence somatic mutations in the 12 samples (see Materials and Methods). We attempted to confirm a subset of mutations found in this study using independent platforms, such as Sanger Sequencing. As expected from our algorithms for high confidence mutations from our previous studies, greater than 90% of mutations tested were confirmed as true somatic alterations. Only seven genes were mutated in more than one of the ten primary tumors: BRAF was mutated in 6 tumors and TP53, BAP1, CHERP, FLRT2, and RNF43 were each mutated in 2 tumors (Supplementary Table 1a). The tumors contained an average of 9.5 ± 8.5 mutations (range 1 to 28). In the recurrent case (XPA25PT3) that histopathologically progressed, there was a de novo truncating mutation in RB1, as well as a mutation in PIK3R1 that was not detected in the original PXA (Supplementary Table 1a). That tumor also had far higher levels of LOH than the other cases at the time of initial resection, at which point it was still pathologically defined as a PXA (Table 2). Genes coding for members of the mTOR pathway were altered in 4/12 of PXA samples, NF1 alterations in 2 cases, TSC2 and PIK3R1 in 1 case each. No mTOR pathway gene alterations were identified in cases with BRAF mutation.
Table 1: Summary of Sequence Analysis |
||||||||
|
PXA |
|
PGBM |
|
IEP |
|
SCEP |
|
Coverage Summary |
Tumor |
Normal |
Tumor |
Normal |
Tumor |
Normal |
Tumor |
Normal |
Number of samples analyzed |
12 |
12 |
17 |
17 |
8 |
8 |
8 |
8 |
Bases sequenced (after quality filtering) |
6.7 ± 3.9 x 10^9 |
8.4 ± 1.4 x 10^9 |
13.1 ± 4.0 x 10^9 |
12.6± 3.5 x 10^9 |
9.3 ± 0.49 x 10^9 |
9.88 ± 1.6 x 10^9 |
7.1 ± 1.1 x 10^9 |
7.2 ± 1.2 x 10^9 |
Bases mapped to targeted region |
3.2 ± 1.5 x 10^9 |
3.8 ± 0.69 x 10^9 |
6.6 ± 2.2 x 10^9 |
6.8 ± 2.0 x 10^9 |
4.5 ± 0.29 x 10^9 |
4.7 ± 083 x 10^9 |
3.6 ± 0.54 x 10^9 |
3.7 ± 0.64 x 10^9 |
Average # of distinct reads per targeted base |
72.4± 33.3 |
93 ±15.6 |
108.0 ± 36.1 |
119.0 ± 37.5 |
101.2 ± 6.2 |
107.3 ± 10.6 |
80.6 ± 10.2 |
87.9 ± 14.8 |
Targeted bases with at least 10 distinct reads (%) |
90 ± 11% |
95 ± 2.7% |
94 ± 1.5% |
94.6 ± 1.05% |
96.8 ± 0.2% |
96.3 ±0.48% |
77 ± 2.5% |
96.2 ±0.59% |
Tumor and normal comparison |
||||||||
Known SNPs identified in tumor |
15,466 ± 2816 |
22,126 ± 2209 |
17,464 ± 1885 |
11,342 ± 646 |
||||
% tumor SNPs identified in matched normal |
99.9± 0.01% |
99.5± 0.01% |
99.9± 0.02% |
99.9± 0.02% |
||||
Non-synonymous somatic mutations in tumor |
9.6± 8.3 |
23.5 ± 11.2 |
12.8 ± 10.6 |
12.9 ±6.4 |
||||
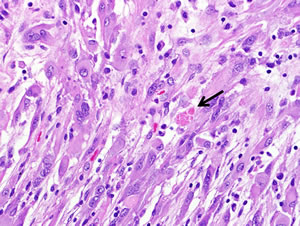
Figure 1A: Pleomorphic xanthoastrocytoma (WHO grade II). Pleomorphic xanthoastrocytoma represents a distinctive glioma subtype. Histologically it is characterized by the presence of nuclear pleomorphism (e.g. variation in nuclear size), a fascicular arrangement of cells and eosinophilic granular bodies (arrow).
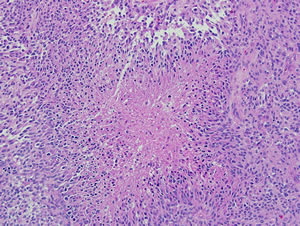
Figure 1B: Pediatric glioblastoma (WHO grade IV). Morphologic features of pediatric glioblastomas are similar to those found in adult patients. Pseudopalisading necrosis is a characteristic finding (center), and diagnostic of glioblastoma when present in a mitotically active infiltrating astrocytoma.
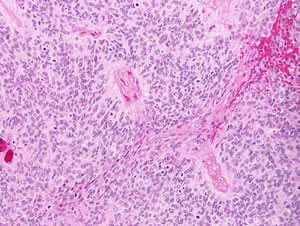
Figure 1C: Intracranial ependymoma (WHO grade III). Perivascular pseudorosettes are a histologic hallmark of ependymoma, and represent neoplastic cell processes surrounding intratumoral vessels. Brisk mitotic activity is present in this intracranial ependymoma (arrows), which suffices to classify it as anaplastic.
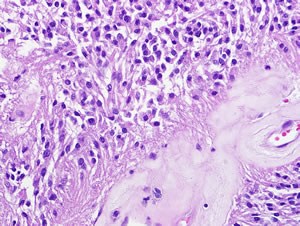
Figure 1D: Spinal cord ependymoma (WHO grade II). Spinal cord ependymomas are typically low grade, and demonstrate low proliferative activity. Perivascular pseudorosettes, composed of numerous perivascular glial processes (arrows), are frequent characteristic histologic features.
Exomic sequencing and analysis was performed on 17 PGBMs, generating an average of 13.1 x 10⁹ high quality bases per sample. A mean of 108 distinct reads per targeted base was achieved, with 94% of targeted bases represented by at least 10 distinct reads (Table 1). The PGBMs contained an average of 23.5 ± 11.2 mutations (range 4-46). The recurrently mutated genes in our cohort of PGBMs were TP53 (7/17), ATRX (3/17), TTN (3/17), BRAF (2/17), IDH1 (2/17), FRMPD4 (2/17), PKHD1L1 (2/17), PTPRU (2/17), SPATA22 (2/17) (Supplementary Table 1b). Of note, recently described alterations in the histone H3.3 gene was detected in only 1 of 17 samples via next generation sequencing[10, 11]. H3.3 and BRAF were subsequently evaluated by Sanger Sequencing in the same samples and six additional PGBMs. In all, H3.3 mutations were identified in two of the 23 tumors, while BRAF mutations were identified in 3 of 23 tumors.
Sequencing the coding regions of 8 IEPs generated 9.3X10⁹ high quality bases with an average of 101 distinct reads and 97% with at least 10 distinct reads. For the 8 SCEPs analyzed, 7.1X10⁹ high quality bases were generated, with an average of 81 distinct reads per targeted base and 77% of bases with at least 10 distinct reads (Table 1). The IEPs contained an average of 12.8 ± 10.6 mutations (range 5 to 34). Notably, there were no recurrent mutations in the IEPs (Supplementary Table 1c). The only recurrent mutation in SCEPs was NF2 (4/8), a tumor suppressor previously known to be altered in this tumor type (Supplementary Table 1d). In addition, all 8 SCEP discovery samples contained LOH of chromosome 22, where NF2 locus resides (Table 2). The SCEPs contained an average of 12.9 ± 6.4 mutations (range 2 to 23) (Table 1). NF2 was sequenced in an additional 48 samples comprised of 32 intracranial,11 spinal ependymomas, 3 myxopapillary ependymomas and 2 spinal sub-ependymomas. It was mutated in 5 additional samples, all of which were spinal ependymomas. In total NF2 was mutated in 9 of 19 SCEPs (47%) and in none of 40 IEPs (0%; p<0.0002, Students t-test). However, 5/8 IEP discovery samples exhibited LOH of chromosome 22 but none contained mutations in the NF2 gene (Table 2). This suggests that another mechanism outside of NF2 may be driving loss of chromosome 22 in IEPs.
| Table 2: LOH Heat Map | ||||||||||||||||||||||||
| PXA | ||||||||||||||||||||||||
| Chromosome | 1 | 2 | 3 | 4 | 5 | 6 | 7 | 8 | 9 | 10 | 11 | 12 | 13 | 14 | 15 | 16 | 17 | 18 | 19 | 20 | 21 | 22 | X | Y |
| Sample: | ||||||||||||||||||||||||
| XPA21PT | ||||||||||||||||||||||||
| XPA23PT | ||||||||||||||||||||||||
| XPA24PT | ||||||||||||||||||||||||
| XPA25PT1 | ||||||||||||||||||||||||
| XPA25PT3 | ||||||||||||||||||||||||
| XPA26PT | ||||||||||||||||||||||||
| XPA27PT1 | ||||||||||||||||||||||||
| XPA27PT2 | ||||||||||||||||||||||||
| XPA28PT | ||||||||||||||||||||||||
| XPA31PT | ||||||||||||||||||||||||
| XPA33PT | ||||||||||||||||||||||||
| XPA34PT | ||||||||||||||||||||||||
| PGBM | ||||||||||||||||||||||||
| Sample: | ||||||||||||||||||||||||
| PGBM01PT2 | ||||||||||||||||||||||||
| PGBM02PT | ||||||||||||||||||||||||
| PGBM03PT | ||||||||||||||||||||||||
| PGBM04PT | ||||||||||||||||||||||||
| PGBM05PT | ||||||||||||||||||||||||
| PGBM07PT | ||||||||||||||||||||||||
| PGBM09PT | ||||||||||||||||||||||||
| PGBM10PT | ||||||||||||||||||||||||
| PGBM11PT | ||||||||||||||||||||||||
| PGBM13PT | ||||||||||||||||||||||||
| PGBM15PT | ||||||||||||||||||||||||
| PGBM16PT | ||||||||||||||||||||||||
| PGBM17PT | ||||||||||||||||||||||||
| PGBM18PT | ||||||||||||||||||||||||
| PGBM20PT | ||||||||||||||||||||||||
| PGBM32PT | ||||||||||||||||||||||||
| PGBM33PT | ||||||||||||||||||||||||
| Intracranial Ependymomas | ||||||||||||||||||||||||
| Sample: | ||||||||||||||||||||||||
| SE16PT | ||||||||||||||||||||||||
| SE18PT | ||||||||||||||||||||||||
| SE20PT | ||||||||||||||||||||||||
| SE21PT | ||||||||||||||||||||||||
| SE22PT | ||||||||||||||||||||||||
| SE30PT | ||||||||||||||||||||||||
| SE31PT | ||||||||||||||||||||||||
| SE35PT | ||||||||||||||||||||||||
| Spinal Ependymomas | ||||||||||||||||||||||||
| Sample: | ||||||||||||||||||||||||
| SE1PT | ||||||||||||||||||||||||
| SE3PT | ||||||||||||||||||||||||
| SE4PT | ||||||||||||||||||||||||
| SE5PT | ||||||||||||||||||||||||
| SE6PT | ||||||||||||||||||||||||
| SE7PT | ||||||||||||||||||||||||
| SE8PT | ||||||||||||||||||||||||
| SE9PT | ||||||||||||||||||||||||
| No LOH | ||||||||||||||||||||||||
| Partial LOH | ||||||||||||||||||||||||
| Complete LOH | ||||||||||||||||||||||||
The mutational spectrum for each of the 4 tumor types was determined and in all tumors, the C:G>T:A transition was the most common single base pair alteration (Table 3). This has been shown to be the case in other CNS tumors, including medulloblastoma, adult glioblastoma and oligodendroglioma and non-CNS tumors [2, 4, 11, 12, 23-26].
Table 3: Mutation Spectrum |
||||||||
|
PXA |
|
PGBM |
|
IEP |
|
SCEP |
|
Mutations |
Number |
Percent (%) |
Number |
Percent (%) |
Number |
Percent (%) |
Number |
Percent (%) |
A:T>C:G |
5 |
4.3 |
26 |
6.5 |
7 |
6.9 |
13 |
12.6 |
A:T>G:C |
15 |
13.0 |
54 |
13.5 |
11 |
10.8 |
17 |
16.5 |
A:T>T:A |
13 |
11.3 |
36 |
9.0 |
9 |
8.8 |
14 |
13.6 |
C:G>A:T |
17 |
14.8 |
55 |
13.8 |
13 |
12.7 |
14 |
13.6 |
C:G>G:C |
9 |
7.8 |
44 |
11.0 |
14 |
13.7 |
9 |
8.7 |
C:G>T:A |
45 |
39.1 |
140 |
35.0 |
35 |
34.3 |
29 |
28.2 |
Indel |
11 |
9.6 |
45 |
11.3 |
13 |
12.7 |
7 |
6.8 |
Total |
115 |
100.0 |
400 |
100.0 |
102 |
100.0 |
103 |
100.0 |
Average Number of Mutations Per Tumor |
9.6 |
23.5 |
12.8 |
12.9 |
||||
Table 4: Patient Demographics |
||||
PXA |
||||
Sample: |
Age: |
# of Mutations: |
Location: |
Mutations in Recognized Driver Genes: |
XPA21PT |
10 |
12 |
Right temporoparietal |
BRAF, TP53 |
XPA23PT |
10 |
6 |
Not available |
BRAF |
XPA24PT |
18 |
11 |
Not available |
BRAF |
XPA25PT1 |
11 |
4 |
Not available |
TSC2 |
XPA25PT3 |
12 |
10 |
Not available |
RB1, PIK3R1 |
XPA26PT |
18 |
4 |
Not available |
|
XPA27PT1 |
18 |
23 |
Not available |
NF1, TP53 |
XPA27PT2 |
18 |
28 |
Not available |
NF1, TP53 |
XPA28PT |
13 |
2 |
Not available |
BRAF |
XPA31PT |
11 |
8 |
Left temporal |
BRAF |
XPA33PT |
11 |
6 |
Left temporal |
|
XPA34PT |
26 |
1 |
Right parieto-occipital |
BRAF |
PGBM |
||||
Sample: |
Age: |
# of Mutations: |
Location: |
Mutations in Recognized Driver Genes: |
PGBM01PT2 |
4 |
23 |
Left temporal/parietal/occipital |
BRCA2 (has germline and somatic mutation) |
PGBM02PT |
20 |
28 |
Right frontal |
TP53, IDH1, ATRX |
PGBM03PT |
12 |
19 |
Left occipital |
TP53, EGFR |
PGBM04PT |
11 |
17 |
Posterior fossa |
|
PGBM05PT |
9 |
13 |
Left temporal/parietal |
TP53, ATRX |
PGBM07PT |
17 |
16 |
Right temporal |
TP53, NF1 |
PGBM09PT |
17 |
41 |
Right temporal/parietal |
BRAF, ATRX |
PGBM10PT |
8 |
14 |
Left frontal |
|
PGBM11PT |
7 |
46 |
Posterior fossa |
PIK3C2G |
PGBM13PT |
2 |
9 |
Not available |
|
PGBM15PT |
5 |
30 |
Not available |
TP53 |
PGBM16PT |
13 |
32 |
Not available |
MET |
PGBM17PT |
18 |
27 |
Not available |
|
PGBM18PT |
20 |
33 |
Not available |
TP53, IDH1 |
PGBM20PT |
18 |
28 |
Right temporal |
BRAF |
PGBM32PT |
11 |
4 |
Not available |
RB1 |
PGBM33PT |
12 |
20 |
Cervical spinal cord |
H3F3A, TP53 |
Intracranial Ependymomas |
||||
Sample: |
Age: |
# of Mutations: |
Location: |
Mutations in Recognized Driver Genes: |
SE16PT |
8 |
5 |
Right parietal |
|
SE18PT |
2 |
7 |
Fourth ventricle |
|
SE20PT |
39 |
14 |
Posterior fossa |
|
SE21PT |
0.9 |
23 |
Left CP Angle |
|
SE22PT |
2 |
5 |
Right parietal |
|
SE30PT |
52 |
34 |
Left temporal |
PTEN, TP53 |
SE31PT |
7 |
9 |
Third ventricle |
|
SE35PT |
35 |
5 |
Fourth ventricle |
HIST1H3C |
Spinal Ependymomas |
||||
Sample: |
Age: |
# of Mutations: |
Location: |
Mutations in Recognized Driver Genes: |
SE1PT |
43 |
18 |
T2-3 |
NF2 |
SE3PT |
38 |
16 |
C4-6 |
|
SE4PT |
44 |
9 |
T3-4 |
|
SE5PT |
20 |
2 |
C3-5 |
|
SE6PT |
45 |
10 |
T3-4 |
NF2 |
SE7PT |
33 |
11 |
C3-5 |
NF2 |
SE8PT |
69 |
14 |
C2-4 |
NF2 |
SE9PT |
77 |
23 |
T6-T7 |
|
Discussion
Our data confirm the critical roles of several known driver genes in CNS neoplasms, including TP53 and ATRX in PGBM, and NF2 in SCEPs. One particular pathway that appears to be of increasingly recognized importance is the EGFR-MAPK pathway. In adults, it has been well appreciated that alterations of EGFR occur in a large fraction of glioblastomas[27, 28]. Recent work also suggests that this pathway may be dysregulated in adult oligodendrogliomas, the second most common adult malignant brain tumor[12]. In pediatric brain tumors, EGFR alterations are infrequent but our work and that of others suggests that activating BRAF mutations play a central role in both low and high grade glial tumors. Alterations in BRAF have been previously identified in both pediatric low and high grade astrocytomas. For example, cerebellar pilocytic astrocytomas commonly harbor KIAA1549:BRAF fusions[29], while V600E alterations have been reported in grade II-IV astrocytomas of childhood[30-32]. Here we describe the canonical V600E BRAF mutation in 60% of grade II PXA cases as well as in 13% of PGBM cases. While BRAF mutations have been previously evaluated in PXA[33], we here demonstrate that the prevalence of other alterations in the EGFR-MAPK pathway is rare. Interestingly, none of the 16 ependymoma samples contained alterations in the EGFR-MAPK pathway; this is consistent with the idea that tumorigenesis is driven by entirely different mechanisms in different cell types within the developing central nervous system. While there are ongoing clinical trials evaluating the efficacy of BRAF inhibitors in pediatric low grade astrocytomas, perhaps it is now worth screening all pediatric astrocytic tumors, including PXA and PGBM, for MAPK alterations in the hopes of enrolling patients with a tumor with one of these mutations in rationally designed therapeutic trials. In addition, one PXA sample had only one bona fide somatic alteration and that was in the BRAF gene. This suggest that PXAs in general do not have the complex genetic background of other BRAF driven tumors, such as melanoma, and may make them particularly susceptible to BRAF inhibition. Of note, the PXA sample that had progressed was shown to acquire mutations in RB1 and PIK3R1, both of which are known genetic drivers in GBM[34]. Unlike the other PXA samples, this tumor also contained an extremely high level of LOH even at the time of diagnosis of PXA, suggesting that this tumor was already more complex than most PXAs we studied.
Genes coding for members of the mTOR pathway were altered in 33% (4/12) of PXA samples. Ten of twelve PXA samples had an alteration in either BRAF or the mTOR pathway, in a mutually exclusive fashion, consistent with the idea that alterations of either one of these signaling cascades is required for tumorigenesis. The study of more of these rare tumors will be required to substantiate this suggestion. Recent data indicates that tumors with even infrequent alterations in the mTOR pathway can be sensitive to targeted inhibitors such as everolimus[35]. Further studies are required to investigate the utility of mTOR pathway inhibitors in the treatment of PXA, though it has proven efficacious in the treatment of sub-ependymal giant cell astrocytomas, another rare pediatric brain tumor[36].
Intriguingly, the rate of H3.3 mutations in PGBM was 2/23 (9%) in our cohort of non-brainstem glioblastoma, a frequency much lower than the 22-31% reported in recent publications[10, 11]. Some as yet unappreciated difference in the patients evaluated in our study compared to those evaluated in the other studies must exist. Of note, one of the two PGBM cases that harbored an alteration (K27M) in H3.3 arose from the cervical spinal cord. Given that brainstem PGBMs more commonly display mutations resulting in an amino acid substitution at K27, while supratentorial PGBMs display alterations at G34, it is possible that lesions arising from the spine more closely resemble those originating from the brainstem[10, 11, 32].
Our study supports the notion that pathologically identical tumors arising from different compartments of the CNS represent divergent disease processes with varied genetic makeup and differing clinical outcomes. The genetic heterogeneity based on tumor location was most apparent with the ependymoma samples (Table 4). For example, mutations of the NF2 gene were found exclusively in the SCEPs (9/19 samples) and never in the 40 IEPs studied (p< 0.0002; Student’s t-test). There were no recurrent mutations in IEPs, despite all 8 being grade 3 (anaplastic) ependymomas and NF2 was the only recurrent mutation in SCEPs. Overall, a very low frequency of mutations in both intracranial and spinal ependymomas was observed. One possible explanation for the lack of recurrent mutations is that the IEPs used in this study originated from different compartments of the brain. Of the 8 samples, 2 originated in the parietal lobe, 2 in the fourth ventricle, 1 in the third ventricle, 1 in the temporal lobe, 1 in the cerebello-pontine angle and 1 in the posterior fossa. Others have demonstrated that the expression profiles of ependymomas from the supratentorial compartment are different from those originating in the posterior fossa[37] and that even within the posterior fossa, there are at least two distinct molecular subtypes[38]. Ependymomas, may in fact represent a very heterogeneous class of tumors, each with distinct molecular profiles, as has been shown to be the case with PGBMs[32].
Developmentally, both astrocytes and ependymal cells originate from the ectoderm. However, the genetic profiles of PGBM and PXA are very different from that of IEPs and SCEPs. There were no shared driver mutations between the two classes of tumors. This likely indicates divergent inciting and pathogenic events that transform the respective cells of origin. In addition, it is possible that each of these tumors arise from different progenitor cells despite pathological and anatomic similarities.
The global genetic profiles of several malignancies, both adult and pediatric, have been published over the last five years. A few striking observations can be readily made from these and the current study: 1) the total number of mutations per pediatric tumor tends to be far fewer than adult malignancies; 2) even within childhood tumors, younger children tend to have fewer somatic alterations; 3) the number of recurrent mutations within a given tumor type is substantially less in childhood brain tumors than in adult tumors; 4) the great majority of the genes recurrently mutated in different tumor types are already well-studied, suggesting that there are a limited number of driver genes; 5) different core genes and pathways are altered in different types of pediatric malignancies; and 6) the most frequent single base substitution was a transition in all four tumor types analyzed.
As an example of these principles, we noted that the average number of mutations per PXA and IEP was 10 and 13, respectively, and for PGBM it was 25. In comparison, we found the average number of alterations in adult glioblastoma and anaplastic oligodendroglioma was 47 and 32, respectively[12, 24]. Even in PGBM, the most lethal childhood malignancy, there were samples with as few as 4 bona fide alterations. The overall number of mutations found in our PGBMs discovery set was comparable to what is reported in the literature. Furthermore, in our IEP discovery panel, there were three cases from adults and five pediatric cases. The average number of alterations per tumor in the adult cases was eighteen, while in the pediatric cases it was only ten.
In addition to the absolute number of mutations, the number of recurrent mutations was substantially lower in pediatric cancers. For example, in IEPs no genes were mutated in more than one sample, while in adult malignancies it is common to have a dozen or more genes recurrently mutated. Furthermore, the global genetic landscapes of pediatric and adult tumors appear to be fairly divergent. While certain genes/pathways such as TP53 are commonly mutated in both adult and pediatric glioblastomas, only two of the pediatric tumors contained a change in IDH1 and none harbored alterations in IDH2, PTEN or EGFR. Conversely, PGBMs had a much higher frequency of ATRX mutations when compared to primary adult glioblastoma.
Despite the heterogeneity of the genetic makeup of the four tumor subtypes analyzed, the mutational spectra were quite similar. Of note, the most common single base pair substitutions in all 4 tumor types were C:G>T:A transitions. This is a phenomenon observed in multiple CNS and non-CNS tumors and suggests susceptibility in the genome to these types of alterations.
In composite, our data suggest that CNS tumors, even those that are pathologically identical, have different molecular mechanisms that underlie their pathogenesis depending on the age of the individual and the cellular compartment from which the malignancy arises. Given the rarity of pediatric brain tumors, many clinicians are forced to draw conclusions about management paradigms based on experience and data generated from analogous adult tumors or from similar tumors arising in different parts of the central nervous system. Our findings highlight the potential perils of this approach.
Methods
Preparation of tumor and matched normal samples
Fresh-frozen surgically resected tumor and matched blood were obtained from patients under an Institutional Review Board (IRB)-approved protocol from Johns Hopkins Hospital, Duke University, or University of São Paulo School of Medicine. The diagnosis of each specimen underwent central pathological review and was verified by an independent group of pathologists. Tumor tissue was analyzed by frozen section to assess neoplastic cellularity. Tumors were macrodissected to remove residual normal tissue and enhance neoplastic cellularity, as confirmed by serial frozen sections. An estimated average of 80% neoplastic cellularity was obtained.
Preparation of Genomic DNA libraries
Genomic DNA libraries were prepared following Illumina’s (Illumina, San Diego, CA) suggested protocol with the following modifications. (1) 3 micrograms (µg) of genomic DNA from tumor or normal cells in 100 microliters (µl) of TE was fragmented in a Covaris sonicator (Covaris, Woburn, MA) to a size of 100-500 bp. DNA was purified with a PCR purification kit (Cat # 28104, Qiagen, Valencia, CA) and eluted in 35 µl of elution buffer included in the kit. (2) Purified, fragmented DNA was mixed with 40 µl of H2O, 10 µl of 10 x T4 ligase buffer with 10 mM ATP, 4 µl of 10 mM dNTP, 5 µl of T4 DNA polymerase, 1 µl of Klenow Polymerase, and 5 µl of T4 polynucleotide kinase. All reagents used for this step and those described below were from New England Biolabs (NEB, Ipswich, MA) unless otherwise specified. The 100 µl end-repair mixture was incubated at 20oC for 30 min, purified by a PCR purification kit (Cat # 28104, Qiagen) and eluted with 32 µl of elution buffer (EB). (3) To A-tail, all 32 µl of end-repaired DNA was mixed with 5 µl of 10 x Buffer (NEB buffer 2), 10 µl of 1 mM dATP and 3 µl of Klenow (exo-). The 50 µl mixture was incubated at 37oC for 30 min before DNA was purified with a MinElute PCR purification kit (Cat # 28004, Qiagen). Purified DNA was eluted with 12.5 µl of 70oC EB and obtained with 10 µl of EB. (4) For adaptor ligation, 10 µl of A-tailed DNA was mixed with 10 µl of PE-adaptor (Illumina), 25 µl of 2x Rapid ligase buffer and 5 µl of Rapid Ligase. The ligation mixture was incubated at room temperature (RT) or 20oC for 15 min. (5) To purify adaptor- ligated DNA, 50 µl of ligation mixture from step (4) was mixed with 200 µl of NT buffer from NucleoSpin Extract II kit (cat# 636972, Clontech, Mountain View, CA) and loaded into a NucleoSpin column. The column was centrifuged at 14,000 g in a desktop centrifuge for 1 min, washed once with 600 µl of wash buffer (NT3 from Clontech), and centrifuged again for 2 min to dry completely. DNA was eluted in 50 µl elution buffer included in the kit. (6) To obtain an amplified library, ten PCRs of 25 µl each were set up, each including 13.25 µl of H2O, 5 µl of 5 x Phusion HF buffer, 0.5 µl of a dNTP mix containing 10 mM of each dNTP, 0.5 µl of Illumina PE primer #1, 0.5 µl of Illumina PE primer #2, 0.25 µl of Hotstart Phusion polymerase, and 5 µl of the DNA from step (5). The PCR program used was: 98oC 1 minute; 6 cycles of 98oC for 20 seconds, 65oC for 30 seconds, 72 oC for 30 seconds; and 72 oC for 5 min. To purify the PCR product, 250 µl PCR mixture (from the ten PCR reactions) was mixed with 500 µl NT buffer from a NucleoSpin Extract II kit and purified as described in step (5). Library DNA was eluted with 70oC elution buffer and the DNA concentration was estimated by absorption at 260 nm.
Exome DNA Capture
Human exome capture was performed following a protocol from Agilent’s SureSelect Paired-End Version 2.0 Human Exome Kit (Agilent, Santa Clara, CA) with the following modifications. (1) A hybridization mixture was prepared containing 25 µl of SureSelect Hyb # 1, 1 µl of SureSelect Hyb # 2, 10 µl of SureSelect Hyb # 3, and 13 µl of SureSelect Hyb # 4. (2) 3.4 µl (0.5 µg) of the PE-library DNA described above, 2.5 µl of SureSelect Block #1, 2.5 µl of SureSelect Block #2 and 0.6 µl of Block #3; was loaded into one well in a 384-well Diamond PCR plate (cat# AB-1111, Thermo-Scientific, Lafayette, CO), sealed with microAmp clear adhesive film (cat# 4306311; ABI, Carlsbad, CA) and placed in GeneAmp PCR system 9700 thermocycler (Life Sciences Inc., Carlsbad CA) for 5 minutes at 95°C, then held at 65°C (with the heated lid on). (3) 25-30 µl of hybridization buffer from step (1) was heated for at least 5 minutes at 65°C in another sealed plate with heated lid on. (4) 5 µl of SureSelect Oligo Capture Library, 1 µl of nuclease-free water, and 1 µl of diluted RNase Block (prepared by diluting RNase Block 1: 1 with nuclease-free water) were mixed and heated at 65oC for 2 minutes in another sealed 384-well plate. (5) While keeping all reactions at 65°C, 13 µl of Hybridization Buffer from Step (3) was added to the 7 µl of the SureSelect Capture Library Mix from Step (4) and then the entire contents (9 µl) of the library from Step (2). The mixture was slowly pipetted up and down 8 to 10 times. (6) The 384-well plate was sealed tightly and the hybridization mixture was incubated for 24 hours at 65°C with a heated lid.
After hybridization, five steps were performed to recover and amplify captured DNA library: (1) Magnetic beads for recovering captured DNA: 50 µl of Dynal MyOne Streptavidin C1 magnetic beads (Cat # 650.02, Invitrogen Dynal, AS Oslo, Norway) was placed in a 1.5 ml microfuge tube and vigorously resuspended on a vortex mixer. Beads were washed three times by adding 200 µl of SureSelect Binding buffer, mixing on a vortex for five seconds and then removing the supernatant after placing the tubes in a Dynal magnetic separator. After the third wash, beads were resuspended in 200 µl of SureSelect Binding buffer. (2) To bind captured DNA, the entire hybridization mixture described above (29 µl) was transferred directly from the thermocycler to the bead solution and mixed gently; the hybridization mix/bead solution was incubated in an Eppendorf thermomixer at 850 rpm for 30 minutes at room temperature. (3) To wash the beads, the supernatant was removed from beads after applying a Dynal magnetic separator and the beads were resuspended in 500 µl SureSelect Wash Buffer #1 by mixing on vortex mixer for 5 seconds, then incubated for 15 minutes at room temperature. Wash Buffer #1 was then removed from beads after magnetic separation. The beads were further washed three times, each with 500 µl pre-warmed SureSelect Wash Buffer #2 after incubation at 65°C for 10 minutes. After the final wash, SureSelect Wash Buffer #2 was completely removed. (4) To elute captured DNA, the beads were suspended in 50 µl SureSelect Elution Buffer, vortex-mixed and incubated for 10 minutes at room temperature. The supernatant was removed after magnetic separation, collected in a new 1.5 ml microcentrifuge tube, and mixed with 50 µl of SureSelect Neutralization Buffer. DNA was purified with a Qiagen MinElute column and eluted in 17 µl of 70oC EB to obtain 15 µl of captured DNA library. (5) The captured DNA library was amplified in the following way: 15 PCR reactions each containing 9.5 µl of H2O, 3 µl of 5 x Phusion HF buffer, 0.3 µl of 10 mM dNTP, 0.75 µl of DMSO, 0.15 µl of Illumina PE primer #1, 0.15µl of Illumina PE primer #2, 0.15 µl of Hotstart Phusion polymerase, and 1 µl of captured exome library were set up. The PCR program used was: 98oC for 30 seconds; 14 cycles of 98oC for 10 seconds, 65oC for 30 seconds, 72oC for 30 seconds; and 72oC for 5 min. To purify PCR products, 225µl PCR mixture (from 15 PCR reactions) was mixed with 450 µl NT buffer from NucleoSpin Extract II kit and purified as described above. The final library DNA was eluted with 30 µl of 70oC elution buffer and DNA concentration was estimated by OD260 measurement.
Somatic Mutation Identification by Massively Parallel Sequencing
Captured DNA libraries were sequenced with the Illumina GAIIx Genome Analyzer, yielding 150 (2 X 75) base pairs from the final library fragments. Sequencing reads were analyzed and aligned to human genome hg18 with the Eland algorithm in CASAVA 1.6 software (Illumina). A mismatched base was identified as a mutation only when (i) it was identified by more than five distinct reads; (ii) the number of distinct reads containing a particular mismatched base was at least 10% of the total distinct reads; and (iii) it was not present in >0.5% of the reads in the matched normal sample. “Distinct reads” were defined as reads that had different sequences at either the 5’ or 3’ end of the sequenced fragment, thereby indicating that they originated from different template molecules. SNP search databases included the NCBI’s database (http://www.ncbi.nlm.nih.gov/projects/SNP/).
Evaluation of Genes in Additional Tumors and Matched Normal Controls.
For select genes mutated in more than one discovery sample, the coding region was sequenced in additional specimens when available. PCR amplification and Sanger sequencing were performed following protocols described previously[23].
Acknowledgements
We thank our patients for their courage and generosity. We also thank J. Ptak, N. Silliman, L. Dobbyn, J. Schaeffer and D. Singh. The work was supported by the Virginia and D.K. Ludwig Fund for Cancer Research, Pediatric Brain Tumor Foundation, Malia’s Cord Foundation, Burroughs Wellcome Career Award for Medical Scientists, Johns Hopkins Clinical Scientist Award, RC2DE020957, 5R01-CA140316, CA057345, American Cancer Society Research Scholar Award RSG-10-126-01-CCE, FAPESP 01/12898-4 and FAPESP 04/12133-6.
Conflict of Interest
Under agreements between the Johns Hopkins University, Genzyme, Exact Sciences, Inostics, Qiagen, Invitrogen and Personal Genome Diagnostics, NP, BV, VV and KK are entitled to a share of the royalties received by the University on sales of products related to genes and technologies described in this manuscript. NP, BV, VV and KK are co-founders of Inostics and Personal Genome Diagnostics, are members of their Scientific Advisory Boards, and own Inostics and Personal Genome Diagnostics stock, which is subject to certain restrictions under Johns Hopkins University policy. The terms of these arrangements are managed by the Johns Hopkins University in accordance with its conflict-of-interest policies.
References
1. Cancer Facts & Figures 2012. American Cancer Society. 2012.
2. Parsons DW, Li M, Zhang X, Jones S, Leary RJ, Lin JC, Boca SM, Carter H, Samayoa J, Bettegowda C, Gallia GL, Jallo GI, Binder ZA, Nikolsky Y, Hartigan J, Smith DR, et al. The genetic landscape of the childhood cancer medulloblastoma. Science. 2011; 331(6016):435-439.
3. Rausch T, Jones DT, Zapatka M, Stutz AM, Zichner T, Weischenfeldt J, Jager N, Remke M, Shih D, Northcott PA, Pfaff E, Tica J, Wang Q, Massimi L, Witt H, Bender S, et al. Genome sequencing of pediatric medulloblastoma links catastrophic DNA rearrangements with TP53 mutations. Cell. 148(1-2):59-71.
4. Jones DT, Jager N, Kool M, Zichner T, Hutter B, Sultan M, Cho YJ, Pugh TJ, Hovestadt V, Stutz AM, Rausch T, Warnatz HJ, Ryzhova M, Bender S, Sturm D, Pleier S, et al. Dissecting the genomic complexity underlying medulloblastoma. Nature. 2012; 488(7409):100-105.
5. Robinson G, Parker M, Kranenburg TA, Lu C, Chen X, Ding L, Phoenix TN, Hedlund E, Wei L, Zhu X, Chalhoub N, Baker SJ, Huether R, Kriwacki R, Curley N, Thiruvenkatam R, et al. Novel mutations target distinct subgroups of medulloblastoma. Nature. 488(7409):43-48.
6. Pugh TJ, Weeraratne SD, Archer TC, Pomeranz Krummel DA, Auclair D, Bochicchio J, Carneiro MO, Carter SL, Cibulskis K, Erlich RL, Greulich H, Lawrence MS, Lennon NJ, McKenna A, Meldrim J, Ramos AH, et al. Medulloblastoma exome sequencing uncovers subtype-specific somatic mutations. Nature. 488(7409):106-110.
7. Yan H, Parsons DW, Jin G, McLendon R, Rasheed BA, Yuan W, Kos I, Batinic-Haberle I, Jones S, Riggins GJ, Friedman H, Friedman A, Reardon D, Herndon J, Kinzler KW, Velculescu VE, et al. IDH1 and IDH2 mutations in gliomas. N Engl J Med. 2009; 360(8):765-773.
8. Jiao Y, Killela PJ, Reitman ZJ, Rasheed AB, Heaphy CM, de Wilde RF, Rodriguez FJ, Rosemberg S, Oba-Shinjo SM, Nagahashi Marie SK, Bettegowda C, Agrawal N, Lipp E, Pirozzi C, Lopez G, He Y, et al. Frequent ATRX, CIC, and FUBP1 mutations refine the classification of malignant gliomas. Oncotarget. 2012; 3(7):709-722.
9. Cancer Genome Atlas Research N. Comprehensive genomic characterization defines human glioblastoma genes and core pathways. Nature. 2008; 455(7216):1061-1068.
10. Wu G, Broniscer A, McEachron TA, Lu C, Paugh BS, Becksfort J, Qu C, Ding L, Huether R, Parker M, Zhang J, Gajjar A, Dyer MA, Mullighan CG, Gilbertson RJ, Mardis ER, et al. Somatic histone H3 alterations in pediatric diffuse intrinsic pontine gliomas and non-brainstem glioblastomas. Nat Genet. 2012; 44(3):251-253.
11. Schwartzentruber J, Korshunov A, Liu XY, Jones DT, Pfaff E, Jacob K, Sturm D, Fontebasso AM, Quang DA, Tonjes M, Hovestadt V, Albrecht S, Kool M, Nantel A, Konermann C, Lindroth A, et al. Driver mutations in histone H3.3 and chromatin remodelling genes in paediatric glioblastoma. Nature. 2012; 482(7384):226-231.
12. Bettegowda C, Agrawal N, Jiao Y, Sausen M, Wood LD, Hruban RH, Rodriguez FJ, Cahill DP, McLendon R, Riggins G, Velculescu VE, Oba-Shinjo SM, Marie SK, Vogelstein B, Bigner D, Yan H, et al. Mutations in CIC and FUBP1 contribute to human oligodendroglioma. Science. 2011; 333(6048):1453-1455.
13. Yip S, Butterfield YS, Morozova O, Chittaranjan S, Blough MD, An J, Birol I, Chesnelong C, Chiu R, Chuah E, Corbett R, Docking R, Firme M, Hirst M, Jackman S, Karsan A, et al. Concurrent CIC mutations, IDH mutations, and 1p/19q loss distinguish oligodendrogliomas from other cancers. J Pathol. 2012; 226(1):7-16.
14. Rao AA, Laack NN, Giannini C and Wetmore C. Pleomorphic xanthoastrocytoma in children and adolescents. Pediatr Blood Cancer. 2010; 55(2):290-294.
15. Giannini C, Scheithauer BW, Burger PC, Brat DJ, Wollan PC, Lach B and O’Neill BP. Pleomorphic xanthoastrocytoma: what do we really know about it? Cancer. 1999; 85(9):2033-2045.
16. Marton E, Feletti A, Orvieto E and Longatti P. Malignant progression in pleomorphic xanthoastrocytoma: personal experience and review of the literature. J Neurol Sci. 2007; 252(2):144-153.
17. Broniscer A and Gajjar A. Supratentorial high-grade astrocytoma and diffuse brainstem glioma: two challenges for the pediatric oncologist. Oncologist. 2004; 9(2):197-206.
18. MacDonald TJ, Aguilera D and Kramm CM. Treatment of high-grade glioma in children and adolescents. Neuro Oncol. 13(10):1049-1058.
19. Reddy AT and Wellons JC, 3rd. Pediatric high-grade gliomas. Cancer J. 2003; 9(2):107-112.
20. Kilday JP, Rahman R, Dyer S, Ridley L, Lowe J, Coyle B and Grundy R. Pediatric ependymoma: biological perspectives. Mol Cancer Res. 2009; 7(6):765-786.
21. Milano MT, Johnson MD, Sul J, Mohile NA, Korones DN, Okunieff P and Walter KA. Primary spinal cord glioma: a Surveillance, Epidemiology, and End Results database study. J Neurooncol. 2012; 98(1):83-92.
22. Agrawal N, Frederick MJ, Pickering CR, Bettegowda C, Chang K, Li RJ, Fakhry C, Xie TX, Zhang J, Wang J, Zhang N, El-Naggar AK, Jasser SA, Weinstein JN, Trevino L, Drummond JA, et al. Exome sequencing of head and neck squamous cell carcinoma reveals inactivating mutations in NOTCH1. Science. 2011; 333(6046):1154-1157.
23. Agrawal N, Jiao Y, Bettegowda C, Hutfless SM, Wang Y, David S, Cheng Y, Twaddell WS, Latt NL, Shin EJ, Wang LD, Wang L, Yang W, Velculescu VE, Vogelstein B, Papadopoulos N, et al. Comparative Genomic Analysis of Esophageal Adenocarcinoma and Squamous Cell Carcinoma. Cancer Discov. 2012; 2(10):899-905.
24. Parsons DW, Jones S, Zhang X, Lin JC, Leary RJ, Angenendt P, Mankoo P, Carter H, Siu IM, Gallia GL, Olivi A, McLendon R, Rasheed BA, Keir S, Nikolskaya T, Nikolsky Y, et al. An integrated genomic analysis of human glioblastoma multiforme. Science. 2008; 321(5897):1807-1812.
25. Agrawal N, Frederick MJ, Pickering CR, Bettegowda C, Chang K, Li RJ, Fakhry C, Xie TX, Zhang J, Wang J, Zhang N, El-Naggar AK, Jasser SA, Weinstein JN, Trevino L, Drummond JA, et al. Exome Sequencing of Head and Neck Squamous Cell Carcinoma Reveals Inactivating Mutations in NOTCH1. Science. 2011.
26. Agrawal N, Jiao Y, Sausen M, Leary R, Bettegowda C, Roberts NJ, Bhan S, Ho AS, Khan Z, Bishop J, Westra WH, Wood LD, Hruban RH, Tufano RP, Robinson B, Dralle H, et al. Exomic Sequencing of Medullary Thyroid Cancer Reveals Dominant and Mutually Exclusive Oncogenic Mutations in RET and RAS. J Clin Endocrinol Metab. 2012.
27. Dunn GP, Rinne ML, Wykosky J, Genovese G, Quayle SN, Dunn IF, Agarwalla PK, Chheda MG, Campos B, Wang A, Brennan C, Ligon KL, Furnari F, Cavenee WK, Depinho RA, Chin L, et al. Emerging insights into the molecular and cellular basis of glioblastoma. Genes Dev. 2012; 26(8):756-784.
28. Wong AJ, Ruppert JM, Bigner SH, Grzeschik CH, Humphrey PA, Bigner DS and Vogelstein B. Structural alterations of the epidermal growth factor receptor gene in human gliomas. Proc Natl Acad Sci U S A. 1992; 89(7):2965-2969.
29. Jones DT, Kocialkowski S, Liu L, Pearson DM, Backlund LM, Ichimura K and Collins VP. Tandem duplication producing a novel oncogenic BRAF fusion gene defines the majority of pilocytic astrocytomas. Cancer Res. 2008; 68(21):8673-8677.
30. Schiffman JD, Hodgson JG, VandenBerg SR, Flaherty P, Polley MY, Yu M, Fisher PG, Rowitch DH, Ford JM, Berger MS, Ji H, Gutmann DH and James CD. Oncogenic BRAF mutation with CDKN2A inactivation is characteristic of a subset of pediatric malignant astrocytomas. Cancer Res. 2010; 70(2):512-519.
31. Horbinski C, Hamilton RL, Nikiforov Y and Pollack IF. Association of molecular alterations, including BRAF, with biology and outcome in pilocytic astrocytomas. Acta Neuropathol. 2010; 119(5):641-649.
32. Sturm D, Witt H, Hovestadt V, Khuong-Quang DA, Jones DT, Konermann C, Pfaff E, Tonjes M, Sill M, Bender S, Kool M, Zapatka M, Becker N, Zucknick M, Hielscher T, Liu XY, et al. Hotspot Mutations in H3F3A and IDH1 Define Distinct Epigenetic and Biological Subgroups of Glioblastoma. Cancer Cell. 2012; 22(4):425-437.
33. Dias-Santagata D, Lam Q, Vernovsky K, Vena N, Lennerz JK, Borger DR, Batchelor TT, Ligon KL, Iafrate AJ, Ligon AH, Louis DN and Santagata S. BRAF V600E mutations are common in pleomorphic xanthoastrocytoma: diagnostic and therapeutic implications. PLoS One. 2011; 6(3):e17948.
34. Comprehensive genomic characterization defines human glioblastoma genes and core pathways. Nature. 2008; 455(7216):1061-1068.
35. Iyer G, Hanrahan AJ, Milowsky MI, Al-Ahmadie H, Scott SN, Janakiraman M, Pirun M, Sander C, Socci ND, Ostrovnaya I, Viale A, Heguy A, Peng L, Chan TA, Bochner B, Bajorin DF, et al. Genome sequencing identifies a basis for everolimus sensitivity. Science. 2012; 338(6104):221.
36. Krueger DA, Care MM, Holland K, Agricola K, Tudor C, Mangeshkar P, Wilson KA, Byars A, Sahmoud T and Franz DN. Everolimus for subependymal giant-cell astrocytomas in tuberous sclerosis. N Engl J Med. 2010; 363(19):1801-1811.
37. Johnson RA, Wright KD, Poppleton H, Mohankumar KM, Finkelstein D, Pounds SB, Rand V, Leary SE, White E, Eden C, Hogg T, Northcott P, Mack S, Neale G, Wang YD, Coyle B, et al. Cross-species genomics matches driver mutations and cell compartments to model ependymoma. Nature. 2010; 466(7306):632-636.
38. Witt H, Mack SC, Ryzhova M, Bender S, Sill M, Isserlin R, Benner A, Hielscher T, Milde T, Remke M, Jones DT, Northcott PA, Garzia L, Bertrand KC, Wittmann A, Yao Y, et al. Delineation of two clinically and molecularly distinct subgroups of posterior fossa ependymoma. Cancer Cell. 2011; 20(2):143-157.