
Introduction
Aflatoxins, secondary metabolites produced in feedstuffs by Aspergillus flavus and Aspergillus parasiticus, which cause health and economic problems when they contaminate food and feed. These mycotoxins are difuranocoumarin compounds and include B1, B2, G1, G2, M1 and M2 [1]. Of these toxins, aflatoxin B1 (AFB1) is the most commonly encountered and it is considered to have higher toxicity than other aflatoxins. AFB1 also has potent hepatotoxic, genotoxic, immunotoxic and other adverse effects in many animal species including humans [1, 2-4].
The eukaryotic cell cycle is central to maintain homeostasis in the multicellular organisms [5, 6]. In response to various types of DNA damages, the cell cycle regulatory molecules and cell death signals are activated to stop cell growth and to eliminate multiplication of genetically altered cells [7, 8]. AFB1 could cause significant increase of S-phase cell population in murine macrophages and human bronchial epithelial cells in vitro [9, 10]. In murine models, a significantly greater proportion of lung cells were found to enter cell cycle with extended S-phase due to AFB1 treatment [11]. Scott et al. [2] have demonstrated that AFB1 treatment can lead to an accumulation of chicken thymocytes in G2/M phase in vitro. Our previous studies suggest that AFB1 induced jejunal cell arrest at G2/M phase and renal cell arrest at G0/G1 phase in broilers [12, 13].
The small intestine is the primary digestive apparatus of animals, and AFB1 transfer across the gastrointestinal wall is an apparently important step in the fate of the toxin in the animal body [14, 15]. As part of the small intestine, the jejunum is the major component of the gastrointestinal tract. Although there are some studies on cell cycle arrest induced by AFB1, few reports focus on the relationship between AFB1 and cell cycle in the jejunum, and the exact mechanism of G2/M cell cycle arrest induced by AFB1 in jejunum has not been elucidated. To address this, we used a broiler model to examine the effects of dietary AFB1 in jejunum. We analyzed the histological changes of jejunum, the cell cycle, and the protein and mRNA expression levels of regulatory molecules involved in G2/M transition. The results could provide helpful information for the further studies in human and other animals in the future.
Results
Pathological observation of jejunum
Compared with the control group, the epithelial cells in the apical region of jejunal villus were shedding in the AFB1 group at 7, 14 and 21 days of age (Figure 1).
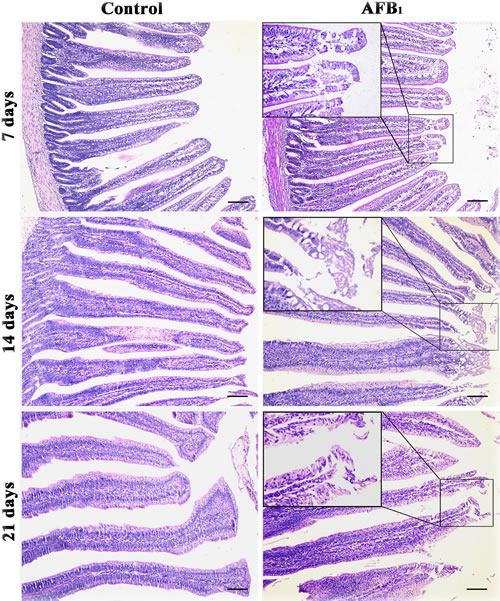
Figure 1: Histological structures of jejunum at 7, 14 and 21 days of age (H.E staining, scale bar: 100 μm).
Villus height, crypt depth and villus/crypt ratio in the jejunum
The villus heights in the AFB1 group were significantly lower than those in the control group at 14 and 21 days of age (p < 0.01), with the exception of villus height on day 7 which did not show a significant decrease in comparison to that in the control group (p > 0.05). The crypt depth in the AFB1 group significantly increased at 7, 14 and 21 days of age (p < 0.05 or 0.01), when compared with that in the control group. In addition, the villus/crypt ratios in the AFB1 group were significantly lower than those in the control group at 7, 14 and 21 days of age (p < 0.01) (Figure 2).
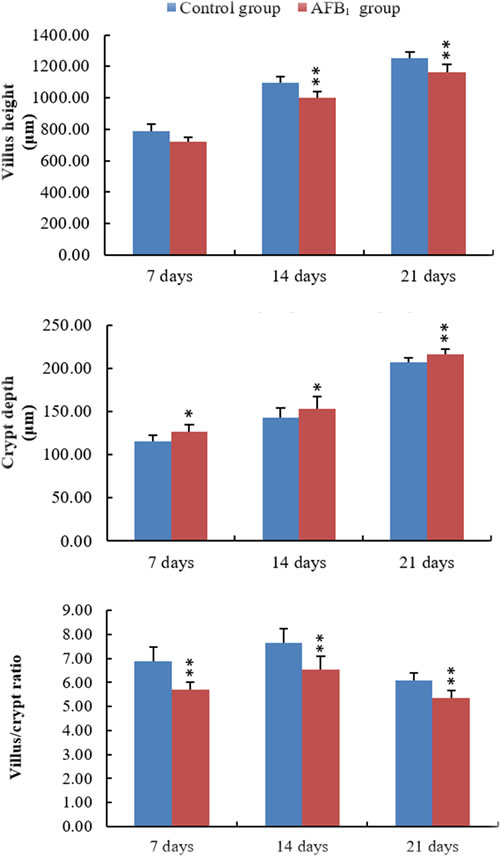
Figure 2: The values of villus height, crypt depth and villus/crypt ratio in the jejunum. Note: data are presented with the means ± standard deviation (n = 6).*p < 0.05, **p < 0.01 compared with control group.
Cell cycle in the jejunal mucosa
The percentage of cells in G0/G1 phase was significantly lower in the AFB1 group than that in the control group at 21 days of age(p < 0.05), but the change was not obvious at 7 and 14 days of age (p > 0.05). The cell percentages of G2/M phase were significantly higher in the AFB1 group than those in the control group at 7, 14 and 21 days of age (p < 0.01). No significant differences in cell percentage of S phase were noted between two groups at 7, 14 and 21 days (p > 0.05) (Figure 3).
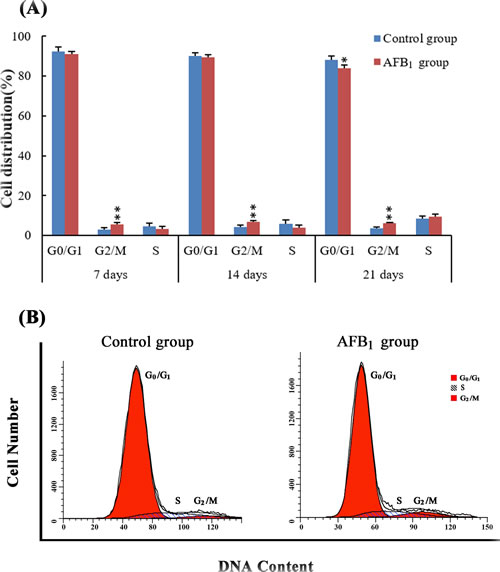
Figure 3: The cell cycle of jejunal mucosa by flow cytometry. Panel A: Percentage of cells in G0/G1, S and G2/M phases. Data are presented with the means ± standard deviation (n = 6) *p < 0.05, **p < 0.01 compared with control group. Panel B: Flow cytometric analysis of cell cycle distribution in the jejunal mucosa cells at 14 days of age, showing cell cycle arrest in G2/M phase induced by AFB1.
Expression of cell cycle regulatory molecule proteins by immunohistochemistry
Stained brownish-yellow, the expression of G2/M cell cycle regulatory molecule proteins is shown in Figure 4, 5 and 6. Control sections showed negative reaction (Figure 5).
The p-ATM protein expression was significantly increased (p < 0.01) in the AFB1 group at 7, 14 and 21 days of age, when compared with those in the control group. The p53 and p21 protein expression were significantly higher (p < 0.01) in the AFB1 group at 7, 14 and 21 days of age than those in the control group. But compared with the control group, the PCNA protein expression in the AFB1 group was significantly decreased at 7, 14 and 21 days of age (p < 0.05 or 0.01) (Figure 6).
The p-Chk2 protein expression was significantly higher (p < 0.01) in the AFB1 group than that in the control group from 7 to 21 days of age. The p-cdc25C and cyclin B protein expression were significantly decreased (p < 0.01) in the AFB1 group at 7, 14 and 21 days of age compared with those in the control group (Figure 6).
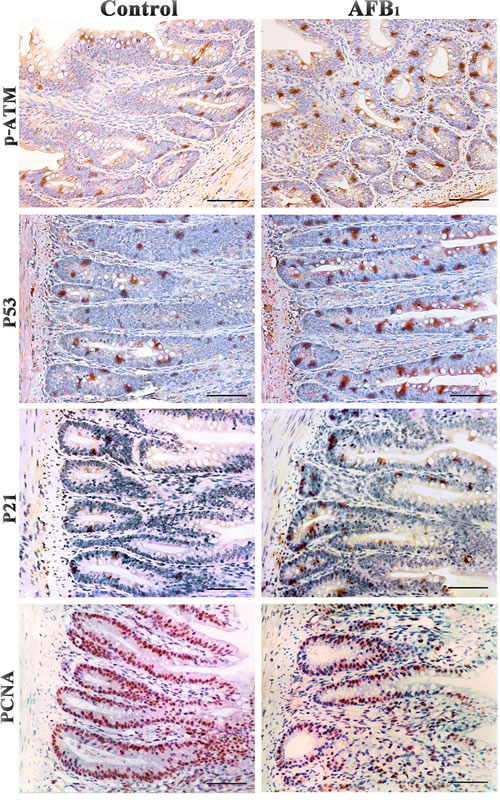
Figure 4: Expression of p-ATM, p53, p21 and PCNA protein in the jejunum at 14 days of age (Immunohistochemistry, scale bar: 50μm).
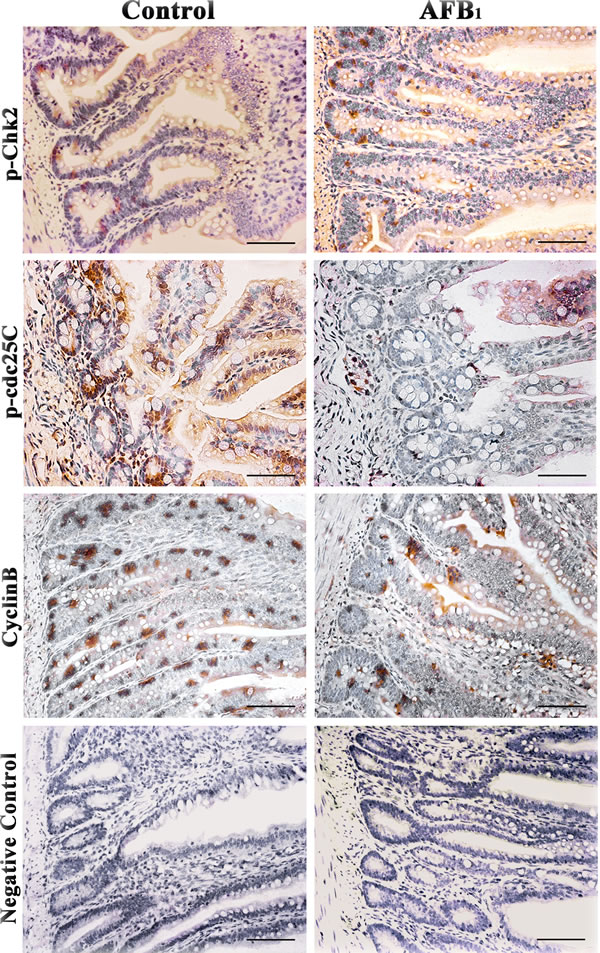
Figure 5: Expression of p-Chk2, p-cdc25C and cyclinB protein in the jejunum at 14 days of age (Immunohistochemistry, scale bar: 50μm).
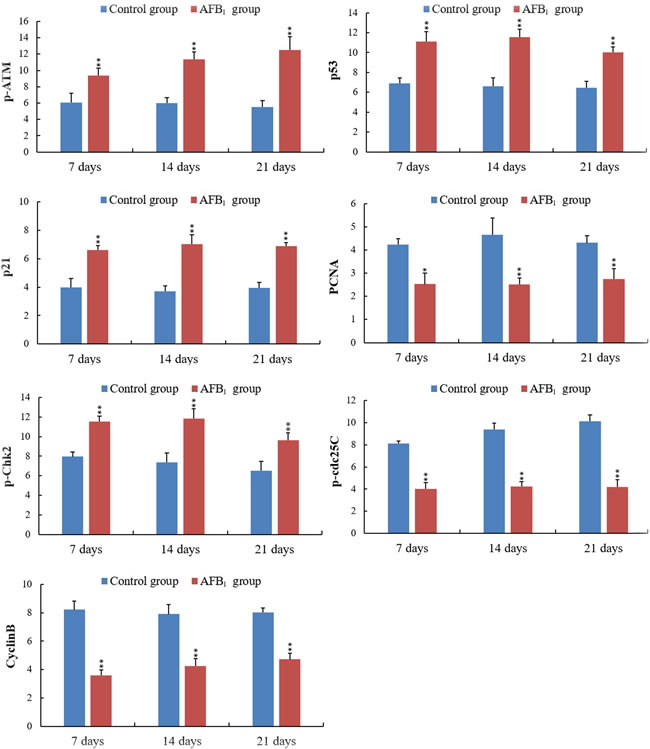
Figure 6: Integrated optical density (IOD) of p-ATM, p53, p21, PCNA, p-Chk2, p-cdc25C and CyclinB protein expression in the jejunum. Note: Data are presented with the mean ± standard deviation (n = 6).*p < 0.05, **p < 0.01 compared with the control group.
The expression of cell cycle regulatory mRNA by qRT-PCR
When compared with the control group, the mRNA expression levels of ATM, Chk2 and CyclinB3 in the AFB1 group were obviously increased at 7,14 and 21 days of age (p < 0.05 or 0.01). The mRNA expression of cdc25 was decreased at 14 and 21 days of age (p < 0.01), but not significantly dropped at 7 days of age (p > 0.5). And the expression levels of cdc2 mRNA in the AFB1 group were obviously decreased at 7 and 21 days of age (p < 0.05 or 0.01), but not significantly changed at 14 days of age compared with the control group (p > 0.5) (Figure 7).
The mRNA expression of p53 and p21 was obviously increased at 7, 14 and 21 days of age after exposure to AFB1 (p < 0.05 or 0.01). The mRNA expression of Mdm2 and PCNA became significantly decreased at 7, 14 and 21 days of age compared with those of the control group (p < 0.01) except for PCNA (Figure 7).
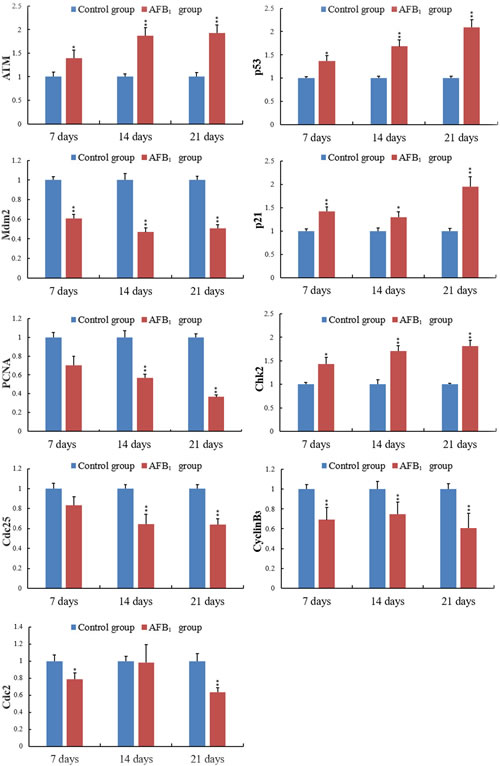
Figure 7: The levels of the ATM, Chk2, cdc25, CyclinB3, cdc2, mdm2, p53, p21 and PCNA mRNA expression in the jejunal mucosa. Note: Data are presented with the mean ± standard deviation (n = 6).*p < 0.05, **p < 0.01 compared with the control group.
Discussion
According to previous [12] and present researches, AFB1 retarded the development of jejunum, including the shedding of villus and the reduction of the villus height and villus height/crypt ratio, which may be dependent on the decreased abilities of cell proliferation. As we know, the shedding of villus should be responsible for lower villus height. However, significant lower villus heights were observed in the AFB1 group at 14 and 21 days and not at 7 days in this study. The reason for this may be complicated because villus growth involves epithelial cell proliferation rates, migration rates of epithelial cells from the crypts to the villus tip, or apoptosis and exfoliation rates of epithelial cells [16]. Therefore, besides shedding, other factors may also be responsible for lower villus height. In addition, the morphological modifications reported in Figure 1 were that the epithelial cells in the apical region of jejunal villus were shedding. As reported in Figure 3 lower percentage of cells in G0/G1 is observed only at 21 days and is only minor in the AFB1 group. This means that cell proliferation is lightly increased. The possible relevance of these changes to the morphological modifications reported in Figure 1 is that the enhancement of cell proliferation might be attributed to the repair ability due to the continuous damage to the epithelial cells which is the protective mechanism of the organism. But the key finding is that AFB1 induced jejunal cell cycle arrest at the G2/M phase, which was in line with our earlier research [12]. However, the mechanism of G2/M cell cycle arrest induced by AFB1 is unclear.
In this present study, the G2/M phase cell cycle regulatory molecules were measured in order to define the molecular mechanism of AFB1-induced G2/M phase arrest in broiler’s jejunum. The ataxia telangiectasia mutated (ATM) plays a critical role in the activation of cell cycle checkpoints [17]. The ATM pathway responds mainly to DNA double strand breaks but also to other types of DNA damage [18]. The central position of ATM in the maintenance of genomic stability becomes apparent by its involvement in checkpoint regulation at the G2/M transition [19, 20]. At the DNA-damage, ATM activates Chk2 by phosphorylation [21], and then the Chk2 influences the stabilization of p53 [22]. Chk2 can induce G2/M cell cycle arrest through p53 up-regulation [22, 23]. Furthermore, AFB1 is metabolized to aflatoxin-8, 9-epoxide by cytochrome P450 (CYP450) microsomal enzymes, and the reactive aflatoxin-8, 9-epoxide can cause DNA damage [24]. In the present study, our results showed that AFB1 caused the increase of ATM, p-Chk2 and p53 protein and mRNA expression, suggesting that AFB1 activated the ATM signal transduction pathways by up-regulation of ATM, Chk2 and p53. Therefore, AFB1 induced G2/M cell cycle arrest via two different routes: the ATM-p53 and the ATM-Chk2 pathways. Similarly, Yang et al. [10] reported that ATM, ATR, Chk2 and p53 were up-regulated by AFB1 in B-2A13 cells. Gursoy-Yuzugullu et al. [25] found that AFB1 induced accumulation of p53 in HepG2 hepatoma cells.
P53 is a crucial mediator of at least two or more cellular responses to a variety of DNA damage: apoptosis, DNA repair and cell cycle arrest [26]. In normal conditions, p53 levels are low due to continuous Mdm2-mediated ubiquitination and degradation, and the activation of Mdm2 by p53 is required to reverse the inhibitory effects of p53 on cell cycle progression [27]. P53 can induce p21 up-regulation, which causes cells to arrest in G2/M phase [28]. Furthermore, p21 induces cell cycle arrest at G2/M phase by inhibiting cdc2 [29, 30]. An inactive cdc2/cyclin B complex does not allow cells to progress beyond the G2/M cell-cycle checkpoint. Meanwhile, p21 inhibits DNA replication and maintains G2/M cell cycle arrest through the binding to PCNA and the reduction of PCNA [31-33]. The PCNA, as a marker of proliferation, takes part in DNA biological synthesis and regulates cell cycle [34, 35]. The limitation of cdc2/cyclin B complex formation and the down-regulation of PCNA expression block the passage of cells to mitosis [31, 36]. In this study, our results showed that AFB1 caused the increase of p53 and p21 proteins and mRNA expression, and decrease of cyclin B and PCNA protein and mRNA expression as well as cdc2 and Mdm2 mRNA expression. Therefore, we speculated that dietary AFB1 could cause G2/M cell cycle arrest in jejunum through p53-dependent p21 activation. Similar results were also observed in the following references. β-Mangostin can induce the p53-dependent G2/M cell cycle arrest by down-regulating cdc2 and PCNA [37]. Exposure of HEK 293 cells to citrinin induced cell cycle G2/M arrest and increased the expression of p53 and p21 proteins [38]. Deoxynivalenol arrested epithelial cell cycle at G2/M phase via elevated p21 gene expression [39]. In human liver cells, Ochratoxin A (OTA) exerted a major influence on G2 phase arrest, in which the cyclin B1-cdc2 complex was reduced and the expression of cdc2 and cyclin B1 were significantly decreased by OTA treatment both at protein and mRNA level [40].
Herein, up-regulation of Chk2 protein and mRNA expression indicates that AFB1 activates ATM-Chk2 pathways to inhibit cdc2/cyclin B expression. The cyclin B/cdc2 complexes are also activated in prophase by the cdc25 phosphatase, while inhibition of cdc25 by the checkpoint kinases Chk2 prevents cyclin B/cdc2 activation [41, 42]. And the relatively low amounts of the formation of an active cyclin B/Cdc2 complex may be the main factor of cells accumulated in G2/M phase [43]. Our results showed that AFB1 caused the decrease of cdc25C expression, indicating that AFB1 induced G2/M phase arrest via ATM-Chk2-cdc25-cyclin B/cdc2 route.
In summary, 0.6 mg/kg AFB1 in the diet inhibited the development of broiler’s jejunum by causing G2/M cell cycle arrest. This was accompanied by the increase of ATM, p53, p21 and Chk2 proteins and mRNA expression, and the decrease of cdc25, cdc2, cyclin B, Mdm2 and PCNA proteins and mRNA expression. Here, we showed the proposed mechanisms of jejunal G2/M cell cycle arrest caused by AFB1 (Figure 8).
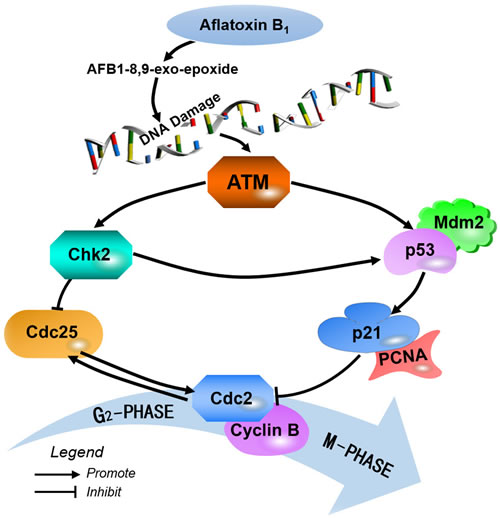
Figure 8: Schematic diagram of the proposed the molecular mechanism of aflatoxin B1 arrest G2/M cell cycle in broiler’s jejunum.
Materials and Methods
Experimental design
One hundred and fifty-six one-day-old healthy Cobb broilers were randomly divided into two groups with three replicates per group and 26 birds per replicate, namely control group (0 mg/kg AFB1) and AFB1 group (0.6 mg/kg AFB1). The use of broilers and all experimental procedures involving animals were approved by Sichuan Agricultural University Animal Care and Use Committee. Nutritional requirements were adequate according to National Research Council (1994) (National Research Council, 1994) [44] and Chinese Feeding Standard of Chicken (NY/T33-2004).AFB1 was obtained from Sigma-Aldrich (USA, A6636). The AFB1-contaminated diet was made, similarly to the method described by Kaoud [45]. Briefly, 27 mg AFB1 farinose solid was dissolved into 30 mL methanol completely, and then the 30 mL mixture was mixed into 45 kg corn-soybean basal diet to formulate AFB1 diet of experimental groups containing 0.6mg/kg AFB1. The equivalent methanol was mixed into corn-soybean basal diet to produce control diet. Then, the methanol of diets was evaporated at 98 °F (37 °C). The AFB1 concentrations were analyzed by HPLC (Waters, Milford, MA, USA ) with fluorescence detection (Waters, Model 2475, Milford, MA, USA), and the AFB1 concentrations were determined as < 0.01mg/kg and 0.061mg/kg in the control diet and AFB1 diet, respectively. Broilers were housed in cages with electrically heated units and provided with water as well as above mentioned diet ad libitum for 21 days.
Histopathological examination
At the end of 7, 14 and 21 days of experiment, six chickens in each group were euthanized, and jejunum (the midpoint between the bile duct entry and Meckel’s diverticulum) were immediately fixed in 4% paraformaldehyde. After fixation for 24 h, tissues were dehydrated, paraffin embedded, sectioned at 5 μm, and stained with haematoxylin and eosin (H.E) for histological examination. Paraffin sections were also collected to perform immunohistochemistry. The histological structures of the tissues were observed and photographed with a digital camera (Nikon DS-Ri1, Japan). Altogether 10 measurements were taken per broiler for each parameter in the jejunum stained with H.E using Image-Pro Plus 5.1 (USA) image analysis software. The following parameters were determined: the villus height (length from the tip of the villus to the crypt mouth), crypt depth (length from the crypt mouth to the crypt base following the crypt lumen) and villus height to crypt depth (villus/crypt) ratio.
Cell cycle analysis by flow cytometry
At the end of 7, 14 and 21 days, six chickens in each group were selected for the determination of the cell cycle stages in jejunum by flow cytometry, with a similar method described by Chen et al. [46]. Briefly, the chickens were humanely killed and the jejunal mucosae were obtained, and minced using scissors to form a cell suspension that was filtered through a 300-mesh nylon screen. The cells were washed twice with ice-cold phosphate buffer saline (PBS, pH 7.2-7.4), and then suspended in PBS at a concentration of 1 × 10⁶ cells/mL. A total of 500 µL of the cell suspension was transferred to a 5-mL culture tube. After centrifugation (200×g, 5 min), the supernatant was separated, the cells were incubated for 30 min at room temperature in the dark with 5 µL 0.25% Triton X-100 and 5 μL Propidium Iodide (PI) (Cat. No.51-66211E). Finally, 500 μL of PBS were added to each tube, and cells were analyzed by flow cytometry (BD FACSCalibur) within 45 min of preparation. The results of cell cycle were analyzed using the Mod Fit LT for Mac V3.0 computer program.
Immunohistochemistry
The method of immunohistochemistry was applied according to the report by Fang et al. [47]. The jejunal paraffin sections were dewaxed in xylene, rehydrated through a graded series of ethanol solutions, washed in distilled water and PBS and endogenous peroxidase activity was blocked by incubation with 3% H2O2 in methanol for 15 min. The sections were saturated with normal 10% goat sera for 30 min in order to eliminate non specific irrelevant proteins staining and then incubated with the primary(rabbit/mouse)antibodies (Table 1) for 17 h at 4 °C (working dilution: 1:100). After washing in PBS, the slices were exposed to 1% biotinylated goat anti-rabbit/mouse IgG secondary antibody (Boster, Wuhang, China) for 1 h at 37 °C, and then incubated with strept avidin-biotin complex (SABC; Boster, Wuhang, China) for 30 min at 37 °C. To visualize the immunoreaction, sections were immersed in diaminobenzidine hydrochloride (DAB; Boster, Wuhang, China). The slices were monitored microscopically and stopped by immersion in distilled water, as soon as brown staining was visible. Slices were lightly counterstained with hematoxylin, dehydrated in ethanol, cleared in xylene and mounted. For negative control purposes, representative sections were processed in the same way by replacing primary antibodies by PBS.
In this study, the protein expression levels of the cell cycle regulatory molecules were determined by the integrated optical density (IOD). Briefly, photographs of the jejunums were taken with a digital microscope camera system (Nikon DS-Ri1, Japan). For each section, five fields of 0.064 mm2 from each area of the image were analyzed using computer-assisted image-Pro Plus 5.1 (USA) image analysis software. By selecting “colour-chosen target” in the option bar of the morphologic analysis system, all positive immunoreactive cells in the field were marked in colour. Then, “calculating” in the option bar was selected to automatically calculate the IOD value.
Table 1: Antibodies used in immunohistochemistry
Name |
Company |
Cat# |
Source |
Dilution |
p-ATM |
Bioss, China |
bs-2272R |
Rabbit |
1:100 |
p-Chk2 |
Bioss, China |
bs-3721R |
Rabbit |
1:100 |
p53 |
Boster, China |
BM0101 |
Mouse |
1:100 |
p21 |
Boster, China |
BA0272 |
Rabbit |
1:100 |
p-cdc25C |
Bioss, China |
bs-3482R |
Rabbit |
1:100 |
Cyclin B1 |
Boster, China |
BA0766 |
Rabbit |
1:100 |
PCNA |
Bioss, China |
bs-0754R |
Rabbit |
1:100 |
Quantitative real-time PCR
The jejunal mucosae from six chickens in each group were taken at 7, 14and 21 days of age and stored in liquid nitrogen. The jejunal mucosae were crushed with pestle to homogenize until powdery, respectively. As previously described [48], total RNA was extracted from the powdery of jejunal mucosae using RNAiso Plus (9108/9109, Takara, Otsu, Japan). Next, cDNA was synthesized using a Prim-Script™ RT reagent Kit (RR047A, Takara, Japan) according to the manufacture’s protocol. The cDNA product was used as a template for qRT-PCR analysis. Sequences for target genes were obtained from the NCBI database. Oligonucleotide primers were designed using Primer 5 software and synthesized at Takara (Dalian, China; Table 2). All qRT-PCR were performed using the SYBR® Premix Ex TaqTM II system (DRR820A, Takara, Japan) using on a Model C1000 Thermal Cycler (Bio Rad, USA). Chicken β-actin expression was used as an internal reference housekeeping gene. Gene expression values from control group subsamples at 7, 14, and 21 days of age were used to calibrate gene expression in subsamples from corresponding experimental subsamples. All data output from the qRT-PCR experiments were analyzed using the 2-ΔΔCT method [49].
Table 2: Sequence of primers used in qRT-PCR
Gene symbol |
Accession number |
Primer |
Primer sequence(5’-3’) |
Product size |
Tm (oC) |
ATM |
NM001162400.1 |
Forward Reverse |
TTGCCACACTCTTTCCATGT CCCACTGCATATTCCTCCAT |
110bp |
60 |
Chk2 |
NM001080107 |
Forward Reverse |
AGACCAAATCACTCGTGGAGAATAC GATGCTCTAAGGCTTCCTCTATTGT |
140bp |
60 |
cdc25 |
NM001199572.1 |
Forward Reverse |
AGCGAAGATGATGACGGATT GCAGAGATGAAGAGCCAAAGA |
163bp |
59 |
p53 |
NM205264.1 |
Forward Reverse |
ACCTGCACTTACTCCCCGGT TCTTATAGACGGCCACGGCG |
127bp |
59 |
Mdm2 |
AF005045.1 |
Forward Reverse |
AACTTCCCAGCCAACAACA TCAAAGGTCAACGAGATGCT |
123bp |
59 |
p21 |
AF513031.1 |
Forward Reverse |
TCCCTGCCCTGTACTGTCTAA GCGTGGGCTCTTCCTATACAT |
123bp |
60 |
cdc2 |
NM205314.1 |
Forward Reverse |
TCTGCTCTGTATTCCACTCCTG ATTGTTGGGTGTCCCTAAAGC |
144bp |
60 |
cyclinB3 |
NM205239.2 |
Forward Reverse |
ATCACCAACGCTCACAAGAAC AGGCTCCACAGGAACATCTG |
171bp |
59 |
PCNA |
AB053163.1 |
Forward Reverse |
GATGTTCCTCTCGTTGTGGAG CAGTGCAGTTAAGAGCCTTCC |
104bp |
60 |
β-actin |
L08165 |
Forward Reverse |
TGCTGTGTTCCCATCTATCG TTGGTGACAATACCGTGTTCA |
178bp |
62 |
Statistical analysis
The significance of difference between two groups was analyzed by variance analysis, and results were expressed as mean ± standard deviation (![]() ±SD). The analysis was performed using the independent sample test of SPSS 20.0 software (IBM Corp, Armonk, NY, USA) for windows. Statistical significance was considered at p < 0.05 and markedly significant was considered at p < 0.01.
±SD). The analysis was performed using the independent sample test of SPSS 20.0 software (IBM Corp, Armonk, NY, USA) for windows. Statistical significance was considered at p < 0.05 and markedly significant was considered at p < 0.01.
Acknowledgments
This work was supported by the program for Changjiang scholars, the University Innovative Research Team (IRT 0848) and the Education Department of Sichuan Province (2012FZ0066) and (2013FZ0072).
Conflicts of Interest
The authors declare no conflict of interest.
References
1. Yunus AW, Razzazi-Fazeli E and Bohm J. Aflatoxin B1 in affecting broiler’s performance, immunity, and gastrointestinal tract: A review of history and contemporary issues. Toxins. 2011; 3:566-590.
2. Scott TR, Rowland SM, Rodgers RS and Bodine AB. Genetic selection for aflatoxin B 1 resistance influences chicken T-cell and thymocyte proliferation. Dev Comp Immunol. 1991; 15:383-391.
3. Abbès S, Salah-Abbès JB, Abdel-Wahhab MA and Ouslati R. Immunotoxicological and biochemical effects of Aflatoxins in rats prevented by Tunisian Montmorillonite with reference to HSCAS. Immunopharm Immunot. 2010; 32:514-522.
4. Kalpana S, Aggarwal M, Rao GS and Malik JK. Effects of aflatoxin B1 on tissue residues of enrofloxacin and its metabolite ciprofloxacin in broiler chickens. Environ Toxicol Phar. 2012; 33:121-126.
5. Hartwell LH and Kastan MB. Cell cycle control and cancer. Science. 1994; 266:1821-1828.
6. Schafer K. The cell cycle: a review. Vet Pathol. 1998; 35:461-478.
7. O’connor P. Mammalian G1 and G2 phase checkpoints. Cancer Surv. 1996; 29:151-182.
8. Branzei D and Foiani M. Regulation of DNA repair throughout the cell cycle. Nat Rev Mol Cell Bio. 2008; 9:297-308.
9. Bianco G, Russo R, Marzocco S, Velotto S, Autore G and Severino L. Modulation of macrophage activity by aflatoxins B1 and B2 and their metabolites aflatoxins M1 and M2. Toxicon. 2012; 59:644-650.
10. Yang X, Zhang Z, Wang X, Wang Y, Zhang X, Lu H and Wang S-L. Cytochrome P450 2A13 enhances the sensitivity of human bronchial epithelial cells to aflatoxin B1-induced DNA damage. Toxicol Appl Pharmacol. 2013; 270:114-121.
11. Raj HG, Gupta K, Rohil V, Bose M, Biswas G, Singh SK, Jain SC, Parmar VS, Olsen CE and Wengel J. Aflatoxin B1-induced micronuclei and cell cycle alterations in lung and bone marrow cells and their modulation by Piper argyrophyllum extract. Teratogen Carcin Mut. 1998; 18:249-261.
12. Zhang S, Peng X, Fang J, Cui H, Zuo Z and Chen Z. Effects of Aflatoxin B1 Exposure and Sodium Selenite Supplementation on the Histology, Cell Proliferation, and Cell Cycle of Jejunum in Broilers. Biol Trace Elem Res. 2014; 160:32-40.
13. Yu Z, Wang F, Liang N, Wang C, Peng X, Fang J, Cui H, Mughal MJ and Lai W. Effect of Selenium Supplementation on Apoptosis and Cell Cycle Blockage of Renal Cells in Broilers Fed a Diet Containing Aflatoxin B1. Biol Trace Elem Res. 2015; 168:242-251.
14. Kumagai S. Intestinal absorption and excretion of aflatoxin in rats. Toxicol Appl Pharmacol. 1989; 97:88-97.
15. Schultz SG. Small Intestinal Absorption. Role Gastrointestinal Tract Nutrient Del. 2012; 3:119.
16. De Conto C, Oevermann A, Burgener I, Doherr M and Blum J. Gastrointestinal tract mucosal histomorphometry and epithelial cell proliferation and apoptosis in neonatal and adult dogs. J Anim Sci. 2010; 88:2255-2264.16.
17. Kurz EU and Lees-Miller SP. DNA damage-induced activation of ATM and ATM-dependent signaling pathways. DNA Repair. 2004; 3:889-900.
18. Sancar A, Lindsey-Boltz LA, Ünsal-Kaçmaz K and Linn S. Molecular mechanisms of mammalian DNA repair and the DNA damage checkpoints. Annu Rev Biochem. 2004; 73:39-85.
19. Kudoh A, Fujita M, Zhang L, Shirata N, Daikoku T, Sugaya Y, Isomura H, Nishiyama Y and Tsurumi T. Epstein-Barr virus lytic replication elicits ATM checkpoint signal transduction while providing an S-phase-like cellular environment. J Biol Chem. 2005; 280:8156-8163.
20. Lavin MF and Kozlov S. ATM activation and DNA damage response. Cell cycle. 2007; 6:931-942.
21. Wilson KA and Stern DF. NFBD1/MDC1, 53BP1 and BRCA1 have both redundant and unique roles in the ATM pathway. Cell Cycle. 2008; 7:3584-3594.
22. Hirao A, Kong Y-Y, Matsuoka S, Wakeham A, Ruland J, Yoshida H, Liu D, Elledge SJ and Mak TW. DNA damage-induced activation of p53 by the checkpoint kinase Chk2. Science. 2000; 287:1824-1827.
23. Yu Q, La Rose J, Zhang H, Takemura H, Kohn KW and Pommier Y. UCN-01 inhibits p53 up-regulation and abrogates γ-radiation-induced G2-M checkpoint independently of p53 by targeting both of the checkpoint kinases, Chk2 and Chk1. Cancer Res. 2002; 62:5743-5748.
24. Verma R. Aflatoxin cause DNA damage. Int J Hum Genet. 2004; 4:231.
25. Gursoy-Yuzugullu O, Yuzugullu H, Yilmaz M and Ozturk M. Aflatoxin genotoxicity is associated with a defective DNA damage response bypassing p53 activation. Liver International. 2011; 31:561-571.
26. Elledge SJ. Cell cycle checkpoints: preventing an identity crisis. Science. 1996; 274:1664-1672.
27. Piette J, Neel H and Marechal V. Mdm2: keeping p53 under control. Oncogene. 1997; 15:1001-1010.
28. Bunz F, Dutriaux A, Lengauer C, Waldman T, Zhou S, Brown J, Sedivy J, Kinzler K and Vogelstein B. Requirement for p53 and p21 to sustain G2 arrest after DNA damage. Science. 1998; 282:1497-1501.
29. Quaas M, Müller GA and Engeland K. p53 can repress transcription of cell cycle genes through a p21WAF1/CIP1-dependent switch from MMB to DREAM protein complex binding at CHR promoter elements. Cell Cycle. 2012; 11:4661-4672.
30. Poluha W, Poluha DK, Chang B, Crosbie NE, Schonhoff CM, Kilpatrick DL and Ross AH. The cyclin-dependent kinase inhibitor p21 (WAF1) is required for survival of differentiating neuroblastoma cells. Mol Cell Biol. 1996; 16:1335-1341.
31. Ando T, Kawabe T, Ohara H, Ducommun B, Itoh M and Okamoto T. Involvement of the interaction between p21 and proliferating cell nuclear antigen for the maintenance of G2/M arrest after DNA damage. J Biol Chem. 2001; 276:42971-42977.
32. Zhang H, Xiong Y and Beach D. Proliferating cell nuclear antigen and p21 are components of multiple cell cycle kinase complexes. Mol Biol Cell. 1993; 4:897-906.
33. Kelman Z. PCNA: structure, functions and interactions. Oncogene. 1997; 14.
34. Maga G and Hübscher U. Proliferating cell nuclear antigen (PCNA): a dancer with many partners. J Cell Sci. 2003; 116:3051-3060.
35. Bravo R, Frank R, Blundell PA and Macdonald-Bravo H. Cyclin/PCNA is the auxiliary protein of DNA polymerase-δ. Nature. 1987; 326:515-517.
36. Bulavin DV, Higashimoto Y, Popoff IJ, Gaarde WA, Basrur V, Potapova O, Appella E and Fornace AJ. Initiation of a G2/M checkpoint after ultraviolet radiation requires p38 kinase. Nature. 2001; 411:102-107.
37. Syam S, Bustamam A, Abdullah R, Sukari MA, Hashim NM, Ghaderian M, Rahmani M, Mohan S, Abdelwahab SI and Ali HM. β-Mangostin induces p53-dependent G2/M cell cycle arrest and apoptosis through ROS mediated mitochondrial pathway and NfkB suppression in MCF-7 cells. J Funct Foods. 2014; 6:290-304.
38. Chang C-H, Yu F-Y, Wu T-S, Wang L-T and Liu B-H. Mycotoxin citrinin induced cell cycle G2/M arrest and numerical chromosomaaberration associated with disruption of microtubule formation in human cells. Toxicol Sci. 2010; 119:84-92.
39. Yang H, Chung DH, Kim YB, Choi YH and Moon Y. Ribotoxic mycotoxin deoxynivalenol induces G2/M cell cycle arrest via p21 Cip/WAF1 mRNA stabilization in human epithelial cells. Toxicol. 2008; 243:145-154.
40. Cui J, Xing L, Li Z, Wu S, Wang J, Liu J, Wang J, Yan X and Zhang X. Ochratoxin A induces G 2 phase arrest in human gastric epithelium GES-1 cells in vitro. Toxicol Lett. 2010; 193:152-158.
41. Nigg EA. Mitotic kinases as regulators of cell division and its checkpoints. Nat Rev Mol Cell Bio. 2001; 2:21-32.
42. Bartek J and Lukas J. Chk1 and Chk2 kinases in checkpoint control and cancer. Cancer Cell. 2003; 3:421-429.
43. Smits VA, Klompmaker R, Vallenius T, Rijksen G, Mäkelä TP and Medema RH. p21 inhibits Thr161 phosphorylation of Cdc2 to enforce the G2 DNA damage checkpoint. J Biol Chem. 2000; 275:30638-30643.
44. Dale N. National Research Council Nutrient Requirements of Poultry-Ninth Revised Edition (1994). J Appl Poultry Res. 1994; 3:101-101.
45. Kaoud HA. Innovative methods for the amelioration of aflatoxin (AFB1) effect in broiler chicks. Sci J Appl Res. 2013; 1:15-19.
46. Chen T, Cui H, Cui Y, Bai C, Gong T and Peng X. Cell-cycle blockage associated with increased apoptotic cells in the thymus of chickens fed on diets high in fluorine. Hum Exp Toxicol. 2011; 30:685-692.
47. Fang J, Cui H, Peng X, Chen Z, He M and Tang L. Developmental changes in cell proliferation and apoptosis in the normal duck thymus. Anat Histol Embryol. 2011; 40:457-465.
48. Wu B, Cui H, Peng X, Fang J, Zuo Z, Deng J and Huang J. Dietary nickel chloride induces oxidative stress, apoptosis and alters Bax/Bcl-2 and caspase-3 mRNA expression in the cecal tonsil of broilers. Food Chem Toxicol. 2014; 63:18-29.
49. Livak KJ and Schmittgen TD. Analysis of relative gene expression data using real-time quantitative PCR and the 2− ΔΔCT method. Methods. 2001; 25:402-408.