
INTRODUCTION
Glutamate (Glu) has many important functions in nutrition, metabolism and signaling as a non-essential amino acid [1]. Almost all dietary Glu is extensively metabolized in first-pass by the intestine to maintain intestinal health [2,3]. Therefore, there is a growing interest in Glu nutrition in mammals [4]. Studies with pigs, rats and mice demonstrate that the excitatory amino acid transporter 3 (EAAT3), encoded by solute carrier family 1 member 1 (SLC1A1), is the predominant anionic amino acid transporter in the intestine [5]. In our previous studies, EAAT3 inhibition decreased pig intestinal epithelial cell (IPEC-1) proliferation [6] and intestinal growth in chick embryos [7]. Landeghem, et al. [8] reported that EAAT3 expression in microglia cells increased after traumatic brain injury. Collectively, defective EAAT3 expression causes human dicarboxylic aminoaciduria [9] and exacerbates neuronal injury after transient cerebral ischemia [10, 11]. However, the mechanism of EAAT3 action in the intestine is still unclear.
It is widely accepted that amino acid transporters act as carriers and sensors that interact with intracellular nutrient-signaling pathways to regulate metabolism [12]. In particular, the mammalian target of rapamycin (mTOR) pathway is a central regulator that integrates signals from nutrients, especially amino acids, to promote cell proliferation [12, 13]. Interestingly, mTOR increases EAAT3 protein levels in Xenopus oocyte cell membranes and accelerates Glu transport [14].
In the current study we hypothesized that the mTOR pathway is involved in amino acid transport and porcine jejunal epithelial cell (IPEC-J2) proliferation, and that EAAT3 might activate this pathway.
RESULTS
Construction of the recombinant plasmid, EAAT3-pcDNA3.1+
The open reading frame (ORF) of the EAAT3 cDNA in Landrace piglets is 1,575 bp in length, encoding a 524-AA polypeptide (Figure 1A). The cDNA sequence shares 99.8% and 99.0% identity with Tibet pig and Huanjiang mini-pig and shares 89.5% and 92.5% with mouse and human, respectively. EcoRI and XhoI were used for the enzyme digestion identification (Figure 1B–1C); sequencing was also conducted. All analyses confirmed that the pig EAAT3 was successfully inserted into the pcDNA3.1+ vector, creating EAAT3-pcDNA3.1+.
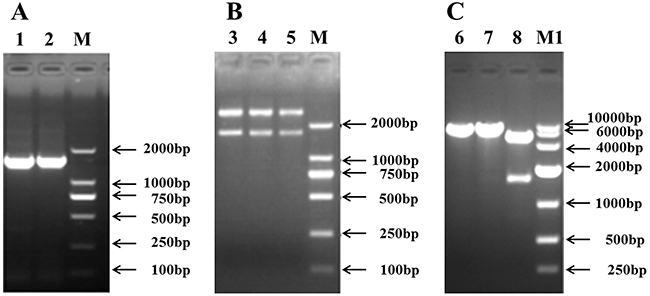
Figure 1: Construction of the recombinant plasmid, EAAT3-pcDNA3.1+. Cloning of the pig EAAT3 cDNA A. Identification of the recombinant plasmids EAAT3-pGEM-T B. and EAAT3-pcDNA3.1+ C. M: DNA Marker 2000; M1: DNA Marker 10000; Lanes 1, 2: PCR products of jejunal excitatory amino acid transporter 3 (EAAT3); Lanes 3, 4, 5: Double enzyme digestions of EAAT3-pGEM-T by EcoRI and XhoI; Lanes 6, 7: Single enzyme digestions of EAAT3-pcDNA3.1+ by EcoRI and XhoI, respectively; Lane 8: Double enzyme digestions of EAAT3-pcDNA3.1+ by EcoRI and XhoI.
EAAT3 overexpression and knockdown in IPEC-J2 cells
Immunofluorescence microscopy, real-time PCR assays and western blot analyses were performed to assess EAAT3 overexpression in IPEC-J2 cells. Compared with the Control group, EAAT3 fluorescent signaling (Figure 2A) and mRNA (Figure 2B) and protein (Figure 2C) levels increased (P<0.05) in the Overexpression group, showing that the Overexpression cells were stably transfected with EAAT3-pcDNA3.1+.
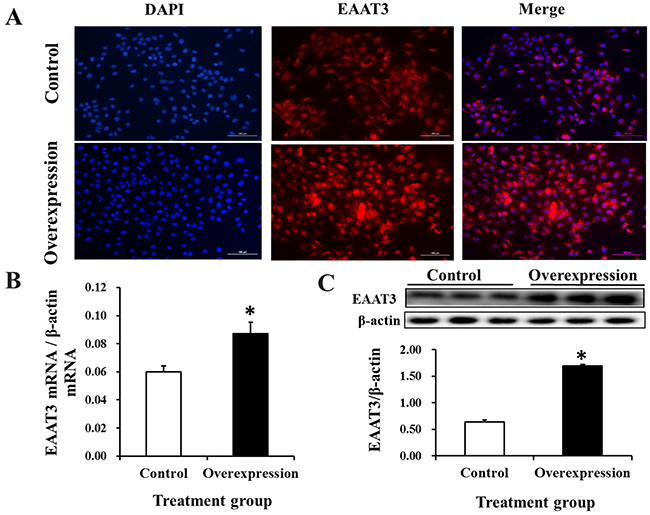
Figure 2: EAAT3 overexpression in IPEC-J2 cells. Representative immunofluorescence images of Control and Overexpression cells at 48 h after seeding, labeled with DAPI (blue) and EAAT3 antibody (red) A. Scale bars: 100 μm. Control: control group; Overexpression: EAAT3 overexpression group. EAAT3 mRNA abundance (n=6) B. and protein level (n=3) C. Representative results of three independent experiments are shown as means ± SEM; *P<0.05.
To assess siRNA-mediated EAAT3 knockdown in IPEC-J2 cells, we measured transfection levels at different time points via Cy3-labeled siRNA (Cy3-siRNA, RiboBio, Guangzhou, China) (data not shown), a red-fluorescing siRNA. The greatest effect occurred at 48 h post-transfection (Figure 3). Therefore, by measuring EAAT3 expression 48 h post-transfection with the three EAAT3-siRNAs, we found that siRNA-003 produced an optimal interference effect (P<0.05; Figure 4A). We also found EAAT3 mRNA abundance in IPEC-J2 cells to be lowest 48 h post-transfection with siRNA-003 (Figure 4B). Compared with Negative control, western blot analysis also showed reduced (P<0.05) EAAT3 expression (Figure 4C) in the Knockdown group.
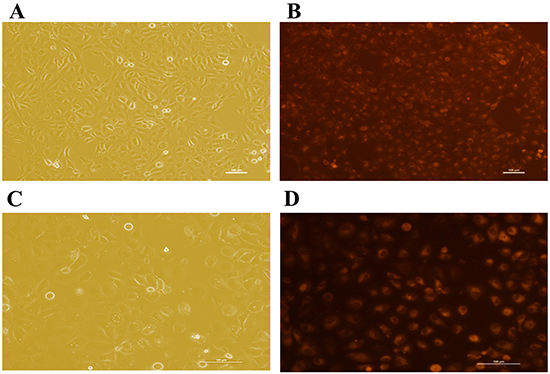
Figure 3: siRNA Representative fluorescence images of IPEC-J2 cells 48 h post-transfection with the transfection control (Cy3)-siRNA. IPEC-J2 cells under normal light after transfection with the control (Cy3)-siRNA (100× A. and 200× C.). Corresponding fluorescence photos of IPEC-J2 cells after transfection with the control (Cy3)-siRNA (100× B. and 200× D.). Scale bars: 100 μm. Representative results of the three independent experiments are shown.
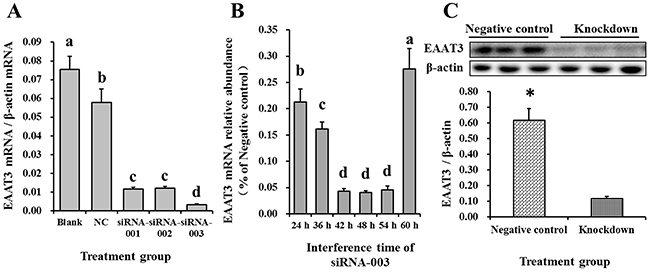
Figure 4: Screening for the optimal EAAT3 siRNA and interference time in IPEC-J2 cells. The effects of three siRNAs on EAAT3 mRNA abundance were measured by real-time PCR 48 h post-transfection A. Blank: blank control group; NC: negative control group; siRNA-001: EAAT3-siRNA-001 group; siRNA-002: EAAT3-siRNA-002 group; siRNA-003: EAAT3-siRNA-003 group. The effects of siRNA-003 transfection time on EAAT3 mRNA abundance were measured by real-time PCR B. Data are expressed as means ± SEM (n=6). Different letters indicate significant differences (P<0.05). siRNA-003 treatment reduced EAAT3 protein levels as compared to the Negative controls C. Negative control: negative control group; Knockdown: EAAT3-siRNA-003 group. Representative results of three independent experiments are shown. Data are expressed as means ± SEM (n=3); *P<0.05.
EAAT3 effects on amino acid transport
Free amino acid concentration was measured in IPEC-J2 cells cultured in Advanced DMEM/F-12 (Figure 5). Anionic amino acid and cystine (Cys) transport increased in the Overexpression group compared with Controls (P<0.05, Figure 5A), and this effect was significantly reduced by EAAT3 knockdown (P<0.05, Figure 5B). EAAT3 overexpression or knockdown had no significant effect on other amino acids.
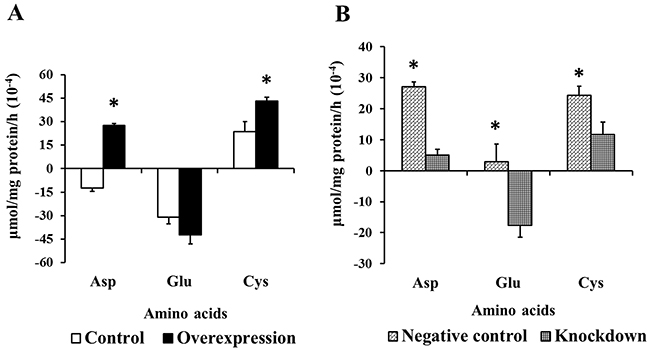
Figure 5: Effects of EAAT3 overexpression A. and knockdown B. on amino acid transport in IPEC-J2 cells. Control: control group; Overexpression: EAAT3 overexpression group. Negative control: negative control group; Knockdown: EAAT3-siRNA-003 group. Glu: glutamate; Asp: aspartate; Cys: cystine. Representative results of three independent experiments are shown. Data are expressed as means ± SEM (n=6); *P<0.05.
EAAT3 overexpression increased IPEC-J2 cell proliferation
MTT and cell count assays were used to evaluate the effects of EAAT3 overexpression on IPEC-J2 cell proliferation. OD values (Figure 6A) and cell numbers (Figure 6B) were increased (P<0.05) in the Overexpression group compared to the Control group.
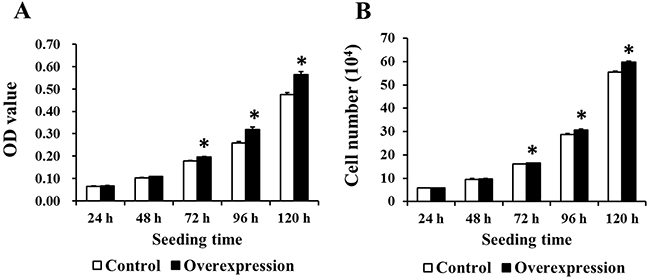
Figure 6: EAAT3 overexpression increased IPEC-J2 cell proliferation. The Overexpression group OD values and cell numbers were higher than those of the Control group at 72, 96, and 120 h after seeding, as assessed by MTT (n=20) A. and cell counting assay (n=6) B. respectively. Control: control group; Overexpression: EAAT3 overexpression group. Representative results of three independent experiments are shown. Data are expressed as means ± SEM; *P<0.05.
EAAT3 effects on the mTOR pathway
We measured the levels of mTOR pathway-related proteins by western blotting. Compared with the Control group, levels of p-mTOR (Ser2448) and its downstream targets, p-S6K1 (Thr389)/p-S6 (Ser235) and p-4EBP1 (Thr70)/eIF4E, were increased in the Overexpression group (P<0.05, Figure 7A–7B). Compared with the Negative control group, phosphorylation of mTOR (Ser2448) and its downstream target proteins was decreased (P<0.05) in the Knockdown group (Figure 7C–D). These data indicate that EAAT3 could activate the mTOR pathway in IPEC-J2 cells.
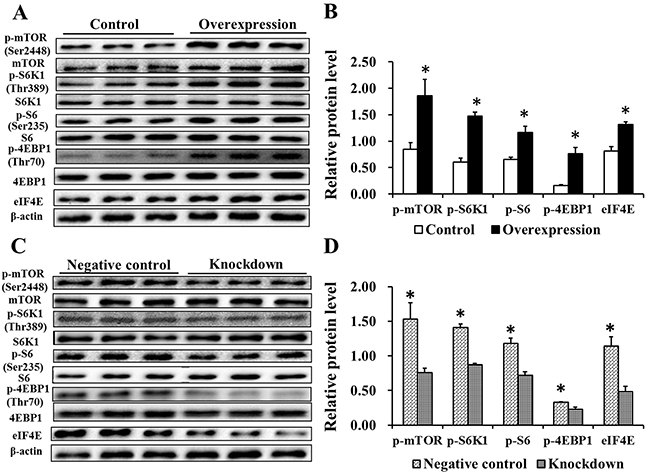
Figure 7: Effects of EAAT3 overexpression A–B. and knockdown C–D. on mTOR pathway related proteins in IPEC-J2 cells. Control: control group; Overexpression: EAAT3 overexpression group. Negative control: negative control group; Knockdown: EAAT3-siRNA-003 group. Representative results of three independent experiments are shown. Data are expressed as means ± SEM (n=3); *P<0.05.
EAAT3 effects on ATF4/xCT expression
ATF4 and xCT protein levels were measured to help elucidate the underlying mechanism of EAAT3-mediated Cys transport. xCT expression was increased at both the mRNA and protein levels (P<0.05) in the Overexpression group as compared with Controls (Figure 8A–8B), and was significantly different between the Negative control and Knockdown groups (Figure 8C–8D). ATF4 protein levels followed the same patterns as those of xCT (Figure 8B & 8D). These data indicate that EAAT3 promotes ATF4 expression and that EAAT3 and xCT levels positively correlate.
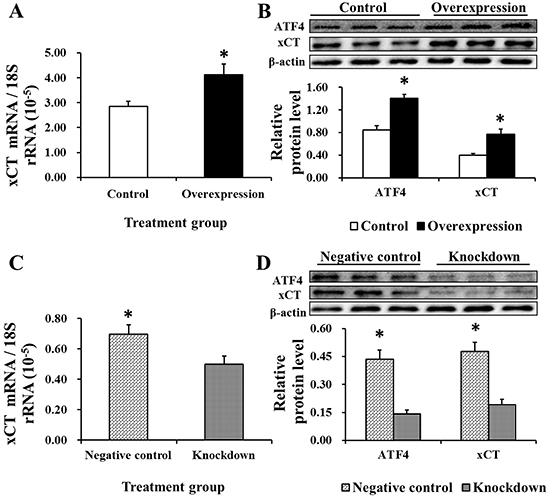
Figure 8: xCT mRNA abundance (n=6) and protein level (n=3) and ATF4 protein level (n=3) after EAAT3 overexpression A–B. or knockdown C–D. as measured by real-time PCR and western blotting. Control: control group; Overexpression: EAAT3 overexpression group. Negative control: negative control group; Knockdown: EAAT3-siRNA-003 group. ATF4: activating transcription factor 4; xCT: cystine/glutamate antiporter. Representative results of three independent experiments are shown. Data are expressed as means ± SEM; *P<0.05.
DISCUSSION
Glu plays a critical role in metabolism, which regulates a number of physiological processes associated with disease [1, 15]. Glu absorption is mainly mediated by EAAT3 in the nervous system [16], gastrointestinal tract [5, 17] and skeletal muscle [18]. Our previous studies revealed that EAAT3 is a marker of intestinal growth during embryonic development in chicks [7, 19] and pigeons [20-22]. In addition, Glu deficiency or absorptive inhibition of EAAT3 decreased IPEC-1 cell proliferation [6]. A pig intestinal epithelial cell line, IPEC-J2 [23], was used in the present study. Result showed that transport of anionic amino acids and Cys was increased by EAAT3 overexpression and decreased by EAAT3 knockdown while other amino acids were unaffected. Interestingly, proliferation of IPEC-J2 cells in the Overexpression group was increased compared to Controls as determined by MTT and cell counting assays. These results collectively suggested that Glu, aspartate (Asp) and Cys, induced by EAAT3, act as signal transducers to promote cell proliferation (Figure 9).
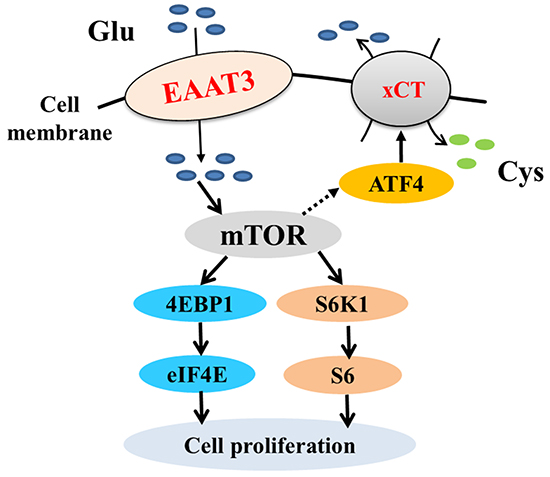
Figure 9: mTOR pathway activation by EAAT3. EAAT3 facilitates Glu transport and activates the mTOR pathway. EAAT3 triggers mTOR pathway activation, which promotes ATF4-mediated xCT expression and might accelerate Cys transport. EAAT3: excitatory amino acid transporter 3; Glu: glutamate; Cys: cystine; mTOR: mammalian target of rapamycin; ATF4: activating transcription factor 4; xCT: cystine/glutamate antiporter.
mTOR is best known for its function in control of cell proliferation, and is typically activated by energy, amino acids and growth factors [24-26]. Notably, amino acid transporters might contribute to initiation of the amino acid-dependent mTOR pathway [27]. Signaling pathways activated by intracellular amino acid concentrations are intrinsically linked to amino acid transporter activity as well as to intracellular amino acid metabolism [28]. We found that phosphorylation of mTOR (Ser2448) and its downstream targets, S6K1 (Thr389) and 4EBP1 (Thr70), was significantly increased and decreased by EAAT3 overexpression and knockdown, respectively. These results demonstrated that EAAT3 contributes to initiation of amino acid-dependent cell signaling in the mTOR pathway (Figure 9).
EAAT3 may be effective in the treatment of advanced renal cell carcinoma by regulating the mTOR pathway as effectively as temsirolimus and everolimus, which are kinase inhibitors of mTOR complex 1 (mTORC1) [29]. mTOR pathway activation may lead to accumulation of hypoxia inducible factor, which promotes the transcription of angiogenesis- and tumor progression-related genes [29]. In addition, EAAT3 has gained attention as a novel therapeutic target due to its association with hypoxia, ischemia and multiple sclerosis [16, 30]. However, whether the effects of EAAT3 in human disease result from its activation of the mTOR pathway requires further study.
The current study showed that Cys transport and expression of both the activating transcription factor 4 (ATF4) and cystine/glutamate antiporter (xCT) were increased following EAAT3 overexpression. Following its activation by free amino acids, mTORC1 might enhance ATF4 expression and subsequently promote expression of amino acid transporters [31]. Furthermore, ATF4 can activate xCT [32, 33]. Indeed, xCT is an obligate exchanger of Cys and Glu, and intracellular Glu depletion inhibits Cys uptake [34, 35]. After uptake by xCT, Cys is rapidly transformed into cysteine, which functions in different pathological conditions by restraining oxidative stress or the inflammatory response [36]. Therefore, we believe that EAAT3 triggers mTOR pathway activation, which promotes ATF4-mediated xCT expression and might accelerate Cys transport (Figure 9).
In summary, our data demonstrate that EAAT3 activates the mTOR pathway to promote amino acid transport and cell proliferation. Moreover, ATF4 and xCT expression may be enhanced during EAAT3-induced mTOR pathway activation to transport excess Glu into the extracellular environment.
MATERIALS AND METHODS
Intestinal tissue sample collection
Three male and 3 female 24-d-old Landrace piglets were euthanized with 3% sodium pentobarbital in the dosage of 1 mL/kg before sampling. The entire small intestine was rapidly removed, washed, and frozen in liquid nitrogen. All procedures were approved by the Animal Care Committee of the South China Agricultural University (Guangzhou, China).
Cloning and plasmid construction
Total RNA was isolated from the jejunum using the TRIzol reagent (Invitrogen, Carlsbad, CA) following the manufacturer’s instructions. RNA quality and quantity were determined by ultraviolet spectroscopy using a NanoDrop ®ND-2000 (Thermo Fisher Scientific, DE, USA). Pig full-length EAAT3 cDNA was amplified by reverse transcription polymerase chain reaction (RT-PCR) using mRNA extracted from the jejunum. Designed primer sequences are shown in Table 1. The EAAT3 DNA fragment was cloned into the EcoRI and XhoI sites of the pcDNA3.1+ vector to generate the EAAT3-pcDNA3.1+ recombinant plasmid. The ligation product was transferred into DH5α E. coli cells and spread on an anti-ampicillin Luria-Bertani medium plate cultured at 37°C for 12–16 h. Several clones were then chosen from the plate and plasmids were extracted for PCR, enzyme digestion and sequencing. Purification was performed using the Endo-Free Plasmid Kit (TIANGEN, Beijing, China) according to the manufacturer’s instructions.
Table 1: Primers used for cloning and quantitative real-time PCR
Genes (accession no) |
Primers |
Sequences (5’–3’) |
Size (bp) |
|---|---|---|---|
EAAT3 (1) |
sense |
ATGGGGAAACCGGCGAGGA |
1575 |
antisense |
CTAGAACTGGGAGGTCTGGGTGAATGA |
||
EAAT3 (2) |
sense |
GGCACCGCACTCTACGAAGCA |
177 |
antisense |
GCCCACGGCACTTAGCACGA |
||
xCT (KJ893432.1) |
sense |
GGTCAGAAAGCCTGTTGT |
190 |
antisense |
GATGAAGATTCCTGCTCC |
||
18S rRNA (NR_046261.1) |
sense |
AATTCCGATAACGAACGAGACT |
145 |
antisense |
GGACATCTAAGGGCATCACAG |
||
β-actin (XM_003357928) |
sense |
TGCGGGACATCAAGGAGAAG |
216 |
antisense |
AGTTGAAGGTGGTCTCGTGG |
EAAT3: excitatory amino acid transporter 3, EAAT3 (1) was used for cloning and EAAT3 (2) for real-time PCR analysis, 1575 the size was obtained from sequencing.
Design and synthesis of EAAT3 small interfering RNA
Three siRNAs targeting SLC1A1 and an unrelated negative control siRNA were purified via high performance liquid chromatography (RiboBio, Guangzhou, China) (Table 2). Twenty-four hours prior to transfection, IPEC-J2 cells were plated into a 6-well plate at 30%–50% confluence. siRNAs (50 nmol) were transfected into IPEC-J2 cells according to the manufacturer’s instructions.
Table 2: Sequences of chemically synthesized EAAT3-siRNAs
Name |
Type |
Sequence |
|---|---|---|
siRNA-001-sense |
RNA |
5’GCAAUCCACUCCAUUGUUA dTdT 3’ |
siRNA-001-antisense |
RNA |
3’ dTdT CGUUAGGUGAGGUAACAAU 5’ |
siRNA-002-sense |
RNA |
5’ GCAGUGGCAGCUGUGUUUA dTdT 3’ |
siRNA-002-antisense |
RNA |
3’dTdT CGUCACCGUCGACACAAAU 5’ |
siRNA-003-sense |
RNA |
5’ CCAAGAAGUCCUAUGUCAA dTdT 3’ |
siRNA-003-antisense |
RNA |
3’ dTdT GGUUCUUCAGGAUACAGUU 5’ |
EAAT3: excitatory amino acid transporter 3.
Cell culture and transfection
IPEC-J2 cells, a porcine intestinal epithelial cell line derived from the jejunal crypts of neonatal piglet, was kindly provided by Dr. Yu-long Yin (University of Chinese Academy of Sciences). Cells were cultured in 6-well plates (#3516, Corning, NY, USA) in DMEM/F12 medium (Thermo, Waltham, MA, Cat: 12400-024) supplemented with 5% fetal bovine serum (FBS, Gibco, Carlsbad, CA, Cat: 10099-141), 1% penicillin/streptomycin, 5 μg/L Insulin-Transferrin-Selenium (Sciencell, Carlsbad, CA, USA, Cat: 0803) and 5 μg/L epidermal growth factor (Sciencell, Carlsbad, CA, USA, Cat: 105-04) at 37°C in 5% CO2. Medium was changed every two days. All experiments were performed in triplicate on cell passages 10–20.
IPEC-J2 cells were seeded at 1×10⁵ cells/mL into 6-well cell culture plates and transfected with the pcDNA3.1+ or EAAT3-pcDNA3.1+ plasmid and siRNAs using Lipofectamine™ 3000 (Invitrogen Life Technologies, Carlsbad, CA, USA) on the following day, according to the manufacturer’s recommendations. G418 (800 µg/mL, tested previously before experiment) was added to the medium after transfection. After seven days, G418 levels decreased to 400 µg/mL and nontransfected cells all died. Fourteen days later, surviving clones were analyzed, and the positive clones were collected. In the following experiments, cells transfected with pcDNA3.1+ are the Control group and cells transfected with EAAT3-pcDNA3.1+ are the EAAT3 Overexpression group. Cells transfected with the unrelated control siRNA are the Negative control group and cells transfected with EAAT3-siRNA are the Knockdown group.
Immunofluorescence microscopy
pcDNA3.1+ and EAAT3-pcDNA3.1+ stably transfected IPEC-J2 cells were seeded at 1×10⁴ cells/mL into 96-well culture plates and fixed with 4% paraformaldehyde for 30 min. Cells were then permeabilized with 0.3% Triton X-100 for 15 min and blocked in a protein solution (Dako, Carpinteria, CA) for 20 min. The primary antibody, anti-EAAT3 (1:500 in antibody diluent; Dako, Carpinteria, CA), was applied to these cells for 2 h at room temperature. Secondary staining was performed with Cy3 conjugated antibodies (Jackson ImmunoResearch, West Grove, PA) (1:200 in antibody diluent) with incubation at room temperature for 1 h. Nuclei were stained with 4, 6 diamidino-2-phenylindole (DAPI, 1:1000 in PBS; Sigma, St. Louis, USA), for 5 min at room temperature. Fluorescence signals were observed with a fluorescence microscope (NIS-Elements, Nikon, Japan). At least three independent experiments were performed to verify results.
Real-time polymerase chain reaction (real-time PCR)
mRNA abundance (n=6) was determined by real-time PCR using a Stratagene MxPro 3005P apparatus (Agilent Technologies, Santa Clara, CA) and the SYBR Green Real-Time PCR Master Mix (TOYOBO, Tokyo, Japan). Specific primer pairs were designed using Primer 5.0 software (Table 1). A melting curve analysis was conducted to confirm the specificity of each product, and product sizes were verified in ethidium bromide-stained 1.5% agarose gels in Tris acetate-EDTA buffer. Quantitative data were collected using the 2-ΔΔCt method. The experiment was performed in triplicate.
Experimental treatment and determination of the free amino acids
After reaching 80%–90% confluence in DMEM/F12 containing 5% FBS, cells were starved for 2 h in an amino acid-deprived medium with Earle’s Balanced Salt Solution (EBSS) (Sigma, St. louis, MO, USA, Cat: E2888) and a vitamin mixture (Sigma, St. louis, MO, USA, Cat: R7256) according to established protocols [37]. Cells were then cultured in a serum- and Advanced DMEM/F-12 (Thermo, Waltham, MA, Cat: 12634-028) for 4 h. Afterwards, cells were analyzed via western blotting and the free amino acid concentration was tested in culture medium using a Hitachi L-8900 amino acid analyzer (Hitachi, Tokyo, Japan).
MTT assay
Control and Overexpression cells were cultured in 96-well plates (#3599, Corning, NY, USA) at 1×10⁴ cells/mL in growth medium. Cell numbers were quantified at different time points (24, 48, 72, 96, and 120 h) by incubating cells in 5 mg/ml 3-(4,5-dimethylthiazol-2-yl)-2,5-diphenyltetrazolium bromide (MTT, Sigma, St Louis, MO, USA) for 4 h. Crystals were dissolved in dimethylsulfoxide (DMSO). OD was evaluated in an ELISA reader at a wavelength of 490 nm. Results were confirmed in three independent experiments with 20 samples per treatment.
Cell count assay
Control and Overexpression cells were cultured in 6-well plates at 1×10⁵ cells/mL in growth medium. Briefly, cells were detached with 0.25% trypsin (Sigma, St Louis, MO, USA) for 5–8 min at 37°C after washing twice with PBS and then blocked with an equal volume of growth medium. The number of viable cells was determined using a hemocytometer under an Inversion Microscope System (Nikon, Japan). Three independent experiments were conducted.
Western blot analysis
IPEC-J2 cells were lysed in RIPA buffer containing 1% Triton-X, 20 mmol/L Tris-HCl (pH=7.4), 5 mmol/L EDTA and 1 mmol/L phenyl-methylsulfonyl fluoride (PMSF) followed by 14,000×g centrifugation at 4°C for 15 min. Supernatant protein concentrations were determined using a BCA Protein Assay Reagent Kit (Thermo Fisher Scientific, Rockford, USA). Proteins (10 µg) were separated on 8–10% SDS/PAGE gels and then transferred onto PVDF membranes (Millipore, Billerica, MA). After blocking, membranes were incubated with a primary antibody. Anti-mTOR (#2972), anti-phospho-mTOR (Ser2448, #5536), anti-S6K1 (#9202), anti-phospho-S6K1 (Thr389, #9205), anti-S6 (#2708), anti-phospho-S6 (Ser235/236, #9234), anti-4EBP1 (#9644), and anti-phospho-4EBP1 (Thr70, #2855) antibodies were obtained from Cell Signaling Technology (Beverly, MA, USA); anti-EAAT3 (sc-25658) and anti-ATF4 (sc-200) antibodies were obtained from Santa Cruz (Dallas, Texas, USA); anti-xCT (ab60171) and anti-eIF4E antibodies were obtained from Abcam (Cambridge, MA, USA); anti-β-actin (AP0060), anti-rabbit IgG (BS13278) and anti-goat IgG (BS30503) antibodies were obtained from Bioworld Technology (Louis Park, MN, USA). Proteins were visualized using the Beyo ECL Plus chemiluminescence detection kit (Beyotime Institute of Biotechnology, Beyotime, Shanghai, China). Enhanced chemiluminescence (ECL) signals were scanned using a FluorChem M apparatus (Protein Simple, Inc., Santa Clara, CA). Band density was analyzed using Image Analysis Software (Tanon, Shanghai, China).
Statistical analysis
Data are from at least three independent experiments and are expressed as the mean ± SEM. Student’s t test was conducted to determine the differences between 2 groups using SAS (Version 9.2; SAS Inst. Inc., Cary, NC). Differences among groups were determined using Duncan’s multiple-range test. Differences between treatments were considered statistically significant when P<0.05.
ACKNOWLEDGMENTS
The authors would like to thank De-ming Gou for providing technological support and training.
CONFLICTS OF INTEREST
The authors declare no conflicts of interest.
GRANT SUPPORT
This study was supported by funding from the National Basic Research Program of China (2013CB127302), the National Natural Science Foundation of China (31330075), the Major International Joint Research Program of China (31110103909), the Natural Science Foundation of Guangdong Province, China (2015A030310524), the Science and Technology Planning Project of Guangzhou, Guangdong Province, China (201510010020), and the National Youth Fund Project of China (31501959).
REFERENCES
1. Brosnan JT and Brosnan ME. Glutamate: a truly functional amino acid. Amino Acids. 2013; 45:413-418.
2. Burrin DG and Barbara S. Metabolic fate and function of dietary glutamate in the gut. Am J Clin Nutr. 2009; 90:850S-856S.
3. Lin M, Zhang B, Yu C, Li J, Zhang L, Sun H, Gao F and Zhou G. L-Glutamate supplementation improves small intestinal architecture and enhances the expressions of jejunal mucosa amino acid receptors and transporters in weaning piglets. PLoS One. 2014; 9:e111950.
4. Zhang J, Yin YL, Shu XG, Li TJ, Li FN, Tan B, Wu ZL and Wu GY. Oral administration of MSG increases expression of glutamate receptors and transporters in the gastrointestinal tract of young piglets. Amino Acids. 2013; 45:1169-1177.
5. Fan MZ, Matthews JC, Etienne NMP, Barbara S, Dale L and Burrin DG. Expression of apical membrane L-glutamate transporters in neonatal porcine epithelial cells along the small intestinal crypt-villus axis. Am J Physiol-Gastr L. 2004; 287:G385-G398.
6. Li XG, Sui WG, Gao CQ, Yan HC, Yin YL, Li HC and Wang XQ. L-Glutamate deficiency can trigger proliferation inhibition via the mTOR/S6K1 pathway in intestinal porcine epithelial cells. J Anim Sci. 2016; doi: 10.2527/jas.2015-9432.
7. Li XG, Sui WG, Yan HC, Jiang QY and Wang XQ. The in ovo administration of L-trans pyrrolidine-2, 4-dicarboxylic acid regulates small intestinal growth in chicks. Animal. 2014; 8:1677-1683.
8. Landeghem FKHV, Stover JF, Bechmann I, Brück W, Unterberg A, Bührer C and Deimling AV. Early expression of glutamate transporter proteins in ramified microglia after controlled cortical impact injury in the rat. Glia. 2001; 35:167–179.
9. Bailey CG, Ryan RM, Thoeng AD, Ng C, King K, Vanslambrouck JM, Auray-Blais C, Vandenberg RJ, Bröer S and Rasko JEJ. Loss-of-function mutations in the glutamate transporter SLC1A1 cause human dicarboxylic aminoaciduria. J Clin Invest. 2011; 121:446-453.
10. Won SJ, Yoo BH, Brennan AM, Shin BS, Kauppinen TM, Berman AE, Swanson RA and Suh SW. EAAC1 gene deletion alters zinc homeostasis and exacerbates neuronal injury after transient cerebral ischemia. J Neurosci. 2010; 30:15409-15418.
11. Li L and Zuo Z. Glutamate transporter type 3 knockout reduces brain tolerance to focal brain ischemia in mice. J Cerebr Blood F Me. 2011; 31:1283-1292.
12. Taylor PM. Role of amino acid transporters in amino acid sensing. Am J Clin Nutr. 2014; 99:223S-230S.
13. Ham DJ, Lynch GS and Koopman R. Amino acid sensing and activation of mechanistic target of rapamycin complex 1: implications for skeletal muscle. Curr Opin Clin Nutr. 2016;19: 67-73.
14. Almilaji A, Pakladok T, Guo A, Munoz C, Föller M and Lang F. Regulation of the glutamate transporter EAAT3 by mammalian target of rapamycin mTOR. Biochem Bioph Res Co. 2012; 421:159-163.
15. Yao K, Yin Y, Li X, Xi P, Wang J, Lei J, Hou Y and Wu GY. Alpha-ketoglutarate inhibits glutamine degradation and enhances protein synthesis in intestinal porcine epithelial cells. Amino Acids. 2011; 42:2491-2500.
16. Bianchi MG, Bardelli D, Chiu M and Bussolati O. Changes in the expression of the glutamate transporter EAAT3/EAAC1 in health and disease. Cell Mol Life Sci. 2013; 71:2001-2015.
17. Zolotarev V, Khropycheva R, Uneyama H and Torii K. Effect of free dietary glutamate on gastric secretion in dogs. Ann Ny Acad Sci. 2009; 1170:87-90.
18. Rutten EP, Engelen MP, Schols AM and Deutz NEP. Skeletal muscle glutamate metabolism in health and disease: state of the art. Curr Opin Clin Nutr. 2005; 8:41-51.
19. Li XG, Chen XL and Wang XQ. Changes in relative organ weights and intestinal transporter gene expression in embryos from White Plymouth Rock and WENS Yellow Feather Chickens. Comp Biochem Phys A. 2013; 2:368-375.
20. Chen MX, Li XG, Yang JX, Gao CQ, Wang B, Wang XQ and Yan HC. Growth of embryo and gene expression of nutrient transporters in the small intestine of the domestic pigeon (Columba livia). J Zhejiang Univ Sci B. 2015; 16:511-523.
21. Gao CQ, Yang JX, Chen MX, Yan HC and Wang XQ. Growth curves and age-related changes in carcass characteristics, organs, serum parameters, and intestinal transporter gene expression in domestic pigeon (Columba livia). Poultry Sci. 2016; doi: 10.3382/ps/pev443.
22. Chen MX, Li XG, Yan HC, Wang XQ and Gao CQ. Effect of egg weight on composition, embryonic growth, and expression of amino acid transporter genes in yolk sac membranes and small intestines of the domestic pigeon (Columba livia). Poultry Sci. 2016; doi: 10.3382/ps/pew044.
23. Gonzalez LM, Williamson I, Piedrahita JA, Blikslager AT and Magness ST. Cell lineage identification and stem cell culture in a porcine model for the study of intestinal epithelial regeneration. PLoS One. 2013; 8:e66465.
24. Bai X and Jiang Y. Key factors in mTOR regulation. Cell Mol Life Sci. 2010; 67:239-253.
25. Gao CQ, Zhi R, Yang Z, Li HC, Yan HC and Wang XQ. Low dose of IGF‐I increases cell size of skeletal muscle satellite cells via Akt/S6K signaling pathway. J Cell Biochem. 2015; 116:2637-2648.
26. Li FN, Yin YL, Tan B, Kong XF and Wu GY. Leucine nutrition in animals and humans: mTOR signaling and beyond. Amino Acids. 2011; 41:1185-1193.
27. Abraham RT. Making sense of amino acid sensing. Science. 2015; 347.
28. Russell H, Taylor PM and Hundal HS. Amino acid transporters: roles in amino acid sensing and signalling in animal cells. Biochem J. 2003; 373:1-18.
29. Incorvaia L, Bronte G, Bazan V, Badalamenti G, Rizzo S, Pantuso G, Natoli C and Russo A. Beyond evidence-based data: scientific rationale and tumor behavior to drive sequential and personalized therapeutic strategies for the treatment of metastatic renal cell carcinoma. Oncotarget. 2016; doi:10.18632/oncotarget.7267.
30. Jensen AA, Fahlke C, Bjørn-Yoshimoto WE and Bunch L. Excitatory amino acid transporters: recent insights into molecular mechanisms, novel modes of modulation and new therapeutic possibilities. Curr Opin Pharmaco. 2015; 20:116-123.
31. Hundal HS and Taylor PM. Amino acid transceptors: gate keepers of nutrient exchange and regulators of nutrient signaling. Am J Physiol-Endoc M. 2009; 296:E603-613.
32. Hideyo S, Shinobu N, Kanako M, Kanako S, Michiko T and Shiro B. Transcriptional control of cystine/glutamate transporter gene by amino acid deprivation. Biochem Bioph Res Co. 2004; 325:109-116.
33. Jan L and Pamela M. Basal levels of eIF2alpha phosphorylation determine cellular antioxidant status by regulating ATF4 and xCT expression. J Biol Chem. 2009; 284:1106-1115.
34. Lewerenz J, Maher P and Methner A. Regulation of xCT expression and system xc- function in neuronal cells. Amino Acids. 2012; 42:171-179.
35. Langford MP, Redens TB and Texada DE. Excitatory amino acid transporters, xc- antiporter, γ-glutamyl transpeptidase, glutamine synthetase, and glutathione in human corneal epithelial cells. Springer New York. 2015; 67-82 pp.
36. Yin J, Ren WK, Yang G, Duan JL, Huang XG, Fang RJ, Li CY, Li TJ, Yin YL, Hou YQ, Kim SW and Wu GY. L-Cysteine metabolism and its nutritional implications. Mol Nutr Food Res. 2015; 60:134-146.
37. Nishikawa T, Tomiya T, Ohtomo N, Inoue Y, Ikeda H, Tejima K, Watanabe N, Tanoue Y, Omata M and Fujiwara K. Stimulation by glutamine and proline of HGF production in hepatic stellate cells. Biochem Bioph Res Co. 2007; 363:978-982.