
INTRODUCTION
MicroRNAs (miRNAs) are a class of small single-stranded non-coding RNA molecules which regulate gene expression by inducting cleavage or inhibiting translation of target mRNAs [1]. These small non-coding RNAs play crucial roles in many biological processes, such as proliferation, differentiation and apoptosis, and are related to varieties of disorders [1, 2]. Modulation of aberrantly expressed miRNAs has been demonstrated as a feasible strategy for many diseases [3]. At present, many kinds of miRNA modulators have been used in preclinical and clinical studies, such as antisense oligonucleotides (also known as anti-miRs), miRNA sponges, miRNA mimics [4–6]. Therefore, targeting dysregulated miRNA is a potential therapeutic regimen to develop miRNA specific drugs [7]. For example, SPC3649 (a kind of locked nucleic acid) is the first miRNA-targeted drug in clinical trials to inhibit miR-122 expression that is required by hepatitis C virus replication [8]. However, the major hurdles in oligonucleotides-based therapy are the properties of inefficient delivery and suboptimal pharmacodynamics or pharmacokinetics, which urgently need for small molecule-based intervention strategies [9]. Small molecules maybe suitable agents to regulate miRNA expression, because they are less expensive to produce, easily diffuse across cell membranes, easily delivered into cells as well as having good solubility, bioavailability, and metabolic stability [10]. For example, Bose et al. have identified the small molecule streptomycin, which is widely used for treatment of tuberculosis, as an inhibitor of miR-21 with a potential cancer therapeutic. Moreover, streptomycin could decrease miR-21 expression without affecting the expression levels of other related miRNAs [11].
Currently, a wide number of studies have devoted to develop high-throughput methods to screen small molecule modifiers of miRNAs, which may provide a new direction for miRNA-targeting therapies [4, 12–14]. Zhang et al. have presented the structure-based approaches, such as molecular docking, to screen compounds that targeting miRNAs [10]. In another structure-based method, Bose et al. reported a novel fluorescent molecular-beacon-based high-throughput method to screen small molecules which inhibited miRNA expression by blocking the Dicer processing [4]. Besides the structure based method, Jiang et al. proposed a novel method to construct small molecule-miRNA networks for 23 different cancers based on the similarity of transcriptional responses [15]. Similar work has also been done for Alzheimer’s disease [16]. However, since lack of miRNA-transfected datasets, we simulated the transcriptional responses of miRNA perturbation through intersecting target genes and differential expressed genes of specific disease. Along with the growth of miRNA transfection experiments, it is possible to regard the effects of the miRNA on gene expression at whole genome level, which more directly reflects alteration of gene expression affected by the perturbed miRNA. What’s more, miREnvironment and SM2miR database have been constructed to collect the experimentally supported associations between small molecules and miRNAs [17, 18], Currently, miREnvironment database have collected complex interactions (3857 entries) among 1242 miRNAs, 305 phenotypes and 394 environment factors (including a few small molecules). SM2miR database have collected the 5160 records between 255 small molecules and 1680 miRNAs, and provided the effects (up-regulated and down-regulated) of small molecules on miRNA expression, and integrated all associations between drugs and miRNAs in miREnvironment database.
In this study, we proposed a novel approach to predict potential associations between small molecules and miRNAs based on functional similarity of differentially expressed genes of drug treatment and miRNA perturbation. In addition, through integrating the identified small molecule-miRNA associations with curated disease related miRNAs, we predicted drug-disease associations, which were used for drug repositioning. Finally, the miRNAs related to several predicted potential breast cancer drugs had the ability to distinguish patients with good or poor prognosis (the workflow diagram was shown in Figure 1). In a word, our method provides a novel prospect for developing miRNA-targeted drugs and predicting drug repositioning.
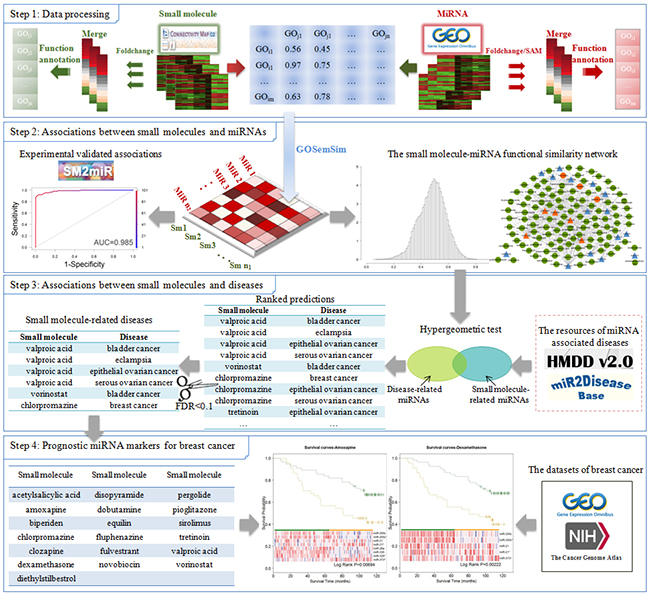
Figure 1: The workflow diagram of our approach.
RESULTS
Small molecule-miRNA functional similarity network
In order to construct the functional similarity network between small molecules and miRNAs, we first collected gene expression profiles under perturbation of 88 miRNAs and treatment of 1309 bioactive small molecules. Second, we identified differentially expressed genes for small molecules and miRNAs. Then, we calculated functional similarity based on Gene Ontology (GO) enrichment analysis of the differentially expressed genes for each pair of small molecule and miRNA. As a result, we obtained the functional annotations of 1293 small molecules and 70 miRNAs (details in materials and methods). Here, similarity scores followed an approximate normal distribution with mean and standard deviation equaling to 0.4882 and 0.0965, respectively (Figure 2). The threshold of similarity score was determined by the value of the normal distribution at the significance level of 0.01, which was 0.7127. Finally, we constructed the small molecule-miRNA functional similarity network (538 associations) under the threshold of similarity score (0.7127), including 111 small molecules and 20 miRNAs (Figure 3, details in Supplementary Table S1). Especially, all 20 miRNAs in our predicted associations have been proved to play important roles in cancer, which were supported by previous studies. Taking miR-21 as an example, miR-21 is an oncogenic miRNA which is overexpressed in several tumors including breast cancer [19]. When suppressing the expression of miR-21 in breast cancer cells, cancer cells significantly reduced invasion and metastasis [20]. Its associated small molecule Tretinoin (the similarity score is 0.745) is also known as all-trans-retinoic acid, which is an important regulator of cell reproduction, proliferation and differentiation. In addition, Tretinoin is usually used to treat acute promyelocytic leukemia [21] and has been demonstrated to have potential therapeutic action in breast cancer [22]. Therefore, miR-21 may be a potential target for Tretinoin in the treatment of breast cancer.
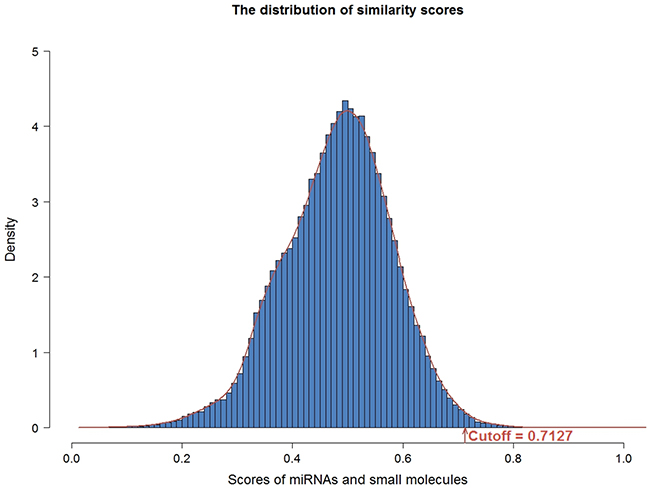
Figure 2: The distribution of functional similarity scores. The similarity scores followed an approximate normal distribution with the mean and standard deviation equaling 0.4882 and 0.0965. The cutoff was determined by the value of the normal distribution at the significance level of 0.01, which was 0.7127.
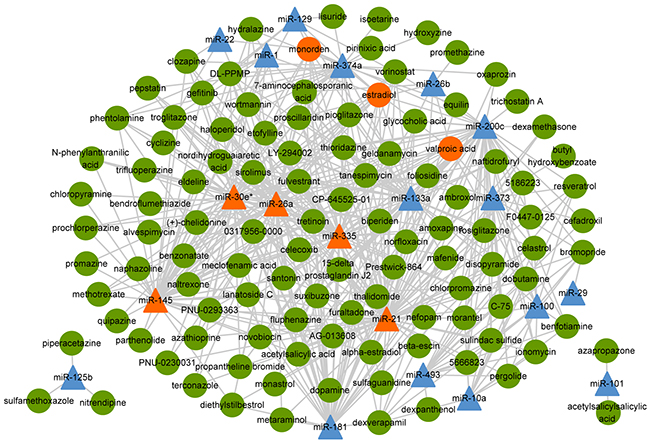
Figure 3: The small molecule-miRNA functional similarity network. The triangles and circles represent miRNAs and small molecules, respectively. The orange triangles and circles are hub nodes of miRNAs (degree greater than 50) and small molecules (degree greater than 10), respectively.
Next, we explored the topological properties of this similarity network. As shown in Supplementary Figure S1a, most small molecules (~40%) connected with a small number of miRNAs (less than 20%). In Supplementary Figure S1b, most miRNAs (50%) connected with a small number of small molecules (less than 20%).
Furthermore, we determined the characteristics of small molecule pairs connecting with the same miRNA or miRNA pairs connecting with the same small molecule. First, we computed the Meet/Min score for each pair of miRNAs to evaluate the extent of shared target genes [15, 16]. The Meet/min score between two miRNAs was defined as the number of common target genes of two miRNAs divided by the small number of target genes of the two miRNAs. Our result showed that miRNA pairs connected with the same small molecule had moderate target similarity (p = 0.1892). Second, we employed the two-dimensional Tanimoto chemical similarity score, which was measured by Small Molecule Subgraph Detector (SMSD) software [23], to evaluate the structural similarity between small molecules. The findings indicated that the small molecule pairs connecting with the same miRNA had moderate structure similarity (p = 0.1223). All above results were consistent with the previous study [24].
In addition, we further checked the potential relationship between functional similarity and the number of common targets of small molecule-miRNA pairs. We collected FDA approved drugs and their target information from the DrugBank database (http://www.drugbank.ca/), which included 624 small molecule drugs and 378 drug targets intersected with our dataset [21]. Meanwhile, we obtained the experimentally validated miRNA target genes from miRecords (Release 4.0) [25], miRTarBase (Release 4.5) [26], and TarBase (Release 6.0) [27]. Through integrating these regulations, we finally got 16510 miRNA-target gene pairs for 70 miRNAs in our study. For each association between FDA approved small molecule drug and miRNA, we counted the common target genes and compared with the similarity scores of these associations (Figure 4). The results demonstrated that the association with the higher similarity score tended to have the larger number of common target genes (Spearman’s rank correlation r = 1, p = 0.017).
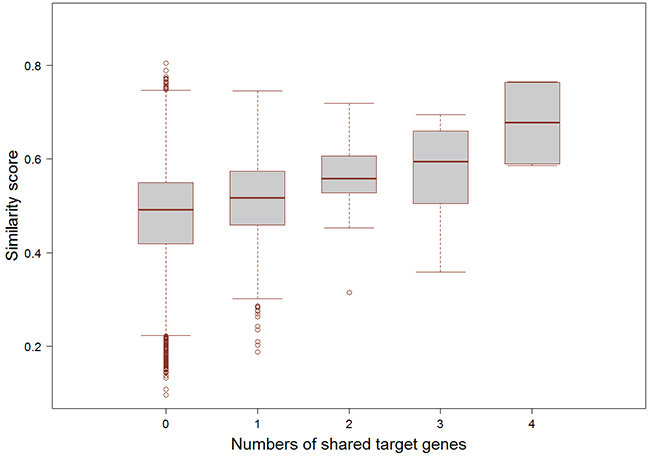
Figure 4: The relationship of the numbers of common target genes and the functional similarity scores. The x-coordinate is the number of shared target genes between FDA-approved small molecule and miRNA, and the y-coordinate is the similarity score between the pair of small molecule and miRNA.
Evaluation of the identified associations between small molecules and miRNAs
The receiver-operating characteristic (ROC) curve was employed to evaluate the performance of our approach base on the known small molecule-miRNA associations from SM2miR database (http://bioinfo.hrbmu.edu.cn/SM2miR/). First, we obtained 110 associations between small molecules and miRNAs in SM2miR database, which also appeared in this study. The 110 associations were considered as gold standard set. For each association in the gold standard set, we randomly selected the same number of GO terms of the miRNA and recalculated the similarity between the randomly GO terms and the GO terms of small molecule. This procedure was repeated 99 times and produced 99 fake functional similarity scores for each association. Considering the associations in the gold standard set as the positive instances and fake associations as negative instances, we calculated the sensitivity and the specificity of our approach at different cutoffs and plotted ROC curve (Figure 5). The area under roc curve (AUC) was 0.985, which suggested that the gold standard set indeed ranked on the higher position among 11000 pairs (110 true associations and 10890 fake associations). This result indicated that our approach achieved good performance in prediction of associations between small molecules and miRNAs.
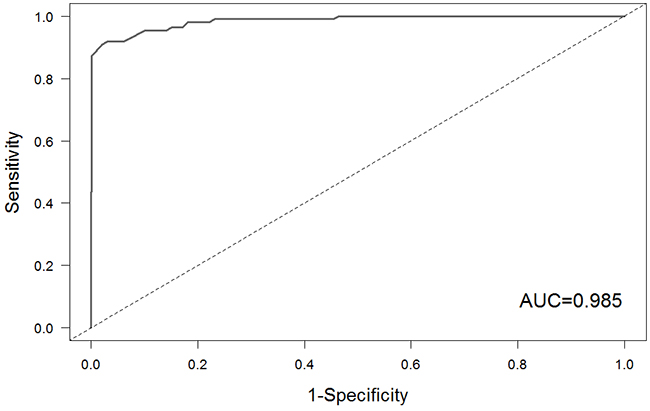
Figure 5: The ROC curve of our method based on the gold standard set.
Prediction of drug indication based on small molecule-miRNA associations
The small molecule and miRNA functional similarity network could be used to predict drug repositioning. First, we collected experimentally validated disease related miRNAs from miR2disease [28]and HMDD (version 2.0) [29] databases. Then, we integrated these two databases and obtained 8134 associations between miRNAs and diseases in total. All redundant associations were removed via converting the similar disease names into MeSH unique IDs (http://www.ncbi.nlm.nih.gov/mesh). For the 20 miRNAs in the identified small molecule-miRNA functional similarity network, we obtained 506 miRNA-disease associations, involving 192 diseases. Combining the predicted 538 small molecule-miRNA associations in this study, we identified statistically significant small molecules-diseases pairs based on shared miRNAs by hypergeometric test. At the cutoff of adjusted p-value (FDR) < 0.1, 2265 pairs between 50 FDA-approved drugs and 155 diseases were identified. Among them, in 53 pairs, the drugs have already been used for treatment of the corresponding disorders, and ~35% (779/2265) pairs, involving 43 FDA-approved drugs and 128 diseases, have been supported by in vitro or in vivo experiments in previous studies. For example, the association of acetylsalicylic acid and colorectal cancer was significant in our prediction (p=0.006, FDR=0.061). Acetylsalicylic acid (also known as aspirin) is a common drug for treatment of mild to moderate pain and clinically indicated in the treatment of others disorder, such as arterial and venous thrombosis [21]. The effectiveness of Acetylsalicylic acid in regulating growth and differentiation of cancer, such as colorectal cancer, has also been reported in vitro and in vivo experiments [30–33]. Thus, the predicted potential drug indications based on the common miRNAs of small molecules and diseases might be used for drug repositioning.
Identification of prognosis marker miRNAs for breast cancer
In this study, 19 small molecule drugs were predicted to associate with breast cancer. 12 out of 19 small molecule drugs have been supported in previous studies (Table 1). In order to investigate whether miRNAs that were associated with these small molecules could stratify patients into different prognosis groups, we collected datasets including miRNA expression and clinical information from The Cancer Genome Atlas (TCGA) and Gene Expression Omnibus (GEO) database. In TCGA database, we obtained 465 breast cancer samples with miRNA expression and clinical information. All miRNA expression profiles were processed and calculated for RPM (reads per million). In GEO database, we obtained one dataset with enough samples (GEO accession number: GSE19783, 99 patients). All miRNA expression was quantified using Agilent Human miRNA Microarray 2.0. For each small molecule drug, we firstly extracted expressions of miRNAs associated with this small molecule. And then, we classified all patients into two groups using K-means cluster method (K=2) based on these miRNAs expression.
Table 1: Predicted small molecule-disease associations in breast cancer
small molecule |
p-value |
FDR |
PMID |
|---|---|---|---|
Chlorpromazine |
0.022865 |
0.081112 |
-- |
Dobutamine |
0.00804 |
0.062879 |
-- |
Acetylsalicylic acid |
0.022865 |
0.081112 |
24945997 |
Dexamethasone |
0.013933 |
0.070355 |
25556455 |
Diethylstilbestrol |
0.013933 |
0.070355 |
25278253 |
Equilin |
0.013933 |
0.070355 |
Treatment |
Fluphenazine |
0.022865 |
0.081112 |
3695509 |
Fulvestrant |
0.022865 |
0.081112 |
25876901 |
Novobiocin |
0.00804 |
0.062879 |
20039369 |
Pioglitazone |
0.022865 |
0.081112 |
23959881 |
Sirolimus |
0.023168 |
0.081467 |
24099044 |
Tretinoin |
0.022865 |
0.081112 |
23602051 |
Valproic acid |
0.000677 |
0.036818 |
20159363 |
Vorinostat |
0.023168 |
0.081467 |
24903226 |
Amoxapine |
0.00804 |
0.062879 |
-- |
Biperiden |
0.009832 |
0.062879 |
-- |
Clozapine |
0.020443 |
0.077678 |
-- |
Disopyramide |
0.003099 |
0.052926 |
-- |
Pergolide |
0.001621 |
0.046908 |
-- |
Note: “Treatment” indicates that the small molecule is a FDA approved drug for treatment of breast cancer. “--” represents that the associations haven't verified by literatures. The red records represent four small molecule drugs that their associated miRNAs could stratify patients into good and poor prognostic groups both in TCGA and GEO database.
Finally, we discovered that 19 and 4 small molecule-related miRNAs could classify the breast cancer patients into high-risk and low-risk groups significantly (log-rank test p-value < 0.05) in TCGA and GEO datasets, respectively (Figure 6 and Supplementary Figure S2). The four small molecule drugs were marked red in Table 1. It was observed that miR-200c had associated with all of the four small molecules and tended to up-regulated in good prognosis groups. Analogously, we also found that miR-26a was related to two of the four small molecule drugs and tended to be up-regulated in good prognosis groups (Table 2). In breast cancer, miR-200c and miR-26a have been proved to be aberrantly expressed [34–37]. MiR-200c, the predominant member of the miR-200 family, could inhibit migration, invasion and cell polarization cancer-related processes [36]. MiR-26a has been reported as tumor suppressor miRNA and inhibited proliferation and migration through repression of MCL-1 (an anti-apoptotic member of the Bcl-2 family) in breast cancer [37]. These findings proved that the miRNAs related to small molecule drugs may be an efficient strategy for predicting the prognosis of diseases.
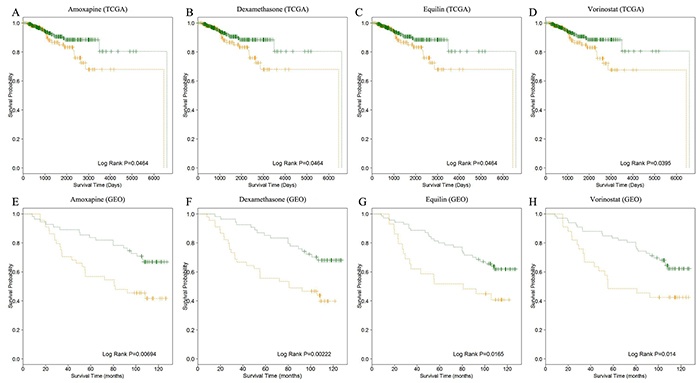
Figure 6: The survival analysis of breast cancer patients. A, B, C, D. shows the Kaplan–Meier curves of good (in green) and poor (in orange) prognosis groups based on the TCGA datasets. Analogously, E, F, G, H. shows the Kaplan–Meier curves prognosis of good (in green) and poor (in orange) prognosis groups for the four small molecule drugs based on GEO datasets.
Table 2: The fold change of miR-200c and miR-26a expression between good and poor prognosis groups (TCGA and GEO).
Datasets |
MiRNA |
Amoxapine |
Dexamethasone |
Equilin |
Vorinostat |
|---|---|---|---|---|---|
TCGA |
miR-200c-3p |
1.270 |
1.270 |
1.270 |
1.274 |
miR-200c-5p |
1.062 |
1.062 |
1.062 |
1.060 |
|
miR-26ac-3p |
1.832 |
-- |
-- |
1.815 |
|
miR-26ac-5p |
1.113 |
-- |
-- |
1.116 |
|
GEO |
miR-200c-3p |
1.076 |
1.130 |
1.123 |
1.051 |
miR-200c-5p |
1.455 |
1.813 |
1.623 |
1.183 |
|
miR-26a-5p |
1.027 |
-- |
-- |
1.053 |
Note: “--” represented that the small molecule drug was not related to the miRNA in our methods.
DISCUSSION
In this study, we successfully identified the associations between small molecules and miRNAs through calculating the functional similarities of their perturbed genes. We firstly collected the miRNA perturbed gene expression profiles from GEO database. In previous studies, because of lacking the miRNA transfection datasets, we simulated the dysregulated genes of miRNA perturbation through intersecting miRNA’s target genes and differentially expressed genes of one disease. Along with the miRNA transfection datasets, the effects of the miRNA on gene expression at the whole genome level more directly reflect the alteration of gene expression affected by miRNA. Meanwhile, we obtained the small molecule perturbed gene expression profiles from the Connectivity Map (cMap, build 02) database [38]. These expression profiles reflect the transcription response to small molecules rather than the ‘putative target’ that the small molecule can be modulating. Based on the transcription responses perturbed by small molecule, some research focusing on broader themes of mechanism of action (MoA) elucidation [39, 40], drug repositioning [41, 42] and biological understanding [43, 44] have been performed. Moreover, we selected the transcription profiles of cell lines treated by small molecules and miRNAs to screen the perturbed genes. The functional similarity score for each pair of small molecule and miRNA was finally calculated based on the GO annotations of their perturbed genes.
Consequently, we identified 538 associations between 111 small molecules and 20 miRNAs. What’s more, we obtained the curated small molecule-miRNA associations from SM2miR database as gold standard set to evaluate the performance of our approach. As a result, the AUC was 0.985. Furthermore, we identified small molecule-disease associations based on shared miRNAs, which provided a new way to predict the potential drug indications. Finally, survival analysis based on expression of miRNAs related to small molecule drugs for breast cancer revealed that these miRNAs might be good prognosis markers.
Some studies have devoted to predict the associations between small molecules and miRNAs. For example, Chen et al. predicted novel disease-related interactions between environmental factors (such as drugs) and miRNAs through a semi-supervised classifier based method [45]. Meng et al. proposed a novel method to predicted candidate small molecule-miRNA associations based on the similarity of transcription responses [46]. In this study, our approach tended to identify relationships between small molecules and miRNAs based on functional associations. Comparing with the transcription responses, functions were usually more reproducible.
In conclusion, we presented an approach to identify associations between small molecules and miRNAs based on functional similarities, which might provide a valuable perspective for repurposing drugs and predicting novel drug targets.
MATERIALS AND METHODS
Gene expression profiles under miRNA perturbation
We collected gene expression profiles from the GEO database by keywords “miRNA transfection” or “microRNA transfection”. We only reserved datasets with both miRNA transfected samples and control samples. We obtained 110 gene expression profiles of miRNA mimics (mimic endogenous miRNAs) or inhibitors (inhibit endogenous miRNAs) transfection in multiple species. We only chose 92 miRNA perturbed gene expression profiles (excluding gene expression profiles perturbed by multiple miRNAs or edited miRNAs) in human for further analysis, which involved 88 miRNAs (see Supplementary Table S2).
For single channel gene expression profiles with greater than or equal to two samples in each sample class (“transfection” or “control”), we applied significance analysis of microarray (SAM) [47] to identify significantly differentially expressed genes (FDR<=0.05). Otherwise, we identified the differentially expressed genes by 2-fold change method. For double channel gene expression profiles, 2-fold change was also used to measure the extent of differential expression of probes in each sample. Then, the conflict genes (gene appeared both in up-regulated and in down-regulated sets) were discarded. Only genes that were up-regulated or down-regulated in more than half samples were defined as differentially expressed genes.
Because some gene expression profiles measured under the same miRNA perturbation, we should combine the differentially expressed genes in these datasets. If the genes were up-regulated or down-regulated consistently in more than 2 datasets, the genes were considered differentially expressed under the miRNA perturbation.
Gene expression profiles under small molecule treatment
We collected the small molecule perturbed gene expression profiles from the cMap. The cMap contains 6100 gene expression profiles of 1309 bioactive small molecules treatment and the corresponding controls. The differential expression was measured by amplitude (A), which was defined as:
where t is the expression value of the probe in treatment group, c is the expression value in the control group. We defined that the probes with more than 2-foldchange between treatment and control group as the differentially expressed probes. Namely, the A value more than 2/3 means up-regulation, while the A value less than -2/3 means down-regulation.
Several gene expression profiles were measured under the treatment of the same small molecule, so we should combine the differential expressed genes of the same small molecule. Analogous to the differentially expressed genes of miRNA, only genes that were up-regulated or down-regulated in at least two expression profiles were considered as the differentially expressed genes.
Functional enrichment analysis of small molecules and miRNAs
For the differentially expressed genes of miRNA (or small molecule), we implemented function enrichment analysis by the R package GOSim [48]. The version of GOSim package that we used in this study was 1.2.7.7. Biological Process (BP) was selected as the annotation category. Here, we chose the “elim” method, which improved the enrichment analysis via removing the genes mapped to significant GO terms from all their ancestors and calculates the significance of these GO terms using Fisher’s exact test [49]. At the significance level of p < 0.01, we identified functions of 1293 small molecules and 70 miRNAs.
Functional similarity between small molecule and miRNA
For each pair of small molecule and miRNA, we calculated the functional similarity score based on the annotated GO function. We implemented the computational procedure of similarity analysis with the R package GOSemSim [50]. The version of GOSemSim that we used was 1.20.0. The GOSemSim presented five methods, including Resnik [51], Jiang [52], Lin [53], Schlicker [54]and Wang [55], to calculate the semantic similarity of two given GO terms and four measures, including max, avg, rcmax and BMA, to combine semantic similarity scores of multiple GO terms. Here, we chose the widely used “Lin” and “BMA” methods. “Lin” method determined the semantic similarity of two given GO terms based on the annotation information content (IC). The IC of a GO term denoted that the negative logarithm of probability of the term appearing in the GO corpus.
The probability of a given GO term t is defined as:
where nt is the number of its all children nodes plus itself, and N is the total number of terms in GO corpus. The IC is defined as:
The Lin method is defined as:
where IC(MICA) is the information content of their closest common ancestor (t1 and t2), the method normalized similarity between two given terms ranging from 0 to 1. The similarities among two sets of GO terms could organize as a matrix. The “BMA” measurement used the best-match average strategy to calculate the average of all maximum similarities on each row and column. Here, we selected the “BMA” method to compare the semantic similarity between two GO term sets.
The targets of miRNAs
Previous studies indicated that a combination of multiple algorithms might increase the reliable of miRNA targets [56]. Thus, we obtained miRNA targets from seven prediction algorithms as previous study [57], including DIANA-microT [58], miRanda [59], RNA22 [60], RNAhybrid [61], TargetScan [62], miRBase Targets [63] and Pictar [64]. Only miRNA targets that were predicted in at least two algorithms were considered as reliable. In total, we obtained 289469 miRNA regulations for 776 miRNAs.
Chemical structure similarity between two small molecules
In order to calculate structure similarity between two small molecules, we download the SDF file from Pubchem database (https://pubchem.ncbi.nlm.nih.gov/) [65]. The small molecules without structure information were filtered out. The two-dimension Tanimoto chemical similarity score between small molecules was calculated by the SMSD software.
Survival analysis of breast cancer patients
In this study, we identified 19 potential small molecule drugs for breast cancer, in which 12 drugs have been validated by previous publication. Next, we further investigated whether the miRNAs that associated with the potential breast cancer drugs could distinguish breast cancer patients with good or poor outcome. Thus, we first collected breast cancer samples with miRNA expression and clinical information from TCGA and GEO database (GSE19783). As a result, we obtained 465 and 99 breast cancer patients from these two data resources, respectively. Then, we used the K-means cluster method (K=2) to cluster the patients into two groups based on miRNA expression. Finally, we used log-rank test to evaluate the statistical significant of difference between the two groups, and drew the Kaplan-Meier curve of the two different prognostic groups with R package survival.
ACKNOWLEDGMENTS
Funding: This work was supported by the Foundation for The National Natural Science Foundation of China [31401134, 61571169, 31501078] and the Natural Science Foundation of Heilongjiang Province of China [QC2014C017], and the University Nursing Program for Young Scholars with Creative Talents in Heilongjiang Province [UNPYSCT-2015037].
CONFLICTS OF INTEREST
Competing financial interests: The authors declare no competing financial interests.
REFERENCES
1. Slaby O, Svoboda M, Michalek J and Vyzula R. MicroRNAs in colorectal cancer: translation of molecular biology into clinical application. Mol Cancer. 2009; 8:102.
2. Small EM and Olson EN. Pervasive roles of microRNAs in cardiovascular biology. Nature. 2011; 469:336-342.
3. Medina PP, Nolde M and Slack FJ. OncomiR addiction in an in vivo model of microRNA-21-induced pre-B-cell lymphoma. Nature. 2010; 467:86-90.
4. Bose D, Jayaraj GG, Kumar S and Maiti S. A molecular-beacon-based screen for small molecule inhibitors of miRNA maturation. ACS chemical biology. 2013; 8:930-938.
5. Costa PM and Pedroso de Lima MC. MicroRNAs as Molecular Targets for Cancer Therapy: On the Modulation of MicroRNA Expression. Pharmaceuticals (Basel). 2013; 6:1195-1220.
6. van Rooij E and Kauppinen S. Development of microRNA therapeutics is coming of age. EMBO Mol Med. 2014; 6:851-864.
7. Garzon R, Marcucci G and Croce CM. Targeting microRNAs in cancer: rationale, strategies and challenges. Nature reviews Drug discovery. 2010; 9:775-789.
8. Lanford RE, Hildebrandt-Eriksen ES, Petri A, Persson R, Lindow M, Munk ME, Kauppinen S and Orum H. Therapeutic silencing of microRNA-122 in primates with chronic hepatitis C virus infection. Science. 2010; 327:198-201.
9. Castanotto D and Rossi JJ. The promises and pitfalls of RNA-interference-based therapeutics. Nature. 2009; 457:426-433.
10. Zhang S, Chen L, Jung EJ and Calin GA. Targeting microRNAs with small molecules: from dream to reality. Clin Pharmacol Ther. 2010; 87:754-758.
11. Bose D, Jayaraj G, Suryawanshi H, Agarwala P, Pore SK, Banerjee R and Maiti S. The tuberculosis drug streptomycin as a potential cancer therapeutic: inhibition of miR-21 function by directly targeting its precursor. Angewandte Chemie. 2012; 51:1019-1023.
12. Monroig Pdel C, Chen L, Zhang S and Calin GA. Small molecule compounds targeting miRNAs for cancer therapy. Adv Drug Deliv Rev. 2015; 81:104-116.
13. Vo DD, Staedel C, Zehnacker L, Benhida R, Darfeuille F and Duca M. Targeting the production of oncogenic microRNAs with multimodal synthetic small molecules. ACS chemical biology. 2014; 9:711-721.
14. Jamal S, Periwal V, Consortium O and Scaria V. Computational analysis and predictive modeling of small molecule modulators of microRNA. J Cheminform. 2012; 4:16.
15. Jiang W, Chen X, Liao M, Li W, Lian B, Wang L, Meng F, Liu X, Jin Y and Li X. Identification of links between small molecules and miRNAs in human cancers based on transcriptional responses. Sci Rep. 2012; 2:282.
16. Meng F, Dai E, Yu X, Zhang Y, Chen X, Liu X, Wang S, Wang L and Jiang W. Constructing and characterizing a bioactive small molecule and microRNA association network for Alzheimer’s disease. J R Soc Interface. 2014; 11:20131057.
17. Liu X, Wang S, Meng F, Wang J, Zhang Y, Dai E, Yu X, Li X and Jiang W. SM2miR: a database of the experimentally validated small molecules’ effects on microRNA expression. Bioinformatics. 2013; 29:409-411.
18. Yang Q, Qiu C, Yang J, Wu Q and Cui Q. miREnvironment database: providing a bridge for microRNAs, environmental factors and phenotypes. Bioinformatics. 2011; 27:3329-3330.
19. Yan LX, Huang XF, Shao Q, Huang MY, Deng L, Wu QL, Zeng YX and Shao JY. MicroRNA miR-21 overexpression in human breast cancer is associated with advanced clinical stage, lymph node metastasis and patient poor prognosis. Rna. 2008; 14:2348-2360.
20. Zhu S, Wu H, Wu F, Nie D, Sheng S and Mo YY. MicroRNA-21 targets tumor suppressor genes in invasion and metastasis. Cell research. 2008; 18:350-359.
21. Wishart DS, Knox C, Guo AC, Cheng D, Shrivastava S, Tzur D, Gautam B and Hassanali M. DrugBank: a knowledgebase for drugs, drug actions and drug targets. Nucleic acids research. 2008; 36:D901-906.
22. Uray IP and Brown PH. Prevention of breast cancer: current state of the science and future opportunities. Expert opinion on investigational drugs. 2006; 15:1583-1600.
23. Rahman SA, Bashton M, Holliday GL, Schrader R and Thornton JM. Small Molecule Subgraph Detector (SMSD) toolkit. J Cheminform. 2009; 1:12.
24. Martin YC, Kofron JL and Traphagen LM. Do structurally similar molecules have similar biological activity? J Med Chem. 2002; 45:4350-4358.
25. Xiao F, Zuo Z, Cai G, Kang S, Gao X and Li T. miRecords: an integrated resource for microRNA-target interactions. Nucleic acids research. 2009; 37:D105-110.
26. Hsu SD, Lin FM, Wu WY, Liang C, Huang WC, Chan WL, Tsai WT, Chen GZ, Lee CJ, Chiu CM, Chien CH, Wu MC, Huang CY, Tsou AP and Huang HD. miRTarBase: a database curates experimentally validated microRNA-target interactions. Nucleic acids research. 2011; 39:D163-169.
27. Sethupathy P, Corda B and Hatzigeorgiou AG. TarBase: A comprehensive database of experimentally supported animal microRNA targets. Rna. 2006; 12:192-197.
28. Jiang Q, Wang Y, Hao Y, Juan L, Teng M, Zhang X, Li M, Wang G and Liu Y. miR2Disease: a manually curated database for microRNA deregulation in human disease. Nucleic acids research. 2009; 37:D98-104.
29. Li Y, Qiu C, Tu J, Geng B, Yang J, Jiang T and Cui Q. HMDD v2.0: a database for experimentally supported human microRNA and disease associations. Nucleic acids research. 2014; 42:D1070-1074.
30. Maity G, De A, Banerjee S, Das A and Banerjee S. Aspirin prevents growth and differentiation of breast cancer cells: lessons from in vitro and in vivo studies. The FASEB Journal. 2013; 27:606.601.
31. Ricchi P, Pignata S, Di Popolo A, Memoli A, Apicella A, Zarrilli R and Acquaviva AM. Effect of aspirin on cell proliferation and differentiation of colon adenocarcinoma Caco-2 cells. International journal of cancer. 1997; 73:880-884.
32. Park IS, Jo JR, Hong H, Nam KY, Kim JB, Hwang SH, Choi MS, Ryu NH, Jang HJ, Lee SH, Kim CS, Kwon TG, Park GY, Park JW and Jang BC. Aspirin induces apoptosis in YD-8 human oral squamous carcinoma cells through activation of caspases, down-regulation of Mcl-1, and inactivation of ERK-1/2 and AKT. Toxicology in vitro. 2010; 24:713-720.
33. Garcia-Albeniz X and Chan AT. Aspirin for the prevention of colorectal cancer. Best practice & research Clinical gastroenterology. 2011; 25:461-472.
34. Chang BP, Wang DS, Xing JW, Yang SH, Chu Q and Yu SY. miR-200c inhibits metastasis of breast cancer cells by targeting HMGB1. Journal of Huazhong University of Science and Technology Medical sciences. 2014; 34:201-206.
35. Tan S, Ding K, Li R, Zhang W, Li G, Kong X, Qian P, Lobie PE and Zhu T. Identification of miR-26 as a key mediator of estrogen stimulated cell proliferation by targeting CHD1, GREB1 and KPNA2. Breast cancer research. 2014; 16:R40.
36. Jurmeister S, Baumann M, Balwierz A, Keklikoglou I, Ward A, Uhlmann S, Zhang JD, Wiemann S and Sahin O. MicroRNA-200c represses migration and invasion of breast cancer cells by targeting actin-regulatory proteins FHOD1 and PPM1F. Mol Cell Biol. 2012; 32:633-651.
37. Gao J, Li L, Wu M, Liu M, Xie X, Guo J and Tang H. MiR-26a inhibits proliferation and migration of breast cancer through repression of MCL-1. PloS one. 2013; 8:e65138.
38. Lamb J, Crawford ED, Peck D, Modell JW, Blat IC, Wrobel MJ, Lerner J, Brunet JP, Subramanian A, Ross KN, Reich M, Hieronymus H, Wei G, Armstrong SA, Haggarty SJ, Clemons PA, et al. The Connectivity Map: using gene-expression signatures to connect small molecules, genes, and disease. Science. 2006; 313:1929-1935.
39. Rho SB, Kim BR and Kang S. A gene signature-based approach identifies thioridazine as an inhibitor of phosphatidylinositol-3’-kinase (PI3K)/AKT pathway in ovarian cancer cells. Gynecologic oncology. 2011; 120:121-127.
40. Coombs GS, Schmitt AA, Canning CA, Alok A, Low IC, Banerjee N, Kaur S, Utomo V, Jones CM, Pervaiz S, Toone EJ and Virshup DM. Modulation of Wnt/beta-catenin signaling and proliferation by a ferrous iron chelator with therapeutic efficacy in genetically engineered mouse models of cancer. Oncogene. 2012; 31:213-225.
41. Sirota M, Dudley JT, Kim J, Chiang AP, Morgan AA, Sweet-Cordero A, Sage J and Butte AJ. Discovery and preclinical validation of drug indications using compendia of public gene expression data. Science translational medicine. 2011; 3:96ra77.
42. Claerhout S, Lim JY, Choi W, Park YY, Kim K, Kim SB, Lee JS, Mills GB and Cho JY. Gene expression signature analysis identifies vorinostat as a candidate therapy for gastric cancer. PloS one. 2011; 6:e24662.
43. Loboda A, Kraft WK, Fine B, Joseph J, Nebozhyn M, Zhang C, He Y, Yang X, Wright C, Morris M, Chalikonda I, Ferguson M, Emilsson V, Leonardson A, Lamb J, Dai H, et al. Diurnal variation of the human adipose transcriptome and the link to metabolic disease. BMC medical genomics. 2009; 2:7.
44. Vilar E, Mukherjee B, Kuick R, Raskin L, Misek DE, Taylor JM, Giordano TJ, Hanash SM, Fearon ER, Rennert G and Gruber SB. Gene expression patterns in mismatch repair-deficient colorectal cancers highlight the potential therapeutic role of inhibitors of the phosphatidylinositol 3-kinase-AKT-mammalian target of rapamycin pathway. Clinical cancer research. 2009; 15:2829-2839.
45. Chen X, Liu MX, Cui QH and Yan GY. Prediction of disease-related interactions between microRNAs and environmental factors based on a semi-supervised classifier. PloS one. 2012; 7:e43425.
46. Meng F, Wang J, Dai E, Yang F, Chen X, Wang S, Yu X, Liu D and Jiang W. Psmir: a database of potential associations between small molecules and miRNAs. Scientific reports. 2016; 6:19264.
47. Tusher VG, Tibshirani R and Chu G. Significance analysis of microarrays applied to the ionizing radiation response. Proc Natl Acad Sci U S A. 2001; 98:5116-5121.
48. Frohlich H, Speer N, Poustka A and Beissbarth T. GOSim--an R-package for computation of information theoretic GO similarities between terms and gene products. BMC bioinformatics. 2007; 8:166.
49. Alexa A, Rahnenfuhrer J and Lengauer T. Improved scoring of functional groups from gene expression data by decorrelating GO graph structure. Bioinformatics. 2006; 22:1600-1607.
50. Yu G, Li F, Qin Y, Bo X, Wu Y and Wang S. GOSemSim: an R package for measuring semantic similarity among GO terms and gene products. Bioinformatics. 2010; 26:976-978.
51. Resnik P. Semantic similarity in a taxonomy: An information-based measure and its application to problems of ambiguity in natural language. J Artif Intell Res. 1999; 11:95-130.
52. Jiang JJ and Conrath DW. Semantic similarity based on corpus statistics and lexical taxonomy. arXiv preprint cmp-lg/9709008. 1997.
53. Lin D. (1998). An information-theoretic definition of similarity. ICML, pp. 296-304.
54. Schlicker A, Domingues FS, Rahnenfuhrer J and Lengauer T. A new measure for functional similarity of gene products based on Gene Ontology. BMC bioinformatics. 2006; 7:302.
55. Wang M, Lamberth K, Harndahl M, Roder G, Stryhn A, Larsen MV, Nielsen M, Lundegaard C, Tang ST, Dziegiel MH, Rosenkvist J, Pedersen AE, Buus S, Claesson MH and Lund O. CTL epitopes for influenza A including the H5N1 bird flu; genome-, pathogen-, and HLA-wide screening. Vaccine. 2007; 25:2823-2831.
56. Jayaswal V, Lutherborrow M, Ma DD and Yang YH. Identification of microRNA-mRNA modules using microarray data. BMC Genomics. 2011; 12:138.
57. Li X, Jiang W, Li W, Lian B, Wang S, Liao M, Chen X, Wang Y, Lv Y and Yang L. Dissection of human MiRNA regulatory influence to subpathway. Brief Bioinform. 2012; 13:175-186.
58. Maragkakis M, Vergoulis T, Alexiou P, Reczko M, Plomaritou K, Gousis M, Kourtis K, Koziris N, Dalamagas T and Hatzigeorgiou AG. DIANA-microT Web server upgrade supports Fly and Worm miRNA target prediction and bibliographic miRNA to disease association. Nucleic acids research. 2011; 39:W145-148.
59. Betel D, Wilson M, Gabow A, Marks DS and Sander C. The microRNA.org resource: targets and expression. Nucleic acids research. 2008; 36:D149-153.
60. Miranda KC, Huynh T, Tay Y, Ang YS, Tam WL, Thomson AM, Lim B and Rigoutsos I. A pattern-based method for the identification of MicroRNA binding sites and their corresponding heteroduplexes. Cell. 2006; 126:1203-1217.
61. Kruger J and Rehmsmeier M. RNAhybrid: microRNA target prediction easy, fast and flexible. Nucleic acids research. 2006; 34:W451-454.
62. Grimson A, Farh KK, Johnston WK, Garrett-Engele P, Lim LP and Bartel DP. MicroRNA targeting specificity in mammals: determinants beyond seed pairing. Molecular cell. 2007; 27:91-105.
63. Griffiths-Jones S, Grocock RJ, van Dongen S, Bateman A and Enright AJ. miRBase: microRNA sequences, targets and gene nomenclature. Nucleic acids research. 2006; 34:D140-144.
64. Krek A, Grun D, Poy MN, Wolf R, Rosenberg L, Epstein EJ, MacMenamin P, da Piedade I, Gunsalus KC, Stoffel M and Rajewsky N. Combinatorial microRNA target predictions. Nature genetics. 2005; 37:495-500.
65. Wang Y, Xiao J, Suzek TO, Zhang J, Wang J and Bryant SH. PubChem: a public information system for analyzing bioactivities of small molecules. Nucleic acids research. 2009; 37:W623-633.