
INTRODUCTION
The incidence of metastatic malignant melanoma is gradually increasing [1–3]. The liver is most frequently involved in metastasis for patients with malignant melanoma. Ocular melanoma metastases show a high predilection for the liver, with frequent occurrence of exclusively hepatic metastases; in turn, metastatic liver disease is the leading cause of death [4–6]. The outcome of patients with liver metastases is generally poor. However, recent advances in melanoma treatment, such as immunotherapy and targeted therapy, provide new therapeutic options and improved treatment outcomes [2, 7].
Early and precise evaluation of treatment response is important for selecting an effective treatment plan, but is often challenging. Most of the methods used for tumor response evaluation, including the response evaluation criteria in solid tumors (RECIST) guideline, are designed to solely evaluate alterations in lesion size [8]. However, the response to anti-cancer therapy is often context-dependent, and it has been suggested that the performance of classical treatment response evaluation systems that primarily focus on anatomical assessments may not be efficient under certain circumstances [9]. For treatment response assessment of melanoma metastases, CT texture analysis or functional evaluation by PET-CT show encouraging results [10, 11]. These results suggest that alternative methods can have a complementary role to classical treatment response guidelines such as RECIST.
Malignant melanoma is hypervascular with high angiogenetic activity [12, 13]. For the modified RECIST (mRECIST) system, which assesses the treatment response of hypervascular hepatocellular carcinoma, only the enhancing region of a mass on the arterial phase of contrast-enhanced images is considered to represent the viable tumor [14, 15]. We hypothesized that the viable tumor concept described in mRECIST could be adopted for treatment response assessment of melanoma liver metastases. Therefore, lesion enhancement characteristics may be more meaningful than lesion anatomical size for treatment response assessment.
The purpose of this study was to determine whether the imaging features of contrast-enhanced dynamic MRI including the subtraction technique can be applied to predict the treatment response of hepatic metastases in patients with malignant melanoma.
RESULTS
Study population and treatment response assessment
According to the inclusion and exclusion criteria, the study population consisted of 15 patients with 41 metastatic liver lesions (Figure 1, Table 1). The metastatic lesion sizes measured on the precontrast T1-weighted images ranged between 0.7 to 4.7 cm (mean ± standard deviation = 1.78 ± 1.10 cm). On follow-up imaging, all lesions showed a residual lesion with the longest diameter ranging between 0.5 to 6 cm (mean ± standard deviation = 1.98 ± 1.47 cm). Treatment response assessment of each lesion was graded as non-progressive in 65.9% of lesions (n = 27/41, Figures 2 and 3) and as progressive in 34.1% of lesions (n = 14/41, Figures 2 and 4).
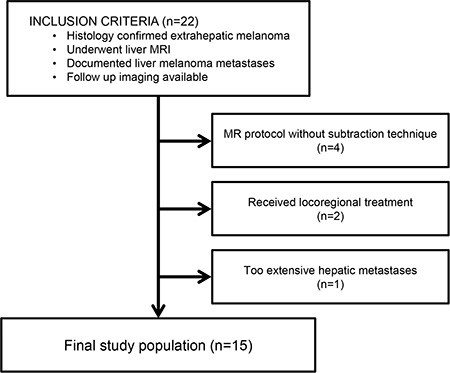
Figure 1: Eligibility criteria of the study population.
Table 1: Demographicsof the study population
Parameter |
Data |
|---|---|
No. of patients |
15 |
No. of lesions |
41 |
Gender |
|
No. of men |
11 (73.3%) |
No. of women |
4 (26.7%) |
Age in years(median and range) |
56 (21–81) |
Men |
58 (21–73) |
Women |
61 (39–81) |
Mean tumor size (cm) ± standard deviation (range) |
1.78 ± 1.10 (0.7–4.7) |
Primary Site |
|
Uvea |
13 (86.7%) |
Other |
2 (13.3%) |
Chemotherapy regimen during follow-up |
|
Dacarbazine |
7 (46.7%) |
Docetaxel + Carboplatin |
2 (13.3%) |
Paclitaxel + Carboplatin |
1 (6.7%) |
Cisplatin + Vincristine + Dacarbazine |
1 (6.7%) |
Immunotherapy |
2 (13.3%) |
None |
2 (13.3%) |
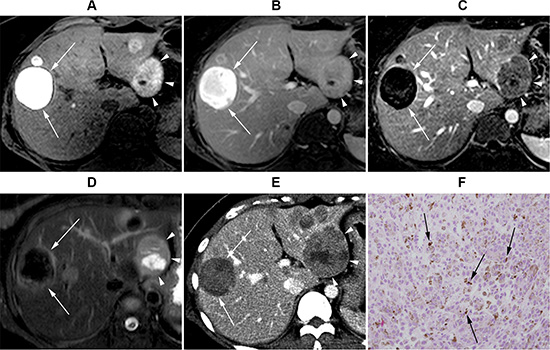
Figure 2: Gadoxeticacid-enhanced liver MRI of a 36-year-old female with uveal melanoma. (A) Precontrast T1-weighted image. (B) Post-contrast portal venous phase T1-weighted image. (C) Subtraction image (portal venous phase – precontrast T1 weighted image). (D) T2 weighted image. Segment 2 lesion (4.2 cm, arrowheads) displays positive enhancement on the subtraction image and intermediate high T2 signal intensity (SI), whereas segment 8 lesion (4.5 cm, arrows) displays negative enhancement and low T2 SI. (E) CT scan image at the same level obtained 2 months later. The segment 2 lesion (arrowheads) size has increased to 6.0 cm, whereas segment 8 lesion (arrows) is still 4.3 cm. (F) Histopathological examination [hematoxylin and eosin (H&E) stain ×200] of liver biopsy obtained from the segment 2 lesion revealed tumor cells with abundant intra-cytoplasmic melanin pigments (arrows), consistent with malignant melanoma.
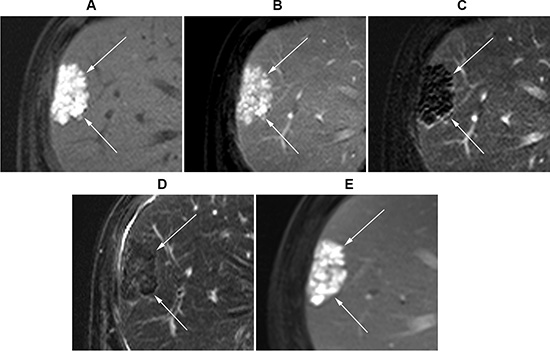
Figure 3: Gadoxeticacid-enhanced liver MR images of a 56-year-old male with uveal melanoma. (A) Precontrast T1-weighted image. (B) Post-contrast portal venous phase T1-weighted image. (C) Subtraction image (portal venous phase – precontrast T1-weighted image). (D) T2-weighted image. A 4.6 cm metastatic melanoma lesion (arrows) was observed in segment 8, which was graded to show negative enhancement and low T2 SI. (E) In follow-up MRI T1-weighted post-contrast-enhanced portal venous phase image, the lesion measured 4.3 cm.
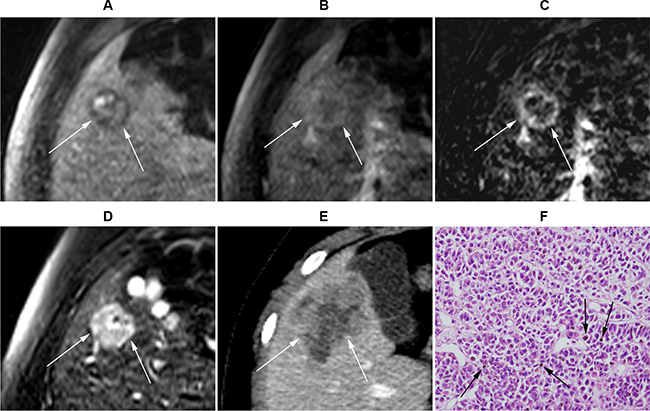
Figure 4: Gadoxetic acid-enhanced MRI of a 21-year-old male with uveal melanoma. (A) Precontrast T1-weighted MR image. (B) Post-contrast-enhanced portal venous phase T1-weighted image. (C) Subtraction image (portal venous phase – precontrastT1-weighted image). (D) T2-weighted image. A 2.2 cm (arrows) metastasis lesion at segment 5 is observed, which was graded to show positive enhancement and intermediate high T2 SI. (E) CT image at the same level obtained 2 months later demonstrated that the lesion size increased to 4.7 cm. (F) Histopathological exam (H&E stain ×200) of liver biopsy obtained from the S5 lesion revealed malignant cancer cells with melanin pigments (arrows), consistent with malignant melanoma.
Imaging characteristics
The presence or absence of enhancement for each lesion was first assessed on the routine dynamic contrast-enhanced images without subtraction images. Specifically, the reviewers compared the precontrast T1- weighted images with the arterial phase and/or portal venous phase images. The reviewers were able to detect positive enhancement in 14.6% (n = 6/41) of lesions. However, the reviewers were not able to determine whether or not enhancement existed in 85.4% (n = 35/41) of lesions, because the lesions already displayed high signal intensity (SI) on precontrastT1-weighted images (Figures 2A, 3A, and 4A), and the reviewers could not determine whether or not the lesions were further enhanced during the dynamic imaging study (Figures 2B, 3B, and 4B). The interobserver agreement was moderate (Cohen’s κ value = 0.55; 95% confidence interval, 0.18−0.93).
Next, the reviewers repeated contrast-enhancement assessment with the inclusion of subtraction images. During this assessment, the reviewers determined that 68.3% (n = 28/41) of lesions displayed positive enhancement (Figures 2C and 4C), whereas 31.7% (n = 13/41) of lesions displayed negative enhancement (Figures 2C and 3C). The interobserver agreement for enhancement based on subtraction sequences was good (Cohen’s κ value = 0.68; 95% confidence interval, 0.45−0.91) (Table 2).
Table 2: Univariate analysis of MR parameters with respect to treatment response
Number of lesions |
Interobserver agreement (Cohen’s κ, 95% confidence interval) |
Association with treatment response |
||||
|---|---|---|---|---|---|---|
Progression |
No progression |
P value |
Odds ratio (95% confidence interval) |
|||
Enhancement (analyzed without subtraction image) |
0.55 (0.18−0.93) |
|||||
Positive |
6/41 (14.6%) |
66.7% (4/6) |
33.3% (2/6) |
− |
− |
|
Indeterminable |
35/41 (85.4%) |
− |
− |
|||
Enhancement (analyzed with subtraction image) |
0.68 (0.45−0.91) |
0.048* |
12.1* (1.02−144.05) |
|||
Positive |
28/41 (68.3%) |
46.4% (13/28) |
53.6% (15/28) |
|||
Negative |
13/41 (31.7%) |
7.7% (1/13) |
92.3% (12/13) |
|||
T2 signal intensity |
0.85 (0.69−1.0) |
0.040* |
8.16* (1.10–60.67) |
|||
Intermediate high SI |
23/41 (56.1%) |
52.2% (12/23) |
47.8% (11/23) |
|||
Hypo-to-isointense SI |
18/41 (43.9%) |
11.1% (2/18) |
88.9% (16/18) |
|||
*Age, gender, and lesion size were adjusted.
Analysis of T2 SI classified 19.5% (n = 8/41) of lesions as hypointense (Figures 2D and 3D), 24.4% (n = 10/41) of lesions as isointense, and 56.1% (n = 23/41) of lesions as intermediate high SI (Figure 4D). None of the lesions displayed high (water) T2 SI. The interobserver agreement on T2 SI was excellent (Cohen’s κ value = 0.85; 95% confidence interval, 0.69−1.0).
Imaging parameters associated with treatment response
Analysis of lesion enhancement indicated that 46.4% (n = 13/28) of lesions with positive enhancement on subtraction images were progressive lesions, whereas 7.7% (n = 1/13) of lesions with negative enhancement were progressive lesions. Analysis with generalized estimating equations indicated that positive enhancement identified on subtraction images was significantly associated with lesion progression [(without adjustment: odds ratio = 10.4;95% confidence interval, 1.14–95.29; P = 0.038) and (with adjustment for age, gender, and tumor size:odds ratio = 12.1; 95% confidence interval, 1.02−144.05; P = 0.048)] (Table 2).
For intermediate high T2 SI, 52.2% (n = 12/23) of lesions were progressive, whereas 11.1% (n = 2/18) of hypointense to isointense lesions were progressive. Analysis with generalized estimating equations indicated that intermediate high T2 signal intensity was significantly associated with lesion progression compared with that of isointense to hypointense SI [(without adjustment: odds ratio = 8.73; 95% confidence interval, 1.93−39.38; P = 0.005) and (with adjustment for age, gender, and tumor size: odds ratio = 8.16;95% confidence interval, 1.10–60.67; P = 0.040)] (Table 2).
DISCUSSION
Malignant melanoma has a high incidence of metastasis, and prognosis is poor after metastasis has developed [2, 3]. Recent progress in treatment options, such as molecular target agents and immunotherapy, has expanded therapeutic options and the possibility of improved treatment outcome [16]. Therefore, early prediction of therapeutic response is crucial.
Most oncological treatment evaluation systems (such as RECIST) are based on determining changes in tumor size measured on anatomical imaging modalities [8]. However, recent studies suggest that the classical tumor response assessment that is solely based on changes in anatomical tumor size may not always be an efficient predictor of overall survival [10, 17]. Extensive tumor necrosis and/or spontaneous hemorrhage encountered during therapy are well-recognized scenarios that might lead to an increase in tumor size that is irrelevant for the real treatment response [18, 19]. Metastatic melanoma has been reported to frequently develop spontaneous hemorrhage [20–22]. Acute tumor hemorrhage can even be a consequence of rapid tumor response to targeted therapy against melanoma [23], which can result in a paradoxical increase in lesion size.
The mRECIST criteria, which consider only the viable portion of a tumor as actual tumor burden, are widely applied for treatment response assessment of hepatocellular carcinoma. According to this system, only the contrast-enhancing portion of the lesion on arterial phase images is meaningful [14]. Hepatocellular carcinoma and melanoma are both hypervascular tumors [24–27]. Therefore, we speculated that the concept of mRECIST criteria for viable hepatocellular carcinoma tumor assessment also may be valid for assessment of melanoma hepatic metastases, and hypothesized that the tumor enhancement profile on MRI would be associated with treatment response.
Without subtraction images, the assessment of contrast enhancement for melanoma hepatic metastatic tumors on MRI was challenging and was not feasible in most cases. In the majority of lesions (85.4%, n = 35/41), it was impossible to determine whether enhancement was present or absent. Melanoma lesions already displayed high T1 SI on precontrast images (Figures 2A, 3A, and 4A), which obscured the analysis of alteration in SI after gadolinium contrast injection (Figures 2B, 3B, and 4B). This T1 hyperintensity is a typical feature of melanoma, which is due to the T1 shortening effect generated by either the melanin pigment or blood products from intratumoral hemorrhages [28, 29].
The subtraction technique has been proven as an effective method to accurately determine lesion enhancement in hepatocellular carcinoma [30–33]. After the inclusion of subtraction images, the reviewers were able to assess the enhancement profile of all lesions: 68.3% (n = 28/41) of lesions showed positive enhancement (Figures 2C and 4C), whereas 31.7% (n = 13/41) showed negative enhancement (Figures 2C and 3C). Positive enhancement was associated with a higher risk of progression compared with those of lesions without enhancement (odds ratio = 12.1, P = 0.048).
Previous literature has reported that the success of subtraction technique lies on the accuracy of coregistration between the enhanced source image set and the precontrast image set [32, 33]. If the precontrast and postcontrast data sets are not obtained during the same breath hold (which is the case of liver MRI used in our study), respiratory misregistration is likely to occur, resulting in pseudo-enhancement artifact. The use of gadoxetic acid also raises an issue, for this contrast agent frequently accompanies acute transient dyspnea resulting in arterial phase image degradation [34, 35] which will accentuate misregistration. Therefore, we assumed that efforts to differentiate true tumor enhancement from pseudo-enhancement would be crucial.
In case of the imaging diagnosis of hepatocellular carcinoma, the presence of not only arterial phase enhancement but also delayed washout is critical and therefore each sequence must be separately analyzed [36, 37]. Meanwhile, we focused to precisely detect any enhancement that might occur within a melanoma metastatic lesion regardless of image phase and decided to analyze both subtraction image sets (arterial phase image set and portal venous phase image set each subtracted by precontrast series) together instead of separately. We believe this to be a simple but efficient way to accurately evaluate the presence or absence of enhancement, because pseudo-enhancement confusing in one image set frequently appears obvious in another image set obtained during a separate breath hold.
The T2 SI imaging parameter was also significantly related to treatment response. Lesions with intermediate highT2 SI had a higher tendency to progress compared with lesions with low-to-isointense SI (odds ratio = 8.16, P = 0.040). We believe that this is because T2 intermediate high SI generally represents soft tissue characteristics [38]. Dark T2 SI often represents old hemorrhage [39], which we believe often reflects a chronic, stable nature of the lesion.
Our study has some limitations. First, we did not obtain pathological confirmation for all 41 lesions analyzed. A thorough histological confirmation of stage IV lesions is clinically impossible, and we think that characteristic MRI features, such as precontrast T1 hyperintensity, are highly specific features that justify the imaging diagnoses. However, we acknowledge that our MRI-based approach could have caused selection bias by unintentionally excluding melanoma metastases with less obvious T1 hyperintensity (e.g., amelanotic melanoma). Second, the retrospective nature of this study hindered us from standardizing the follow-up protocol, which could have influenced treatment response assessment. Third, we adopted the concept of viable tumor described in mRECIST criteria, but used the classical concept based on tumor size changes for standard reference of treatment response. We acknowledge that a prospective study will enable more precise survival analysis methods to serve as standard reference for treatment response. Forth, subtraction technique often produces pseudo-enhancement artifact which sometimes closely resemble true enhancement. However, we tried to minimize potential confusion by interpreting multiple subtraction image sets obtained from separate breath holds. Last, the treatment regimen applied to our study population primarily included cytotoxic chemotherapy agents and rarely included molecular target therapy and/or immunotherapy. We recognize the possibility that the response patterns after treatment with these new therapies could differ from those of conventional cytotoxic chemotherapy.
In conclusion, MRI protocols including the subtraction technique are useful for treatment response assessment of melanoma liver metastases. The presence of lesion contrast enhancement and intermediate high T2 SI were significant features associated with a higher risk of lesion progression.
MATERIALS AND METHODS
Selection of study population
This retrospective study was approved by our institutional review board with waiver of informed consent. All data were analyzed anonymously. We reviewed our institutional electronic clinical database to collect patients with melanoma who developed hepatic metastasis and underwent liver MRI including the subtraction technique between January 2007 and February 2015. Patients that met all of the following criteria were selected (n = 22): (1) patients with histologically confirmed extrahepatic melanoma lesion who underwent liver MRI, (2) documented diagnosis of liver melanoma metastases in the liver biopsy/surgical resection pathology report and/or in the liver MRI report, and (3) follow-up contrast-enhanced liver CT or MRI study performed approximately 1−3 months after the liver MRI. The following exclusion criteria were applied to the selected patients: (1) contrast-enhanced MRI was performed with a protocol that did not include the subtraction technique (n = 4), (2) local treatment such as chemoembolization or radiofrequency ablation was performed (n = 2), and (3) appropriate lesion selection was impossible due to extensive hepatic metastasis (n = 1).
After application of inclusion and exclusion criteria (Figure 1), we obtained a final study population of 15 patients [median age 56 years (range 21–81); 11 males, median age 58 years (range 21–73); four females, median age 61 years (range 39–81)]. In the majority of patients, uveal melanoma was the primary disease site (n = 13). Other primary sites were esophagus (n = 1) and cutaneous lesion at trunk (n = 1).
Six patients had histological evidence of melanoma liver metastasis based on liver biopsy. For the other nine patients who lacked histological evidence, the MRI was reviewed with consensus by two abdominal radiologists (H.K. and S.B., with 4 and 7 years of experience in liver MRI, respectively) to confirm the presence of nodule(s) with bright signal intensity on precontrast T1-weighted images, which is a typical finding for melanoma metastasis [40]. If a patient had multiple liver lesions on MRI, the larger lesions were chosen for analysis by one reviewer (H.K.). However, no more than three lesions were selected from one patient to minimize clustering bias. In total, the study population consisted of 15 patients with 41 metastatic liver lesions.
Eleven patients underwent systemic chemotherapy within the follow-up period with regimens of dacarbazine (n = 7), docetaxel and carboplatin (n = 2), paclitaxel and carboplatin (n = 1), or cisplatin, vinblastine, and dacarbazine (n = 1). Two patients received immunotherapy with dendritic cell vaccination and nivolumab injection, respectively. Two patients were untreated due to poor general condition (Table 1).
MR imaging
MR images were obtained using a 3-T MRI scanner (Magnetom Tim Trio, Siemens Healthcare, Erlangen, Germany; or Achieva, Philips Healthcare, Best, the Netherlands) and a previously published protocol [41]. The following sequences were captured: a breath-hold transverse T1-weighted in- and out-of-phase two-dimensional (2D) gradient-echo (GRE) sequence (TR/in phase TE, 150/2.4 msec; out-of-phase TE, 1.2 msec; flip angle, 65°; FOV, 32– 38 × 25–29 cm; matrix, 256 × 256; section thickness, 6 mm; slice spacing, 1.2 mm; number of slices, 30); a breath-hold transverse 3D GRE (TR/TE, 2.5/0.9 msec; flip angle, 13°; FOV, 32–36 × 25–36 cm; matrix, 320 × 224; section thickness, 2 mm; no gap; acquisition time, 23 sec) with fat suppression technique; and a T2-weighted turbo spin echo (TR/TE, 466/96; FOV, 32–36 × 25–29 cm; matrix, 256 × 192; section thickness, 5 mm; slice spacing, 1 mm). The protocol underwent detailed adjustments according to individual demands whenever necessary.
Dynamic MRI was performed by injecting an intravenous bolus of contrast agent through a 20-gauge intravenous catheter placed into a peripheral vein, followed by a 20-mL saline flush at the rate of 2 mL/ sec. Contrast agents included 0.025 mmol/kg body weight gadoxetic acid (n = 13; Primovist; Bayer Schering Pharma, Berlin, Germany) and 0.1 mmol/kg body weight gadobenic acid (n = 2; Multihance; Bracco Imaging, Milan, Italy). A breath-hold transverse 3D GRE sequence with fat suppression was obtained before and after contrast agent injection. Arterial phase was acquired at 2 or 3 seconds after peak aortic enhancement according to a bolus-tracking method, followed by portal venous, hepatic venous, and transitional phase images with intervals of 30 to 40 seconds each. Hepatobiliary phase images were obtained at 15 to 20 minutes after injection of contrast agent when gadoxetic acid was used. Subtraction images were obtained by automatically subtracting the unenhanced series from arterial and portal venous phase images.
Image analysis
All MRI studies were archived in digital imaging and communications in medicine (DICOM) format on picture archiving and communication system (PACS) workstations (Centricity, GE Healthcare, Waukesha, WI, USA). The initial MR images of the candidates were reviewed by two abdominal radiologists (H.K. and S.B., with 4 and 7 years of experience in liver MRI, respectively) who were aware that melanoma liver metastasis was suspected, but were blinded to all other clinical information. A reviewer (H.K.) measured the longest lesion diameters directly on the PACS. Analyses of other imaging parameters were conducted in two separate sessions. Initially, the two readers independently assessed the MRI images. Subsequently, the results with discrepancies were reassessed based on consensus agreement of the reviewers.
The analyzed imaging parameters included lesion enhancement and T2 signal intensity. The presence or absence of enhancement was evaluated in two steps. (1) First, each reader visually compared routine arterial and/or portal phase images with the precontrast T1-weighted images. At this point, the images reconstructed with the subtraction technique were not provided. (2) Next, the subtraction images obtained by subtracting the precontrast images from the arterial and portal phase images were provided to the reviewers to reassess the enhancement pattern. The T2 signal intensity of each lesion was graded as low SI (lesion appeared darker when compared with the adjacent liver parenchyma), isointense SI (similar brightness of lesion when compared with the adjacent liver parenchyma), or intermediate high SI (lesion appeared mild to moderately brighter when compared with the adjacent liver parenchyma) based on comparison with the SI of liver parenchyma.
Follow-Up imaging and treatment response assessment
The follow-up period ranged from 38 to 86 days (mean ± standard deviation = 55.1 ± 13.3 days). Follow-up imaging studies were based on CT (n = 9) or MRI (n = 6). For follow-up CT examinations, images were obtained with a 64-channel scanner (Sensation 64, Siemens Healthcare, Erlangen, Germany). Patients were intravenously injected by power injector via the antecubital vein at a dose of 1−2 mL/kg nonionic contrast material (Omnipaque 300; GE Healthcare) during 30 seconds. A bolus-tracking technique was employed to obtain the portal venous phase 55 seconds after the Hounsfield unit value of the abdominal aorta had increased by 100 Hounsfield units compared with that of baseline. Imaging parameters were as follows: 0.5 second rotation time; 120 kV; reference mAs, 240 mAs with automated tube current modulation; beam collimation, 0.6 mm; beam pitch, 1; and 3 mm slice thickness. Follow-up MRI examinations were performed with the same imaging parameters as the initial MRI.
The longest diameter of each lesion on follow-up study was measured by an abdominal radiologist (H.K.). The treatment response of each lesion was graded as either progressive or non-progressive. We defined a lesion as progressive if the longest diameter on follow-up imaging increased by at least 20%. All lesions that were not determined as progressive were classified as non-progressive lesions [adopted from [8]].
Statistical analysis
Statistical analysis was performed using SAS version 9.3 (SAS Institute, Cary, NC, USA). During statistical analysis, the T2 SI grades were collapsed into binary values to enhance convenience and clarity of analysis (low SI and isointense SI lesions versus intermediate high SI lesions). The Cohen’s kappa value was calculated for each imaging parameter to estimate interobserver agreement. Interobserver agreement value (κ) was classified as follows: 0−0.20, poor agreement; 0.21−0.40, fair agreement; 0.41−0.60, moderate agreement; 0.61−0.80, good agreement; and 0.81−1.00, excellent agreement. To evaluate the effects of data involving lesions from the same patient, we performed univariable/multivariable analysis by adopting generalized estimating equations to determine the statistical relevance of MRI findings (enhancement on subtraction sequences and T2 signal intensity) for treatment responses. However, T2 SI was omitted in multivariable analysis because multicollinearity existed between enhancement on subtraction images and T2 signal intensity. A result was considered significant for differences with P value < 0.05.
CONFLICTS OF INTEREST
The authors have no potential conflicts of interest.
GRANT SUPPORT
This study received no financial support.
REFERENCES
1. Gray-Schopfer V, Wellbrock C, Marais R. Melanoma biology and new targeted therapy. Nature. 2007; 445:851–857.
2. Hodi FS, O’Day SJ, McDermott DF, Weber RW, Sosman JA, Haanen JB, Gonzalez R, Robert C, Schadendorf D, Hassel JC, Akerley W, van den Eertwegh AJ, Lutzky J, et al. Improved survival with ipilimumab in patients with metastatic melanoma. N Engl J Med. 2010; 363:711–723.
3. Fellner C. Ipilimumab (yervoy) prolongs survival in advanced melanoma: serious side effects and a hefty price tag may limit its use. P T. 2012; 37:503–530.
4. Kath R, Hayungs J, Bornfeld N, Sauerwein W, Hoffken K, Seeber S. Prognosis and treatment of disseminated uveal melanoma. Cancer. 1993; 72:2219–2223.
5. Lorigan JG, Wallace S, Mavligit GM. The prevalence and location of metastases from ocular melanoma: imaging study in 110 patients. AJR Am J Roentgenol. 1991; 157:1279–1281.
6. Vahrmeijer AL, van de Velde CJ, Hartgrink HH, Tollenaar RA. Treatment of melanoma metastases confined to the liver and future perspectives. Dig Surg. 2008; 25:467–472.
7. Lebbe C, Weber JS, Maio M, Neyns B, Harmankaya K, Hamid O, O’Day SJ, Konto C, Cykowski L, McHenry MB, Wolchok JD. Survival follow-up and ipilimumab retreatment of patients with advanced melanoma who received ipilimumab in prior phase II studies. Ann Oncol. 2014; 25:2277–2284.
8. Eisenhauer EA, Therasse P, Bogaerts J, Schwartz LH, Sargent D, Ford R, Dancey J, Arbuck S, Gwyther S, Mooney M, Rubinstein L, Shankar L, Dodd L, et al. New response evaluation criteria in solid tumours: revised RECIST guideline (version 1.1). Eur J Cancer. 2009; 45:228–247.
9. Kwak JJ, Tirumani SH, Van den Abbeele AD, Koo PJ, Jacene HA. Cancer immunotherapy: imaging assessment of novel treatment response patterns and immune-related adverse events. Radiographics. 2015; 35:424–437.
10. Smith AD, Gray MR, del Campo SM, Shlapak D, Ganeshan B, Zhang X, Carson WE, 3rd. Predicting Overall Survival in Patients With Metastatic Melanoma on Antiangiogenic Therapy and RECIST Stable Disease on Initial Posttherapy Images Using CT Texture Analysis. AJR Am J Roentgenol. 2015; 205:W283–293.
11. Sachpekidis C, Larribere L, Pan L, Haberkorn U, Dimitrakopoulou-Strauss A, Hassel JC. Predictive value of early 18F-FDG PET/CT studies for treatment response evaluation to ipilimumab in metastatic melanoma: preliminary results of an ongoing study. Eur J Nucl Med Mol Imaging. 2015; 42:386–396.
12. Mahabeleshwar GH, Byzova TV. Angiogenesis in melanoma. Semin Oncol. 2007; 34:555–565.
13. Streit M, Detmar M. Angiogenesis, lymphangiogenesis, and melanoma metastasis. Oncogene. 2003; 22:3172–3179.
14. Lencioni R, Llovet JM. Modified RECIST (mRECIST) assessment for hepatocellular carcinoma. Semin Liver Dis. 2010; 30:52–60.
15. Edeline J, Boucher E, Rolland Y, Vauleon E, Pracht M, Perrin C, Le Roux C, Raoul JL. Comparison of tumor response by Response Evaluation Criteria in Solid Tumors (RECIST) and modified RECIST in patients treated with sorafenib for hepatocellular carcinoma. Cancer. 2012; 118:147–156.
16. Michielin O, Hoeller C. Gaining momentum: New options and opportunities for the treatment of advanced melanoma. Cancer Treat Rev. 2015; 41:660–670.
17. Nishino M, Jagannathan JP, Krajewski KM, O’Regan K, Hatabu H, Shapiro G, Ramaiya NH. Personalized Tumor Response Assessment in the Era of Molecular Medicine: Cancer-Specific and Therapy-Specific Response Criteria to Complement Pitfalls of RECIST. AJR Am J Roentgenol. 2012; 198:737–745.
18. Michaelis LC, Ratain MJ. Measuring response in a post-RECIST world: from black and white to shades of grey. Nat Rev Cancer. 2006; 6:409–414.
19. Forner A, Ayuso C, Varela M, Rimola J, Hessheimer AJ, de Lope CR, Reig M, Bianchi L, Llovet JM, Bruix J. Evaluation of tumor response after locoregional therapies in hepatocellular carcinoma: are response evaluation criteria in solid tumors reliable? Cancer. 2009; 115:616–623.
20. Siskind BN, Malat J, Hammers L, Rigsby CM, Taylor C, Radin DR, Rosenfield AT. CT features of hemorrhagic malignant liver tumors. J Comput Assist Tomogr. 1987; 11:766–770.
21. Dereure O, Blatiere V, Guillot B. Multiple haemorrhagic-like cutaneous metastasis of malignant melanoma. Eur J Dermatol. 2005; 15:409–410.
22. Byrne TN, Cascino TL, Posner JB. Brain metastasis from melanoma. J Neurooncol. 1983; 1:313–317.
23. Flaherty DC, Hoffner BW, Lau BJ, Hamid O, Faries MB. Hepatic hemorrhage as a consequence of rapid response to combined targeted therapy in metastatic melanoma. J Surg Oncol. 2015; 112:844–5. doi: 10.1002/jso.24078.
24. Jiang X, Asbach P, Willerding G, Dulce M, Xu K, Taupitz M, Hamm B, Erb-Eigner K. Dynamic contrast-enhanced MRI of ocular melanoma. Melanoma Res. 2015; 25:149–156.
25. Servois V, Mariani P, Malhaire C, Petras S, Piperno-Neumann S, Plancher C, Levy-Gabriel C, Lumbroso-le Rouic L, Desjardins L, Salmon RJ. Preoperative staging of liver metastases from uveal melanoma by magnetic resonance imaging (MRI) and fluorodeoxyglucose-positron emission tomography (FDG-PET). Eur J Surg Oncol. 2010; 36:189–194.
26. Woodruff WW Jr, Djang WT, McLendon RE, Heinz ER, Voorhees DR. Intracerebral malignant melanoma: high-field-strength MR imaging. Radiology. 1987; 165:209–213.
27. Hammersmith SM, Terk MR, Jeffrey PB, Connolly SG, Colletti PM. Magnetic resonance imaging of nasopharyngeal and paranasal sinus melanoma. Magn Reson Imaging. 1990; 8:245–253.
28. Isiklar I, Leeds NE, Fuller GN, Kumar AJ. Intracranial metastatic melanoma: correlation between MR imaging characteristics and melanin content. AJR Am J Roentgenol. 1995; 165:1503–1512.
29. Premkumar A, Marincola F, Taubenberger J, Chow C, Venzon D, Schwartzentruber D. Metastatic melanoma: correlation of MRI characteristics and histopathology. J Magn Reson Imaging. 1996; 6:190–194.
30. An C, Park MS, Kim D, Kim YE, Chung WS, Rhee H, Kim MJ, Kim KW. Added value of subtraction imaging in detecting arterial enhancement in small (< 3 cm) hepatic nodules on dynamic contrast-enhanced MRI in patients at high risk of hepatocellular carcinoma. Eur Radiol. 2013; 23:924–930.
31. Winters SD, Jackson S, Armstrong GA, Birchall IW, Lee KH, Low G. Value of subtraction MRI in assessing treatment response following image-guided loco-regional therapies for hepatocellular carcinoma. Clin Radiol. 2012; 67:649–655.
32. Yu JS, Kim YH, Rofsky NM. Dynamic subtraction magnetic resonance imaging of cirrhotic liver: assessment of high signal intensity lesions on nonenhanced T1-weighted images. Comput Assist Tomogr. 2005; 29:51–58.
33. Secil M, Obuz F, Altay C, Gencel O, Igci E, Sagol O, Dicle O. The role of dynamic subtraction MRI in detection of hepatocellular carcinoma. Diagn Interv Radiol. 2008; 14:200–204.
34. Davenport MS, Bashir MR, Pietryga JA, Weber JT, Khalatbari S, Hussain HK. Dose-toxicity relationship of gadoxetate disodium and transient severe respiratory motion artifact. AJR Am J Roentgenol. 2014; 203:796–802.
35. Davenport MS, Viglianti BL, Al-Hawary MM, Caoili EM, Kaza RK, Liu PS, Maturen KE, Chenevert TL, Hussain HK. Comparison of acute transient dyspnea after intravenous administration of gadoxetate disodium and gadobenate dimeglumine: effect on arterial phase image quality. Radiology. 2013; 266:452–461.
36. Mitchell DG, Bruix J, Sherman M, Sirlin CB. LI-RADS (Liver Imaging Reporting and Data System): summary, discussion, and consensus of the LI-RADS Management Working Group and future directions. Hepatology. 2015; 61:1056–1065.
37. Bruix J, Sherman M, American Association for the Study of Liver D. Management of hepatocellular carcinoma: an update. Hepatology. 2011; 53:1020–1022.
38. Curvo-Semedo L, Brito JB, Seco MF, Costa JF, Marques CB, Caseiro-Alves F. The hypointense liver lesion on T2-weighted MR images and what it means. Radiographics. 2010; 30:e38.
39. Bradley WG Jr. MR appearance of hemorrhage in the brain. Radiology. 1993; 189:15–26.
40. Namasivayam S, Martin DR, Saini S. Imaging of liver metastases: MRI. Cancer Imaging. 2007; 7:2–9.
41. Kim H, Park SH, Kim EK, Kim MJ, Park YN, Park HJ, Choi JY. Histogram analysis of gadoxetic acid-enhanced MRI for quantitative hepatic fibrosis measurement. PloS one. 2014; 9:e114224.