
Introduction
Aging is associated with chronic low-grade inflammation and the accumulation of immune cell deposits within tissues. This process, termed “inflammaging”, may contribute to functional and cognitive decline with increased age, and is proposed to be an important target for development of drugs to promote healthy aging and increased healthspan [1]. The Mrp8 (S100a8) and Mrp14 (S100a9) genes encode pro-inflammatory proteins that together form the Mrp8-Mrp14 heterocomplex (calprotectin), which is abundant in myeloid cells as well as damaged or stressed tissues. Mrp8 and Mrp14 mRNAs have been used as in situ inflammation markers [2], but have also been identified as biomarkers of aging in mammalian tissues [3]. In humans, aging leads to increased Mrp8 and Mrp14 mRNA abundance in airway epithelia and throughout the central nervous system (temporal lobe, hippocampus, parietal lobe and frontal lobe) [3]. In mice, elevated Mrp8 and Mrp14 with aging is more widespread, occurring in skin, lung, liver, kidney, aorta, muscle, eye and central nervous system [3]. Increased Mrp8 and Mrp14 expression with age is likely due to immune cell infiltration into aging tissues, but may additionally reflect local responses of cells to age-related stress, damage or senescence [4, 5]. In either case, Mrp8/Mrp14 accumulation may contribute to chronic inflammation [6-9], enhance atherosclerosis and vascular disease [10], promote tumorigenesis [11], and facilitate plaque formation in the brain leading to memory impairment [12-15].
Nearly all functional studies of calprotectin have been performed using young mice [16-23]. The contributions of Mrp8 and Mrp14 to age-related pathology have therefore remained uncertain. Mrp14(-/-) mice lack Mrp14 mRNA but are also deficient for the calprotectin complex due to instability of the Mrp8 protein in the absence of Mrp14 [16, 17]. Under normal physiological conditions, studies of young Mrp14(-/-) mice have frequently failed to identify phenotypes that differ significantly from wild-type controls [16, 17]. Phenotypic differences have emerged, however, following stressful or pro-inflammatory stimuli, such as E. coli-induced sepsis [18], intraperitoneal LPS administration [6], carbon tetrachloride (CCl4) toxicity [19], lung injury [20], and infection [21-23]. In general, inflammatory responses to these treatments are diminished in Mrp14(-/-) mice as compared to wild-type controls. This likely reflects the pro-inflammatory activities of calprotectin, which include the enhancement of cytokine release [7], transendothelial migration of leukocytes [8], toll-like receptor 4 activation [6], and RAGE activation (receptor of advanced glycation end products) [9]. It is unknown whether these effects of Mrp8/Mrp14 also amplify chronic low-grade inflammation in the context of aging. If so, this would suggest new options for treating inflammaging, since efficacious and tolerable drugs have been developed to block Mrp8/14-driven inflammation (i.e., ABR-215757) [24-26].
In this study, we used microarray analysis to characterize hepatic gene expression profiles of wild-type (WT) and Mrp14(-/-) (KO) mice at young (5 months) and old (24 months) ages. We chose liver as a model system to study inflammaging because (i) Mrp8 and Mrp14 mRNAs are robustly elevated in old versus young liver [3], (ii) stress-dependent differences in hepatic inflammation have been identified between WT and KO mice [18, 19], and (iii) hepatic inflammation is a robust feature of aging that has been well-characterized by previous work [27-29]. Our findings reveal unexpected gene expression differences between WT and KO mice at a young age (in the absence of physiological stress), and address the hypothesis that Mrp8 and Mrp14 accumulation promotes age-related inflammation.
Results
Mrp8/Mrp14 deficiency does not prevent inflammaging (liver, lung and skin)
Female WT and KO mice were maintained under pathogen free conditions for 5 or 24 months. Gene expression analysis of multiple organs was performed to assess Mrp8/Mrp14 expression and evidence for tissue inflammation. As expected, Mrp14 expression was significantly reduced in KO liver, lung, ear skin and tail skin (P < 0.05; Fisher’s LSD; Figure 1). Mrp8 expression was also significantly reduced in lung and tail skin from KO mice (P < 0.05; Fisher’s LSD; Figure 1). In WT mice, Mrp8 and Mrp14 expression was always, on average, higher in old mice compared to young mice (Figure 1). These trends were marginally significant with respect to Mrp8 expression in liver (FC = 4.13, P = 0.071), Mrp8 expression in ear skin (FC = 3.32, P = 0.036), Mrp14 expression in liver (FC = 3.64, P = 0.057) and Mrp14 expression in ear skin (FC = 2.15, P = 0.064) (one-tail two-sample t-test).
We evaluated three gene expression markers of inflammation previously shown to be elevated with mouse aging (Cd68, Itgb2 and Lyz1) [30]. We expected expression of these genes to be elevated with aging in WT mice only, but this was not the case (Figure 1). To the contrary, in liver and tail skin, Cd68, Itgb2 and Lyz1 expression was elevated with aging in KO mice only (P < 0.05; Fisher’s LSD; Figure 1A). Inflammation-associated gene expression with aging was therefore not blunted by Mrp8/Mrp14 deficiency but was in fact enhanced in KO compared to WT mice.
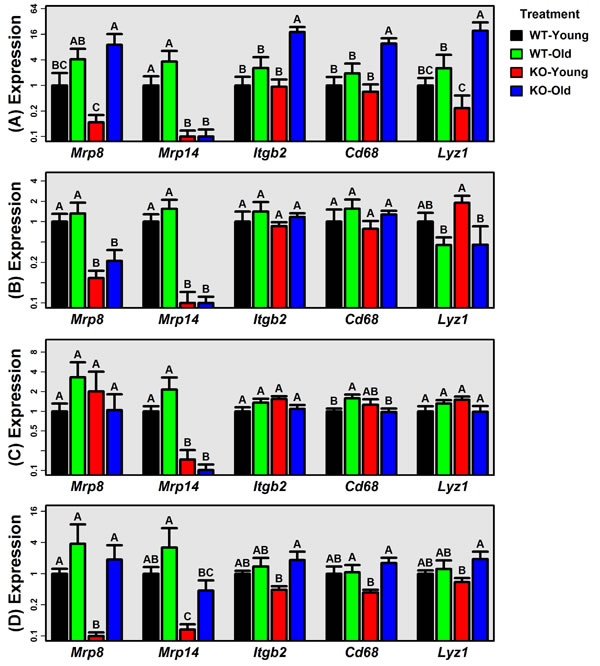
Figure 1: Expression of Mrp8, Mrp14 and genes associated with age-related inflammation (Itgb2, Cd68 and Lyz1). RT-PCR was used to measure expression of Mrp8, Mrp14, Itbg2, Cd68 and Lyz1 in A. liver, B. lung, C. ear skin, and D. tail skin (WT and KO mice; young: 5 months; old: 24 months). Average relative expression is shown for each treatment (± 1 standard error; 5 ≤ n ≤ 9 per treatment), and expression of each gene is normalized to the average expression of the young-WT group. Expression of 18S ribosomal RNA (Rn18s) was used an endogenous control gene. Treatments that do not share the same letter differ significantly from one another (P < 0.05; Fisher’s LSD).
Hepatic gene expression profiles of young KO and WT mice differ under normal physiological conditions
We used Affymetrix Mouse Gene 2.1 ST microarrays to evaluate hepatic gene expression profiles of young WT (n = 5), young KO (n = 5), old WT (n = 6), and old KO (n = 8) mice. Unsupervised cluster analysis of expression profiles yielded partial separation of samples from each group (Figure S1A), which was more evident when samples were plotted with respect to principal components (Figure S1B). Within two-dimensional principal component space, KO and WT samples differed at a young age but then followed a similar aging trajectory, remaining distinct at 24 months of age (Figure S1B). Microarray estimates of Mrp8 and Mrp14 expression revealed expected trends, with increased Mrp14 expression with aging in WT but not KO mice (Figure S1C).
Aging had significant effects on hepatic gene expression that were of similar magnitude in WT and KO mice. We identified 45 differentially expressed genes (DEGs) altered by aging in WT mice (11 age-increased; 34 age-decreased), along with 45 DEGs altered by aging in KO mice (24 age-increased and 21 age-decreased) (FDR < 0.10 with FC > 1.50 or FC < 0.67). We had expected stronger WT vs. KO expression differences at an older age, but this was not supported by differential expression analysis. We identified 215 DEGs from the comparison between young KO and WT mice (136 KO-increased; 79 KO-decreased), but comparison of old KO and WT mice yielded only 6 DEGs (KO increased: Wdfy1, Rps3a1; KO-decreased: Mme, Fam167b, Aadac, Mrp14) (FDR < 0.10 with FC > 1.50 or FC < 0.67). WT and KO genotypes thus showed greater differential expression at a young age. We did not identify genes with significant genotype-by-age interaction effects (FDR < 0.10); however, at a genome-wide level, old/young FCs were only modestly correlated between WT and KO mice (rs = 0.467; Figure S1D). Likewise, there was modest genome-wide correlation of KO/WT FCs between young and old mice (rs = 0.493; Figure S1E).
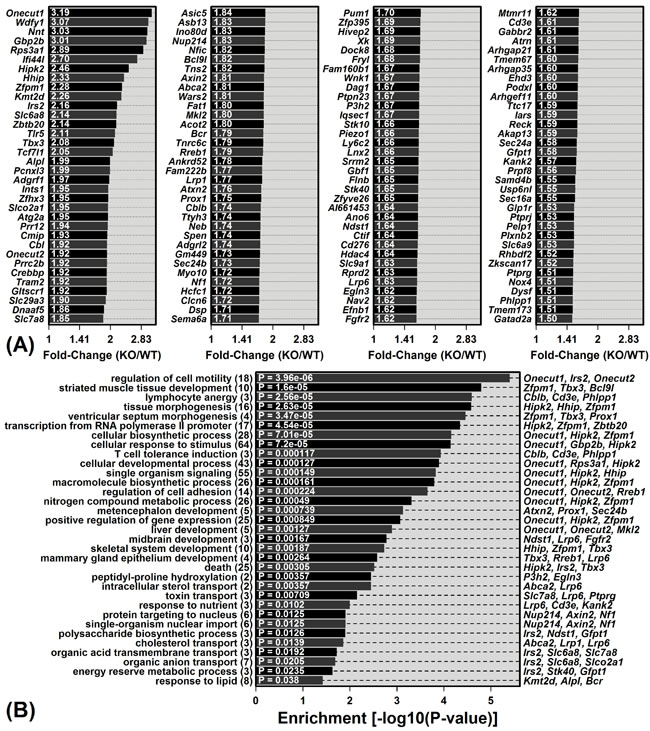
Figure 2: Genes with elevated expression in young KO mice compared to young WT mice and their associated gene ontology (GO) biological process (BP) terms. A. The 136 DEGs with significantly elevated expression in young KO mice compared to young WT mice (FDR < 0.10 with KO/WT FC ≥ 1.50). B. GO BP terms most significantly enriched among the 136 DEGs. The number of DEGs associated with each GO BP term is listed in parentheses (left margin). DEGs most strongly elevated in KO mice are listed for each GO BP term (right margin).
Genes differentially expressed between WT and KO mice are associated with development, biosynthesis, lipid metabolism, and immunity
Mrp8 and Mrp14 are expressed at low levels in livers from young WT mice (Figure S1C). We were therefore surprised to have identified a large number of DEGs (215) from the comparison between young WT and KO mice. Among the 136 DEGs with elevated expression in young KO mice, the most strongly elevated were Onecut1, Wdfy1 and Nnt (Figure 2A). The complete set of 136 KO-increased DEGs showed significant enrichment for diverse gene ontology (GO) biological process (BP) terms, including liver development, cellular biosynthetic process, response to lipid, and lymphocyte anergy (P < 0.05; Figure 2B). Of 79 DEGs with decreased expression in young KO mice, the most strongly decreased included Cyp3a16, Mme and A1bg (Figure 3A). These 79 DEGs were also significantly enriched with respect to diverse GO BP terms, including lipid metabolic process, alpha-beta T-cell activation and immune effector process (P < 0.05; Figure 3B).
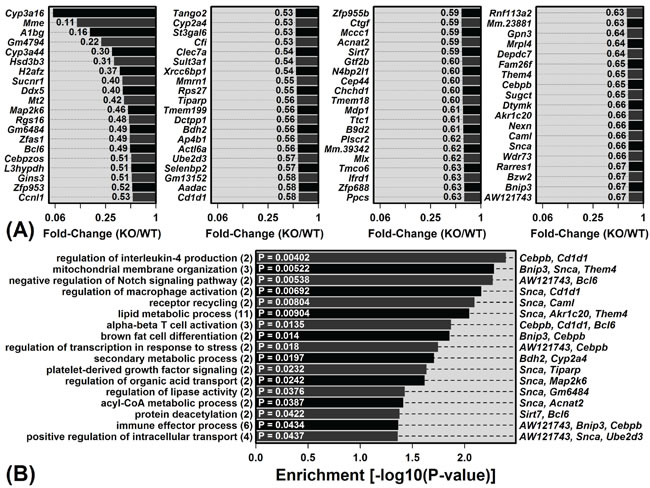
Figure 3: Genes with decreased expression in young KO mice compared to young WT mice and their associated gene ontology (GO) biological process (BP) terms. A. The 79 DEGs with significantly decreased expression in young KO mice compared to young WT mice (FDR < 0.10 with KO/WT FC ≤ 0.67). B. GO BP terms most significantly enriched among the 79 DEGs. The number of DEGs associated with each GO BP term is listed in parentheses (left margin). DEGs most strongly decreased in KO mice are listed for each GO BP term (right margin).
Genes differentially impacted by aging in WT and KO mice are associated with ribosome biogenesis and metabolic processes
Most genes were similarly altered by aging in WT and KO mice (Figure S1D). We did not detect significant genotype-by-age interaction effects after adjustment for multiple comparisons (FDR < 0.10), although we did identify 729 genes with genotype-by-age interaction effects based upon a less conservative comparison-wise significance threshold (P < 0.05). Examples of genes with age-decreased expression in WT mice but age-increased expression in KO mice included Srfbp1, Ccnl1 and Chd1l (Figures S2A, S2C and S2D). Genes following this pattern were enriched with respect to GO BP terms associated with ribosome biogenesis and the metabolism of RNA, linoleic acid, heterocycles, aromatic compounds, organic cyclic compounds, drugs and icosanoids (P < 0.05). Conversely, examples of genes with age-increased expression in WT mice but age-decreased expression in KO mice included Mrps36, Dnlz, and Paqr6 (Figures S2B, S2E and S2F). Genes exhibiting this pattern were significantly enriched with respect to GO BP terms corresponding to long-chain fatty acid metabolism and positive regulation of cell division (P < 0.05).
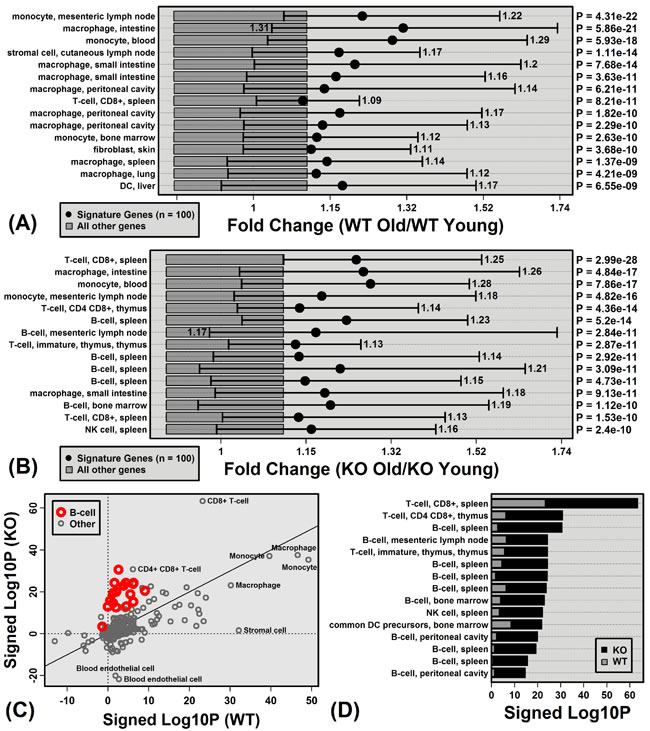
Figure 4: Aging increases hepatic expression of genes specifically expressed by monocytes, macrophages, B-cells and T-cells. Immunological Genome Project (IGP) cell populations with signature genes biased toward age-increased expression in A. WT mice and B. KO mice. Black dots represent the average old/young FC of signature genes, with bars spanning the middle 50% of FC estimates among signature genes (i.e., 25th to 75th percentiles). Dark grey boxes outline the middle 50% of FC estimates among non-signature genes. P-values for each cell population were obtained by comparing FC estimates between signature and non-signature genes (right margin; Wilcoxon rank sum test). Part C. compares p-values obtained from all 222 cell populations for KO and WT mice. P-values were log10-transformed (Log10P) and signed to indicate whether signature genes are biased towards age-decreased expression (Lop10P < 0) or age-increased expression (Log10P > 0). Part D. lists cell populations for which Log10P is higher in KO versus WT mice.
Genes specifically expressed by B-cells and T-cells are more strongly elevated with aging in KO mice as compared to WT mice
Calprotectin is a leukocyte chemoattractant with multiple other pro-inflammatory functions [6-9]. We therefore expected that WT and KO mice would differ with regard to hepatic immune cell composition, particularly following the onset of age-related inflammation. To address this possibility, data from the Immunological Genome Project (IGP) [31] was used to identify 100 “signature genes” specifically expressed by each of 222 immune cell populations (C57BL/6 mice; see Methods). We then assessed whether signature genes for any one cell population were systemically altered in our treatment comparisons [32].
Genes specifically expressed by immune cell populations were biased towards age-increased expression in both WT and KO mice, consistent with age-related hepatic inflammation (Figure 4). In WT mice, monocyte and macrophage signature genes were the most strongly elevated with aging (compared to genes not specifically expressed by these cell types; Figure 4A). In KO mice, monocyte/macrophage signatures genes also showed increased expression with age, although additionally genes specifically expressed by T-cells and B-cells were biased toward age-increased expression (Figure 4B). Among the 222 cell populations, B-cell and T-cell signatures genes were the most differentially altered by aging in KO and WT mice, with genes specifically expressed by these cell types elevated more consistently in KO compared to WT mice (Figure 4C and 4D).
The unique B-cell signature gene pattern was more apparent from the comparison between old KO and old WT mice (Figure 5). Of cell populations with signature genes most strongly biased towards KO-increased expression at an older age, 14 of the top-ranked 15 were B-cell populations (Figure 5A). The trend was strongest for IGP cell population B1a.Sp (P = 3.5 × 10⁻²⁵), which is a spleen-derived B-cell subset characterized by expression of IgD, IgM, CD45R, CD24, CD19 and CD43 (negative for expression of AA4.1, CD23, and CD21/35). Of 100 genes most specifically expressed by this cell population, 92 showed higher expression on average in old KO mice compared to old WT mice (P = 1.38 × 10⁻¹⁷; Fisher’s Exact test; Figure 5B). Among these 100 genes, moreover, the average old/young FC in WT mice was 1.03 (± 0.04), whereas the average old/young FC in KO mice was 1.30 (± 0.08) (P = 1.57 × 10⁻¹⁴; two-sample t-test). Each of the 15 genes most specifically expressed by B1a.Sp was expressed more highly on average in old KO mice compared to old WT mice (e.g., Ms4a1, Bhlhe41, Cd19; Figure 5D and 5E). Consistent with these observations, CD45R (B220) staining intensity was stronger in hepatic tissue from old KO mice as compared to old WT mice (Figure S3).
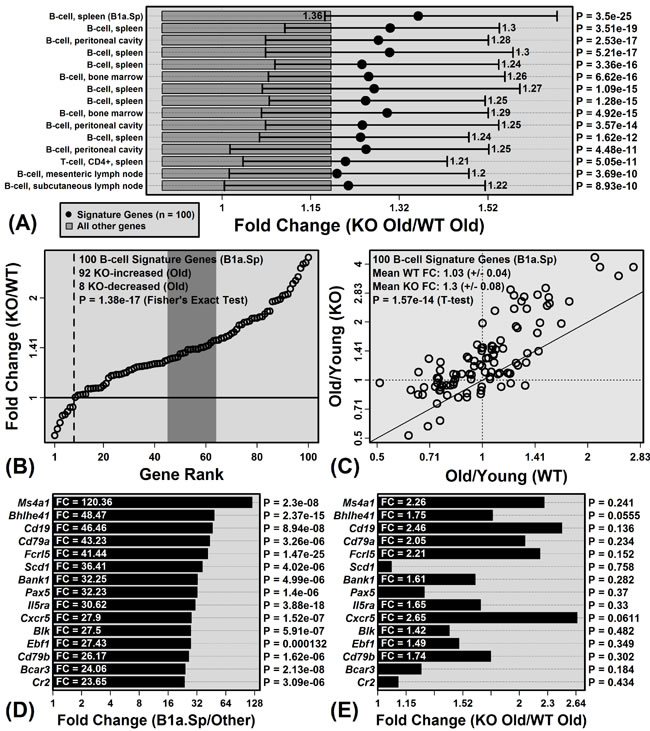
Figure 5: Genes specifically expressed by B-cells have elevated expression in old KO mice compared to old WT mice. A. Immunological genome project (IGP) cell populations with signature genes biased toward elevated expression in old KO mice compared to old WT mice. Black dots represent the average signature gene FC between old KO and old WT mice, with bars spanning the middle 50% of FC estimates among signature genes (i.e., 25th to 75th percentiles). Dark grey boxes outline the middle 50% of FC estimates among non-signature genes. P-values for each cell population were obtained by comparing FC estimates between signature and non-signature genes (right margin; Wilcoxon rank sum test). B. FC estimates (old KO/old WT) for the 100 signature genes associated with the top-ranked B-cell population from part A. (B1a.Sp). The dotted vertical line indicates the number of KO-decreased genes. The dark grey region is the middle 95% of the null distribution for this value (Fisher’s Exact Test). C. Comparison of FC estimates (old/young) between KO and WT mice for the 100 signature genes associated with B1a.Sp. D. Genes most highly expressed by B1a.Sp relative to the other 221 IGP cell populations. The chart shows the FC and p-value obtained from the comparison between B1a.Sp and the 221 other IGP cell populations. E. FC estimates (old KO/old WT) for genes shown in D. and their associated p-values (right margin).
Mrp8/Mrp14 deficiency blunts progression of age-related steatosis
Genes with significantly decreased expression in young KO compared to young WT mice were disproportionately associated with lipid metabolism (e.g., Snca, Akr1c20, Them4; Figure 3B). This prompted us to ask whether development of steatosis with aging is diminished in KO mice [33]. A microarray dataset (GSE46209) [34] was therefore used to identify genes with significantly greater expression in intra-abdominal white adipose tissue (WAT; n = 3) compared to liver (n = 3) (C57BL/6 mice; age 6-8 weeks). A subset of 100 genes with significantly elevated expression in WAT (FDR < 0.10; FC > 1.50) was then analyzed further as WAT signature genes.
The 100 WAT signature genes were disproportionately elevated with aging in WT mice (P = 2.59 × 10⁻²⁰; Figure 6A), consistent with age-related steatosis [33]. WAT-specific genes were also elevated with aging in KO mice, but this trend was weaker compared to WT mice (P = 2.15 × 10⁻⁵; Figure 6B). Of the 15 genes most specifically expressed by WAT, average expression of 14/15 was elevated with aging in WT mice, and fewer (10/15) were similarly elevated in KO mice (Figure 6E and 6F). WAT signature genes were also biased toward decreased expression in old KO mice as compared to old WT mice (P = 1.62 × 10⁻⁵; Figure 6C). Consistent with these findings, histological analyses revealed hepatocellular vacuolation in old WT mice, along with increased frequency of lipid droplets identified by oil red O staining (Figure 7).
These trends suggested that KO mice are partially resistant to age-related steatosis. We thus predicted that hepatic expression differences between old KO and old WT mice would parallel those of treatments that attenuate steatosis. One such treatment is SRT1720, which is a Sirt1 activator previously shown to block steatosis in fasting mice [35]. A microarray dataset (GSE19102) was therefore used to identify 100 genes decreased by SRT1720 in mouse liver [36] (C57BL/6 strain; see Methods). We confirmed that these genes were disproportionately elevated with aging in WT mice (P = 4.95 × 10⁻¹¹; Figure S4A). As predicted, however, the strength of this trend was diminished in KO mice (P = 7.03 × 10⁻³; Figure S4B), and fewer of the most strongly SRT1720-decreased genes were elevated with aging in the KO genotype (Figures S4E and S4F). The 100 SRT1720-decreased genes were also disproportionately reduced in old KO mice compared to old WT mice (P = 0.003; Figure S4D). Gene expression shifts in Mrp8/Mrp14-deficient mice thus paralleled hepatic responses to the anti-steatosis agent SRT1720.
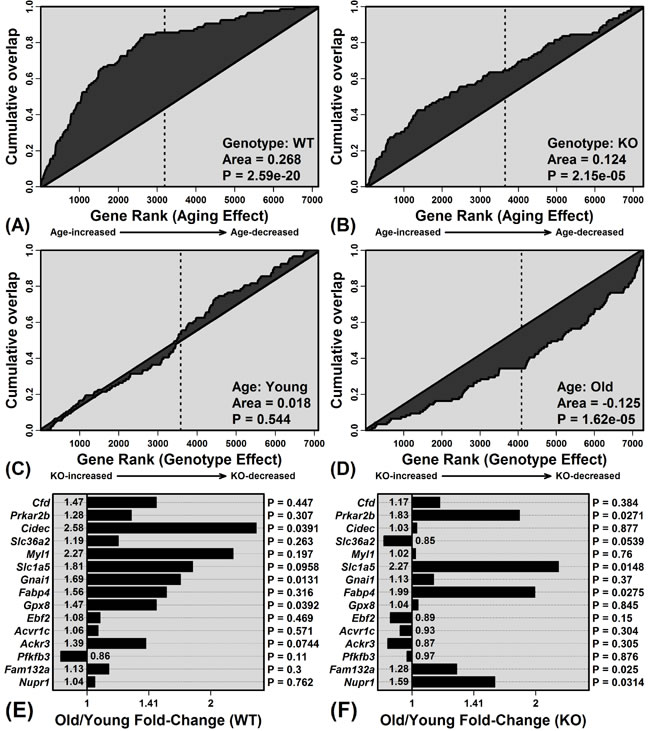
Figure 6: Elevated expression of white adipose tissue (WAT) signature genes with aging is blunted in KO compared to WT mice. Enrichment of WAT signature genes among genes with age-increased expression in A. WT and B. KO mice. Parts A. and B. show cumulative overlap of the 100 WAT signature genes relative to a list of genes ranked according to how strongly their expression is increased by aging (age-increased: left of vertical line; age-decreased: right of vertical line). Significant overlap of WAT signature genes and age-increased genes is indicated by a positive area between the cumulative overlap curve and diagonal. Similarly, C. and D. show cumulative overlap between WAT signature genes and genes ranked according to how strongly their expression is elevated in KO compared to WT mice (C: young mice; D: old mice; KO-increased: left of vertical line; KO-decreased: right of vertical line). Parts E. and F. list WAT signature genes and their FC estimates (old/young) in E. WT and F. KO mice. The 15 WAT signature genes with highest FC (WAT/liver) are listed.
Discussion
Inflammation is a robust feature of aging and may facilitate development of chronic diseases to limit functional capacity [1]. Mrp8 and Mrp14 (calprotectin) have been identified as biomarkers of the aging process [3], but while their pro-inflammatory activity has been documented in young mice under acute stress [16-23], their contributions to chronic inflammation at older ages remains unclear. This study compared Mrp14-KO and WT mice at young and old ages but obtained no evidence that age-related inflammation is blunted by Mrp8/Mrp14 deficiency. Old KO mice in fact showed stronger elevation of B-cell and T-cell-associated gene expression, suggesting that calprotectin may protect against age-related inflammation in WT mice. Unexpectedly, however, KO mice were deficient for expression of lipid metabolism genes at an early age, and subsequently exhibited less progressed steatosis in old age. These findings indicate that, while Mrp8/Mrp14 provide biomarkers of age-related inflammation [2, 3], their activity within aging tissues may not be pro-inflammatory as observed in young mice following acute stress. However, our findings show that Mrp14-KO mice can provide a model system for studies of immune-hepatocyte interactions and their influence on lipid metabolism and steatosis.
Mouse aging frequently leads to increased expression of mRNAs expressed by immune cells that become fixated within non-myeloid tissues during the course of aging [27, 37]. This has frequently been observed in microarray comparisons between young and old mouse tissues, which have revealed elevated expression of immune cell-derived proteins, such as Mrp8 and Mrp14 [29, 30, 37-40]. We hypothesized that elevated Mrp8/Mrp14 expression with aging drives accumulation of immune cells within aging tissues. Surprisingly, however, Mrp14-KO mice did not appear resistant to age-related inflammation, and in contrast, KOs showed stronger elevation of B-cell and T-cell-associated transcripts with liver aging (Figures 4 and 5). It is possible that this result was due to compensatory responses that occur in Mrp14-KO mice, given the absence of functional calprotectin, which enable development of age-associated inflammation via unconventional pathways. Our microarray analysis, however, did not suggest strong compensatory shifts related to inflammatory gene expression, and to the contrary, genes associated with “lymphocyte anergy” were enriched among KO-increased DEGs (Figure 2). Alternatively, our findings may reflect a more complex role of Mrp8/14 at an old age, which is characterized by low-grade chronic (non-acute) inflammation combined with elevated oxidative stress. Such conditions may influence Mrp8/14 function [41, 42]. For instance, Mrp8/14 is recognized as a neutrophil chemoattractant [21], but oxidized forms of human S100A8/A9 repel neutrophils [41, 42]. Consistent with this activity, Mrp14-KO mice exhibited stronger dermal T-cell recruitment following treatment with the oxidative stress agent 7,12-dimethylbenz(a)anthracene (DMBA) [43]. Finally, it is possible that Mrp8/14 is responsive to age-related inflammation, but does not itself serve as a causal trigger. Other events or factors with a leading role, for instance, might include progressive tissue damage or accumulation of auto-antibodies [44].
Most studies have identified Mrp14-KO phenotypes only in the context of acute pro-inflammatory stimuli [16-23], which has fostered the view that KO and WT mice differ little under standard physiological conditions [16, 17]. This conflicts with our observations, however, since we identified 215 genes differentially expressed between livers from KO and WT mice at 5 months of age, in the absence of any stressful or pro-inflammatory conditions (Figures 2 and 3). Most of these genes were not directly associated with immune response, but were associated with “housekeeping” cellular processes, such as cell motility, development, transport and metabolism (Figures 2 and 3). These observations may reflect involvement of Mrp8/14 in processes instrumental for normal liver development. The developmental role of Mrp8, for instance, is established from the fact that Mrp8-KO embryos do not survive gestation and are resorbed, apparently due to maternal rejection [45]. During development, expression of Mrp8/14 is mostly restricted to the myeloid lineage, but expression is detected in liver starting at day 11 of gestation concurrent with myelopoiesis [46]. Potentially, therefore, absence of Mrp14 expression in KO mice influences hepatic development to account for the gene expression phenotype we observed at 5 months of age. Alternatively, Mrp8 and Mrp14 have been associated with intracellular processes that may be important for (post-natal) functioning of hepatocytes or Kupffer cells (e.g., calcium sensing and homeostasis, protein phosphorylation, NADPH oxidase activation, transport, or cytoskeleton regulation) [11, 47, 48]. Either developmental or intracellular functions of Mrp8/14, therefore, may explain hepatic gene expression differences between WT and KO mice at young ages under normal conditions. Such baseline genotype differences may be important to consider in studies that compare acute inflammatory responses of Mrp14-KO and WT mice [18, 19].
Plasma calprotectin has been identified as a marker of obesity and may mediate obesity-associated diseases such as atherosclerosis [10, 49]. Increased obesity with aging is common along with elevated fat to lean mass ratio, partly due to declines in circulating insulin-like growth factors [50]. These effects are frequently associated with accumulation of fat deposits within non-adipose tissues, including the heart, muscle and liver [51]. Within the liver, such fat deposits can be a first step leading to non-alcoholic fatty liver disease (NAFLD), steatohepatitis, cirrhosis, and potentially, hepatocellular carcinoma (HCC) [51]. In our study, Mrp14-KO mice showed resistance to age-related intrahepatic fat accumulation, suggesting a potentially favorable effect of Mrp8/14 deficiency on aging trajectory. This may be related to the intrinsic capacity of calprotectin to bind and transport fatty acids within hepatocytes or associated immune cell populations [52]. Any anergic effect of Mrp14-KO on Kupffer cells, in particular, may influence steatosis, since Kupffer cell depletion was previously shown to attenuate steatosis in rodents [53]. Within aging liver, Kupffer cells or other immune populations may also release pro-steatosis cytokines, such as IL-1β, TNF-α and IL-22 [54, 55], which disrupt bile acid synthesis and cholesterol efflux to promote cholesterol accumulation [55, 56]. Recently, moreover, transgenic mice overexpressing human S100A8/A9 (Mrp8/14) and S100A12 were demonstrated to have elevated lipid content in peritoneal macrophages, potentially due to RAGE-dependent induction of IL-22 expression [55]. Expression of these cytokines (IL-1β, TNF-α, IL-22) may be positively regulated by Mrp8/14 [57, 58]. Attenuation of steatosis in Mrp14-KO mice, therefore, may be explained by several potential mechanisms, including altered lipid binding and metabolism, diminished Kupffer cell activity, or decreased expression of cytokines that control lipid storage and processing.
Activation of inflammatory pathways is closely associated with increasing chronological age, but “healthy aging” in humans seems to involve dampening of these responses [59]. Our findings emphasize the complexity of circuits involved in such pathways, in which archetypal pro-inflammatory proteins such as Mrp8 and Mrp14 can have multiple roles, which include immune response but extend from development to lipid metabolism. Mrp14-KO mice provide a model system for understanding interactions among these systems. In future studies, therefore, it will be valuable to establish whether our observations extend to both sexes, to identify B and T cell subpopulations infiltrating hepatic tissue in old KO mice, and to characterize signals and homing mechanisms that mediate this process. Finally, it is interesting to note that resistance to steatosis has often been linked to interventions with broader impacts on aging, such as SRT1720 [35], resveratrol [60], rapamycin [61], and metformin [62]. Potentially, therefore, further studies of Mrp14-KO mice will uncover age-specific phenotypes beyond those identified in the current study, providing further opportunity to investigate immune-adipose interactions and their connections to development and aging outcomes.
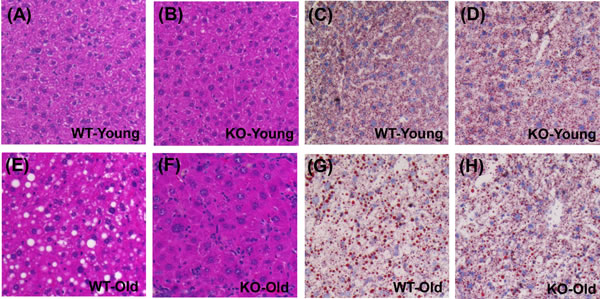
Figure 7: Hepatocellular vacuolation and oil red O staining is attenuated in livers from old KO compared to old WT mice. A., B., E., F. Hematoxylin and eosin H.&E. stain in young and old WT/KO mice. C., D., G., H. Oil red O staining for lipid droplets in young and old WT/KO mice.
materials and Methods
Animal husbandry
Female Mrp14(-/-) (KO) and control (WT) mice with C57BL/6 background were maintained from birth until 5 or 24 months within the Case Western Reserve University (CWRU) animal vivarium. The age of 5 months was chosen to ensure that sexual maturation was complete in mice from the young group [63]. The age of 24 months was chosen because mice older than this age may be experiencing end-stage disease processes, which would itself have physiological effects that could obscure processes related to basic aging mechanisms [63]. Mice were maintained under specific-pathogen free conditions and provided standard rodent chow diet (Prolab® Isopro® RMH 3000 5P76; 22% protein, 5% fat). Mice were fasted 4 hours prior to euthanasia but provided access to water at all times. Sacrifice was performed by cervical dislocation following injection with euthanasia solution (ketamine, 16.5mg/mL; xylazine, 1.65 mg/mL). Both WT and KO mice appeared healthy at 24 months of age without macroscopic evidence of pathology. Tissues were harvested from mice upon sacrifice, flash-frozen in liquid nitrogen, and placed at -80oC until further processing. All protocols were consistent with guidelines issued by the American Association for Accreditation of Laboratory Animal Care and approved by the CWRU Institutional Animal Care and Use Committee (Case Western Reserve University, Cleveland, OH).
Microarray analysis of hepatic gene expression
Genome-wide expression of 24 liver samples was evaluated using Affymetrix Mouse Gene 2.1 ST microarrays (young-WT: n = 5; young-KO: n = 5; old-WT: n = 6; old-KO: n = 8). Raw and normalized data have been deposited in the Gene Expression Omnibus (GEO) database (http://www.ncbi.nlm.nih.gov/geo/query/acc.cgi?token = gvmdcywkthkpbct&acc = GSE79182) [64]. Flash-frozen samples were pulverized and extraction of total RNA was performed using the RNeasy mini kit (Qiagen, cat no. 74104) with on-column DNase digestion (Qiagen, cat. no. 79254). RNA concentrations were measured using a NanoDrop spectrophotometer and RNA integrity was evaluated using the Agilent Bioanalyzer. Microarray processing was carried out with biotinylated cDNA prepared according to the Affymetrix Plus WT kit protocol (GeneChip® WT Plus Reagent Kit Manual P/N 703174 Rev. 2). After labeling, 2.53 µg of cDNA was hybridized at 48oC on Mouse Gene ST 2.1 arrays, which were then washed, stained and scanned using the Affymetrix GeneTitan system (software version 3.2.4.1515).
Quality control (QC) inspection of raw CEL files was performed using NUSE (normalized unscaled standard errors) and RLE (relative log expression) probe-level metrics [65]. Median NUSE and RLE values were consistent across arrays and therefore all 24 samples were retained for further statistical analysis. The robust multichip average algorithm (RMA) was used to perform background subtraction, quantile normalization and expression intensity summarization (R package: oligo; function: rma) [66, 67]. RMA normalization was performed at the gene level using the “target = core” option for the rma function [67] (R package: oligo). This yielded expression intensity estimates for 19513 protein-coding human genes. Genes with below-background expression were excluded from differential expression analyses (see below). A gene was considered to have above-background expression if the expression intensity of at least one associated probe set was significantly above-background (P < 0.05; Wilcoxon signed rank test) [68]. This was evaluated for each probe set based upon comparison of signal intensities between perfect match (PM) and mismatch (MM) probes (R package: oligo; function: paCalls with method = “PSDABG”) [67]. Given this criterion, between 12525 and 15555 genes per sample were identified as having above-background expression (14450 genes on average among the 24 samples).
Differential expression analysis was performed using linear modeling with moderated t-statistics (R package: limma; functions: lmFit and eBayes) [69]. Differentially expressed genes (DEGs) were identified with respect to four comparisons (WT-young vs. KO-young; WT-old vs. KO-old; WT-old vs. WT-young; KO-old vs. KO-young). We also evaluated the significance of genotype × age interaction effects to identify genes for which expression is differentially impacted by aging in WT and KO genotypes [70]. Differential expression analysis was performed only for genes with above-background expression with respect to at least one-third of the samples involved in each comparison. Given this criterion, between 15143 and 15647 genes were included in differential expression analyses for comparisons listed above. Raw p-values were calculated for each included gene and adjusted using the Benjamini-Hochberg method to control the false discovery rate [71]. Unless otherwise stated, DEGs were identified based upon an FDR threshold of 0.10 with estimated FC greater than 1.50 or less than 0.67. A conditional hypergeometric test was used to identify GO BP terms enriched among DEGs relative to a background set of liver-expressed protein-coding genes [72]. Rank-based gene set enrichment analysis (GSEA) was performed by comparing foreground and background gene sets using detection rate curves and the area under the curve (AUC) metric proportional to the Wilcoxon-Mann-Whitney statistic [73].
Immunological genome project (IGP)
Gene expression data from the Immunological Genome Project (IGP) was used to identify “signature genes” specifically expressed by 222 immune cell populations [31, 32]. Raw CEL files associated with the IGP project (Phase I) were downloaded from GEO under accession number GSE15907 (Affymetrix Mouse Gene 1.0 ST Array). The complete dataset included 682 data samples corresponding to 222 different cell populations (i.e., approximately 3 replicates per cell population; male C57BL/6 mice). RMA normalization was performed as described above using the “target = core” option for gene level estimation of expression intensities on the log2 scale [67] (R package: oligo). Differential expression analysis was performed for each cell population by comparing expression between samples for that cell population and all other IGP samples included in the dataset. These calculations were performed using linear modeling with moderated t-statistics as described above (R package: limma; functions: lmFit and eBayes) [69]. These comparisons detected an average of 296 DEGs with significantly elevated expression (FDR < 0.10 with FC > 1.50) among the 222 cell populations (minimum: 2 DEGs; maximum: 1430 DEGs; median: 185 DEGs). However, to equalize cell populations with regard to the number of signature genes analyzed, we considered the 100 genes most highly expressed by each cell population relative to other cell types. For any given cell population, this was done by first selecting genes with elevated expression in that cell type (FC > 1), then selecting the 150 of these genes with lowest p-value, and finally, selecting the 100 of these genes with highest estimated FC. The same number of signature genes (100) was therefore selected for each cell population based upon p-value and FC criteria.
Additional microarray datasets
Adipose and an independent set of liver microarray samples were not included within the IGP dataset for evaluation of gene expression patterns potentially indicative of steatosis. To identify adipose signature genes, therefore, we analyzed a microarray experiment that included samples from intra-abdominal WAT (n = 3) and liver (n = 3) (GSE46209) [34] (Affymetrix Mouse Genome 430 2.0 array; C57BL/6 mice; age 6-8 weeks). Expression intensities were calculated using robust multichip average (RMA) and differential expression between WAT (GSM1126365, GSM1126366, GSM1126367) and liver (GSM1126359, GSM1126360, GSM1126361) samples was evaluated using moderated t-statistics [66, 69]. This comparison yielded 1591 DEGs with significantly elevated expression in WAT compared to normal liver (FDR < 0.10 with FC > 1.50). Of these, we selected 100 as WAT signature genes using the FC/p-value ranking procedure described above for IGP cell populations.
Genes negatively regulated by SRT1720 were identified by comparing gene expression in livers from mice provided high fat diet with SRT1720 (100 mg/kg for 26 weeks) (GSM473339, GSM473340, GSM473341) to livers from mice provided only a high fat diet (GSM473333, GSM473334, GSM473335) (male C57BL/6J mice). Differential expression analysis was performed using moderated t-statistics as described above [69]. This comparison yielded only 12 DEGs with significantly decreased expression in SRT1720-fed mice (FDR < 0.10 with FC < 0.67) although 125 DEGs were identified based on less conservative criteria (FDR < 0.10 with FC < 1.00). Consistent with above analyses, we analyzed a subset of 100 SRT1720-decreased DEGs, by first identifying the 150 SRT1720-decreased DEGs with lowest p-value, and subsequently selecting the 100 of these with lowest FC (SRT1720-treated/control).
Real time quantitative reverse transcription PCR (RT-PCR)
Pre-designed TaqMan® primer assays were purchased from Applied Biosystems (Mrp8, cat. no. Mm00496696_g1; Mrp14, cat. no. Mm00656925_m1; Cd68, cat. no. Mm03047343_m1; Itgb2, cat. no. Mm00434513_m1; Lyz1, cat. no. Mm00657323_m1). RT-PCR reactions were performed using the 7900HT Fast Real-time PCR system with Fast 96-Well Block Module (Applied Biosystems, cat. no. 4351405). Cycle threshold values of target genes from each sample were normalized using 18S ribosomal RNA (Rn18s) as an endogenous control gene (Applied Biosystems, cat. no. Mm04277571_s1). Differential expression analysis and estimation of FC between treatment groups was then performed using the 2-∆∆Ct method [74]. RT-PCR analysis with respect to liver samples yielded fold-change estimates consistent with those generated by microarray analysis (Mrp8, Mrp14, Cd68, Itgb2 and Lyz1).
Immunohistochemistry
Flash frozen hepatic tissue samples were processed for staining with Hematoxylin and Eosin (Anatech LTD, Cat. No. 832 and 842) or Oil Red O (Rowley Biochemical, Cat. No. #H-503-1B). Immunohistochemical stains for CD45R (B220) were performed using a working concentration of 10 µg/mL (Biolegend, Cat. No. 103239).
Acknowledgments
This work was supported in part by NIH K08 grant AR060802 (JEG), NIH RO1 grant AR069071 (JEG and NLW), Doris Duke Charitable Foundation grant 2013106 (JEG), the Babcock Endowment Fund (JEG), the A. Alfred Taubman Medical Research Institute (JEG), the Kenneth and Frances Eisenberg Emerging Scholar Award (JEG), the American Skin Association (WRS), NIH R37 grant HL057506 (DIS), NIH R01 grant HL126645 (DIS), NIH P30 grant AR39750 (NLW), NIH R01 grant AR063437 (NLW), NIH R01 grant AR062546 (NLW) and NIH R21 grant AR063852 (NLW). The content is solely the responsibility of the authors and does not necessarily represent the official views of the National Institutes of Health.
Conflicts of Interest
The authors declare no conflict of interest.
References
1. Franceschi C and Campisi J. Chronic inflammation (inflammaging) and its potential contribution to age-associated diseases. The journals of gerontology Series A, Biological sciences and medical sciences. 2014; 69 Suppl 1:S4-9.
2. Vogl T, Eisenblatter M, Voller T, Zenker S, Hermann S, van Lent P, Faust A, Geyer C, Petersen B, Roebrock K, Schafers M, Bremer C and Roth J. Alarmin S100A8/S100A9 as a biomarker for molecular imaging of local inflammatory activity. Nature communications. 2014; 5:4593.
3. Swindell WR, Johnston A, Xing X, Little A, Robichaud P, Voorhees JJ, Fisher G and Gudjonsson JE. Robust shifts in S100a9 expression with aging: a novel mechanism for chronic inflammation. Scientific reports. 2013; 3:1215.
4. Gomes LH, Raftery MJ, Yan WX, Goyette JD, Thomas PS and Geczy CL. S100A8 and S100A9-oxidant scavengers in inflammation. Free radical biology & medicine. 2013; 58:170-186.
5. Luo Y, Li Y, Lin C, Ma H, Zhang J, Wu S, Wang X, Gao Y, Liu Y and Zheng D. Comparative proteome analysis of splenic lymphocytes in senescence-accelerated mice. Gerontology. 2009; 55:559-569.
6. Vogl T, Tenbrock K, Ludwig S, Leukert N, Ehrhardt C, van Zoelen MA, Nacken W, Foell D, van der Poll T, Sorg C and Roth J. Mrp8 and Mrp14 are endogenous activators of Toll-like receptor 4, promoting lethal, endotoxin-induced shock. Nature medicine. 2007; 13:1042-1049.
7. Gao H, Zhang X, Zheng Y, Peng L, Hou J and Meng H. S100A9-induced release of interleukin (IL)-6 and IL-8 through toll-like receptor 4 (TLR4) in human periodontal ligament cells. Molecular immunology. 2015; 67:223-232.
8. Kerkhoff C, Eue I and Sorg C. The regulatory role of MRP8 (S100A8) and MRP14 (S100A9) in the transendothelial migration of human leukocytes. Pathobiology. 1999; 67:230-232.
9. Gebhardt C, Riehl A, Durchdewald M, Nemeth J, Furstenberger G, Muller-Decker K, Enk A, Arnold B, Bierhaus A, Nawroth PP, Hess J and Angel P. RAGE signaling sustains inflammation and promotes tumor development. The Journal of experimental medicine. 2008; 205:275-285.
10. Schiopu A and Cotoi OS. S100A8 and S100A9: DAMPs at the crossroads between innate immunity, traditional risk factors, and cardiovascular disease. Mediators of inflammation. 2013; 2013:828354.
11. Srikrishna G. S100A8 and S100A9: new insights into their roles in malignancy. Journal of innate immunity. 2012; 4:31-40.
12. Chang KA, Kim HJ and Suh YH. The role of S100a9 in the pathogenesis of Alzheimer’s disease: the therapeutic effects of S100a9 knockdown or knockout. Neuro-degenerative diseases. 2012; 10:27-29.
13. Ha TY, Chang KA, Kim J, Kim HS, Kim S, Chong YH and Suh YH. S100a9 knockdown decreases the memory impairment and the neuropathology in Tg2576 mice, AD animal model. PloS one. 2010; 5:e8840.
14. Wang C, Klechikov AG, Gharibyan AL, Warmlander SK, Jarvet J, Zhao L, Jia X, Narayana VK, Shankar SK, Olofsson A, Brannstrom T, Mu Y, Graslund A, et al. The role of pro-inflammatory S100A9 in Alzheimer’s disease amyloid-neuroinflammatory cascade. Acta neuropathologica. 2014; 127:507-522.
15. Kametani F. Corticosteroid treatment of Alzheimer’s disease: is S100A9/Mrp14 a key target? Neurobiology of aging. 2014; 35:e11-12.
16. Manitz MP, Horst B, Seeliger S, Strey A, Skryabin BV, Gunzer M, Frings W, Schonlau F, Roth J, Sorg C and Nacken W. Loss of S100A9 (MRP14) results in reduced interleukin-8-induced CD11b surface expression, a polarized microfilament system, and diminished responsiveness to chemoattractants in vitro. Molecular and cellular biology. 2003; 23:1034-1043.
17. Hobbs JA, May R, Tanousis K, McNeill E, Mathies M, Gebhardt C, Henderson R, Robinson MJ and Hogg N. Myeloid cell function in MRP-14 (S100A9) null mice. Molecular and cellular biology. 2003; 23:2564-2576.
18. van Zoelen MA, Vogl T, Foell D, Van Veen SQ, van Till JW, Florquin S, Tanck MW, Wittebole X, Laterre PF, Boermeester MA, Roth J and van der Poll T. Expression and role of myeloid-related protein-14 in clinical and experimental sepsis. American journal of respiratory and critical care medicine. 2009; 180:1098-1106.
19. Moles A, Murphy L, Wilson CL, Chakraborty JB, Fox C, Park EJ, Mann J, Oakley F, Howarth R, Brain J, Masson S, Karin M, Seki E, et al. A TLR2/S100A9/CXCL-2 signaling network is necessary for neutrophil recruitment in acute and chronic liver injury in the mouse. Journal of hepatology. 2014; 60:782-791.
20. Kuipers MT, Vogl T, Aslami H, Jongsma G, van den Berg E, Vlaar AP, Roelofs JJ, Juffermans NP, Schultz MJ, van der Poll T, Roth J and Wieland CW. High levels of S100A8/A9 proteins aggravate ventilator-induced lung injury via TLR4 signaling. PloS one. 2013; 8:e68694.
21. Gopal R, Monin L, Torres D, Slight S, Mehra S, McKenna KC, Fallert Junecko BA, Reinhart TA, Kolls J, Baez-Saldana R, Cruz-Lagunas A, Rodriguez-Reyna TS, Kumar NP, et al. S100A8/A9 proteins mediate neutrophilic inflammation and lung pathology during tuberculosis. American journal of respiratory and critical care medicine. 2013; 188:1137-1146.
22. Achouiti A, Vogl T, Urban CF, Rohm M, Hommes TJ, van Zoelen MA, Florquin S, Roth J, van ‘t Veer C, de Vos AF and van der Poll T. Myeloid-related protein-14 contributes to protective immunity in gram-negative pneumonia derived sepsis. PLoS pathogens. 2012; 8:e1002987.
23. Contreras I, Shio MT, Cesaro A, Tessier PA and Olivier M. Impact of neutrophil-secreted myeloid related proteins 8 and 14 (MRP 8/14) on leishmaniasis progression. PLoS neglected tropical diseases. 2013; 7:e2461.
24. Bjork P, Bjork A, Vogl T, Stenstrom M, Liberg D, Olsson A, Roth J, Ivars F and Leanderson T. Identification of human S100A9 as a novel target for treatment of autoimmune disease via binding to quinoline-3-carboxamides. PLoS biology. 2009; 7:e97.
25. Yan L, Bjork P, Butuc R, Gawdzik J, Earley J, Kim G and Hofmann Bowman MA. Beneficial effects of quinoline-3-carboxamide (ABR-215757) on atherosclerotic plaque morphology in S100A12 transgenic ApoE null mice. Atherosclerosis. 2013; 228:69-79.
26. Bengtsson AA, Sturfelt G, Lood C, Ronnblom L, van Vollenhoven RF, Axelsson B, Sparre B, Tuvesson H, Ohman MW and Leanderson T. Pharmacokinetics, tolerability, and preliminary efficacy of paquinimod (ABR-215757), a new quinoline-3-carboxamide derivative: studies in lupus-prone mice and a multicenter, randomized, double-blind, placebo-controlled, repeat-dose, dose-ranging study in patients with systemic lupus erythematosus. Arthritis and rheumatism. 2012; 64:1579-1588.
27. Singh P, Coskun ZZ, Goode C, Dean A, Thompson-Snipes L and Darlington G. Lymphoid neogenesis and immune infiltration in aged liver. Hepatology. 2008; 47:1680-1690.
28. Lee JS, Ward WO, Ren H, Vallanat B, Darlington GJ, Han ES, Laguna JC, DeFord JH, Papaconstantinou J, Selman C and Corton JC. Meta-analysis of gene expression in the mouse liver reveals biomarkers associated with inflammation increased early during aging. Mechanisms of ageing and development. 2012; 133:467-478.
29. White RR, Milholland B, MacRae SL, Lin M, Zheng D and Vijg J. Comprehensive transcriptional landscape of aging mouse liver. BMC genomics. 2015; 16:899.
30. Swindell WR, Johnston A, Sun L, Xing X, Fisher GJ, Bulyk ML, Elder JT and Gudjonsson JE. Meta-profiles of gene expression during aging: limited similarities between mouse and human and an unexpectedly decreased inflammatory signature. PloS one. 2012; 7:e33204.
31. Kim CC and Lanier LL. Beyond the transcriptome: completion of act one of the Immunological Genome Project. Current opinion in immunology. 2013; 25:593-597.
32. Stout MB, Swindell WR, Zhi X, Rohde K, List EO, Berryman DE, Kopchick JJ, Gesing A, Fang Y and Masternak MM. Transcriptome profiling reveals divergent expression shifts in brown and white adipose tissue from long-lived GHRKO mice. Oncotarget. 2015; 6:26702-26715. doi: 10.18632/oncotarget.5760.
33. Kichian K, McLean R, Gramlich LM, Bailey RJ and Bain VG. Nonalcoholic fatty liver disease in patients investigated for elevated liver enzymes. Canadian journal of gastroenterology. 2003; 17:38-42.
34. Yeung F, Ramirez CM, Mateos-Gomez PA, Pinzaru A, Ceccarini G, Kabir S, Fernandez-Hernando C and Sfeir A. Nontelomeric role for Rap1 in regulating metabolism and protecting against obesity. Cell reports. 2013; 3:1847-1856.
35. Li Y, Wong K, Giles A, Jiang J, Lee JW, Adams AC, Kharitonenkov A, Yang Q, Gao B, Guarente L and Zang M. Hepatic SIRT1 attenuates hepatic steatosis and controls energy balance in mice by inducing fibroblast growth factor 21. Gastroenterology. 2014; 146:539-549.e537.
36. Minor RK, Baur JA, Gomes AP, Ward TM, Csiszar A, Mercken EM, Abdelmohsen K, Shin YK, Canto C, Scheibye-Knudsen M, Krawczyk M, Irusta PM, Martin-Montalvo A, et al. SRT1720 improves survival and healthspan of obese mice. Scientific reports. 2011; 1:70.
37. Swindell WR. Genes and gene expression modules associated with caloric restriction and aging in the laboratory mouse. BMC genomics. 2009; 10:585.
38. de Magalhaes JP, Curado J and Church GM. Meta-analysis of age-related gene expression profiles identifies common signatures of aging. Bioinformatics. 2009; 25:875-881.
39. Gao L, Hidalgo-Figueroa M, Escudero LM, Diaz-Martin J, Lopez-Barneo J and Pascual A. Age-mediated transcriptomic changes in adult mouse substantia nigra. PloS one. 2013; 8:e62456.
40. Steegenga WT, de Wit NJ, Boekschoten MV, Ijssennagger N, Lute C, Keshtkar S, Bromhaar MM, Kampman E, de Groot LC and Muller M. Structural, functional and molecular analysis of the effects of aging in the small intestine and colon of C57BL/6J mice. BMC medical genomics. 2012; 5:38.
41. Sroussi HY, Berline J, Dazin P, Green P and Palefsky JM. S100A8 triggers oxidation-sensitive repulsion of neutrophils. Journal of dental research. 2006; 85:829-833.
42. Sroussi HY, Berline J and Palefsky JM. Oxidation of methionine 63 and 83 regulates the effect of S100A9 on the migration of neutrophils in vitro. Journal of leukocyte biology. 2007; 81:818-824.
43. McNeill E and Hogg N. S100A9 has a protective role in inflammation-induced skin carcinogenesis. International journal of cancer. 2014; 135:798-808.
44. Lustig A, Carter A, Bertak D, Enika D, Vandanmagsar B, Wood W, Becker KG, Weeraratna AT and Taub DD. Transcriptome analysis of murine thymocytes reveals age-associated changes in thymic gene expression. International journal of medical sciences. 2009; 6:51-64.
45. Passey RJ, Williams E, Lichanska AM, Wells C, Hu S, Geczy CL, Little MH and Hume DA. A null mutation in the inflammation-associated S100 protein S100A8 causes early resorption of the mouse embryo. Journal of immunology. 1999; 163:2209-2216.
46. Lagasse E and Weissman IL. Mouse MRP8 and MRP14, two intracellular calcium-binding proteins associated with the development of the myeloid lineage. Blood. 1992; 79:1907-1915.
47. Donato R. S100: a multigenic family of calcium-modulated proteins of the EF-hand type with intracellular and extracellular functional roles. The international journal of biochemistry & cell biology. 2001; 33:637-668.
48. Donato R, Cannon BR, Sorci G, Riuzzi F, Hsu K, Weber DJ and Geczy CL. Functions of S100 proteins. Current molecular medicine. 2013; 13:24-57.
49. Mortensen OH, Nielsen AR, Erikstrup C, Plomgaard P, Fischer CP, Krogh-Madsen R, Lindegaard B, Petersen AM, Taudorf S and Pedersen BK. Calprotectin—a novel marker of obesity. PloS one. 2009; 4:e7419.
50. Bann D, Holly JM, Lashen H, Hardy R, Adams J, Kuh D, Ong KK and Ben-Shlomo Y. Changes in insulin-like growth factor-I and -II associated with fat but not lean mass in early old age. Obesity. 2015; 23:692-698.
51. Sheedfar F, Di Biase S, Koonen D and Vinciguerra M. Liver diseases and aging: friends or foes? Aging cell. 2013; 12:950-954.
52. Siegenthaler G, Roulin K, Chatellard-Gruaz D, Hotz R, Saurat JH, Hellman U and Hagens G. A heterocomplex formed by the calcium-binding proteins MRP8 (S100A8) and MRP14 (S100A9) binds unsaturated fatty acids with high affinity. The Journal of biological chemistry. 1997; 272:9371-9377.
53. Song M, Schuschke DA, Zhou Z, Zhong W, Zhang J, Zhang X, Wang Y and McClain CJ. Kupffer cell depletion protects against the steatosis, but not the liver damage, induced by marginal-copper, high-fructose diet in male rats. American journal of physiology Gastrointestinal and liver physiology. 2015; 308:G934-945.
54. Ma KL, Ruan XZ, Powis SH, Chen Y, Moorhead JF and Varghese Z. Inflammatory stress exacerbates lipid accumulation in hepatic cells and fatty livers of apolipoprotein E knockout mice. Hepatology. 2008; 48:770-781.
55. Chellan B, Yan L, Sontag TJ, Reardon CA and Hofmann Bowman MA. IL-22 is induced by S100/calgranulin and impairs cholesterol efflux in macrophages by downregulating ABCG1. Journal of lipid research. 2014; 55:443-454.
56. Chen Y, Chen Y, Zhao L, Chen Y, Mei M, Li Q, Huang A, Varghese Z, Moorhead JF and Ruan XZ. Inflammatory stress exacerbates hepatic cholesterol accumulation via disrupting cellular cholesterol export. Journal of gastroenterology and hepatology. 2012; 27:974-984.
57. Koy M, Hambruch N, Hussen J, Pfarrer C, Seyfert HM and Schuberth HJ. Recombinant bovine S100A8 and A9 enhance IL-1beta secretion of interferon-gamma primed monocytes. Veterinary immunology and immunopathology. 2013; 155:162-170.
58. de Carvalho GC, Domingues R, Almeida de Sousa Nogueira M, Calvielli Castelo Branco AC, Gomes Manfrere KC, Vieira Pereira N, Aoki V, Nacagami Sotto M, Da Silva Duarte AJ and Notomi Sato M. Up-regulation of Proinflammatory Genes and Cytokines Induced by S100A8 in CD8+ T Cells in Lichen Planus. Acta dermato-venereologica. 2016; 96:485-9. doi: 10.2340/00015555-2306.
59. Arai Y, Martin-Ruiz CM, Takayama M, Abe Y, Takebayashi T, Koyasu S, Suematsu M, Hirose N and von Zglinicki T. Inflammation, But Not Telomere Length, Predicts Successful Ageing at Extreme Old Age: A Longitudinal Study of Semi-supercentenarians. EBioMedicine. 2015; 2:1549-1558.
60. Faghihzadeh F, Hekmatdoost A and Adibi P. Resveratrol and liver: A systematic review. Journal of research in medical sciences. 2015; 20:797-810.
61. Wang C, Yan Y, Hu L, Zhao L, Yang P, Moorhead JF, Varghese Z, Chen Y and Ruan XZ. Rapamycin-mediated CD36 translational suppression contributes to alleviation of hepatic steatosis. Biochemical and biophysical research communications. 2014; 447:57-63.
62. Woo SL, Xu H, Li H, Zhao Y, Hu X, Zhao J, Guo X, Guo T, Botchlett R, Qi T, Pei Y, Zheng J, Xu Y, et al. Metformin ameliorates hepatic steatosis and inflammation without altering adipose phenotype in diet-induced obesity. PloS one. 2014; 9:e91111.
63. Miller RA and Nadon NL. Principles of animal use for gerontological research. The journals of gerontology Series A, Biological sciences and medical sciences. 2000; 55:B117-123.
64. Barrett T, Wilhite SE, Ledoux P, Evangelista C, Kim IF, Tomashevsky M, Marshall KA, Phillippy KH, Sherman PM, Holko M, Yefanov A, Lee H, Zhang N, et al. NCBI GEO: archive for functional genomics data sets—update. Nucleic acids research. 2013; 41:D991-995.
65. Bolstad BM, Collin F, Brettschneider J, Simpson K, Cope L, Irizarry RA and Speed TP. (2005). Quality assessment of Affymetrix GeneChip Data. In: Gentleman R, Carey V, Huber W, Irizarry RA and Dudoit S, eds. Bioinformatics and Computational Biology Solutions using R and Bioconductor. (New York, NY: Springer).
66. Irizarry RA, Bolstad BM, Collin F, Cope LM, Hobbs B and Speed TP. Summaries of Affymetrix GeneChip probe level data. Nucleic acids research. 2003; 31:e15.
67. Carvalho BS and Irizarry RA. A framework for oligonucleotide microarray preprocessing. Bioinformatics. 2010; 26:2363-2367.
68. Liu WM, Mei R, Di X, Ryder TB, Hubbell E, Dee S, Webster TA, Harrington CA, Ho MH, Baid J and Smeekens SP. Analysis of high density expression microarrays with signed-rank call algorithms. Bioinformatics. 2002; 18:1593-1599.
69. Smyth GK. Linear models and empirical bayes methods for assessing differential expression in microarray experiments. Statistical applications in genetics and molecular biology. 2004; 3:Article3.
70. Swindell WR. Genotype-by-age interaction and identification of longevity-associated genes from microarray data. Age (Dordrecht, Netherlands). 2007; 29:97-102.
71. Benjamini Y and Hochberg Y. Controlling the false discovery rate: a powerful and practical approach to multiple testing. J Roy Stat Soc B. 1995; 57:289-300.
72. Falcon S and Gentleman R. Using GOstats to test gene lists for GO term association. Bioinformatics. 2007; 23:257-258.
73. Philippakis AA, Busser BW, Gisselbrecht SS, He FS, Estrada B, Michelson AM and Bulyk ML. Expression-guided in silico evaluation of candidate cis regulatory codes for Drosophila muscle founder cells. PLoS computational biology. 2006; 2:e53.
74. Livak KJ and Schmittgen TD. Analysis of relative gene expression data using real-time quantitative PCR and the 2(-Delta Delta C(T)) Method. Methods. 2001; 25:402-408.