
INTRODUCTION
Multiple myeloma (MM) is a malignant disorder of bone marrow plasma cells, which typically produce large amounts of abnormal immunoglobulins during the course of the disease. The clinical manifestation of MM covers a broad spectrum ranging from asymptomatic to the mortality due to bone fractures, renal failure, and infectious complications [1]. Accumulating clinical and pathological evidence has led to improvements in the diagnosis of MM, and recently the International Myeloma Working Group updated its diagnosis criteria [2]. With regard to the types of abnormal immunoglobulin produced by malignant plasma cells in MM, IgG accounts for about half of the cases, followed by IgA (~20%). Multiple myeloma producing IgM (IgM MM) is a very rare (0.1-0.5%) and aggressive disease [3].
IgM MM must be distinguished from other IgM-producing plasma cell disorders, particularly Waldenström’s macroglobulinemia (WM) as the two diseases have different treatment options [4]. Recent advancements in the molecular techniques revealed genomic characteristics of MM and WM [5, 6], and the unique genetic alterations found in WM enabled otherwise challenging differential diagnoses between the two diseases [7, 8]. However, the genomic characteristics of IgM MM have been partially defined by low throughput molecular studies, and comprehensive genomic profiling has been lacking. In this study, we investigated genomic characteristics of IgM MM by analyzing whole exome and whole transcriptome sequencing data for two IgM MM cases in relation to other types of MM. Whole exome sequencing (WES) identified recurrent DNA aberrations in DIS3 and MYO10 for IgM MM, which were found in other MM cases at low frequencies. The transcriptome profiling also allowed classification of IgM MM as an MM subgroup, and identified IRF4 as a prognostic marker shared by IgM-type and other types of MM with aggressive disease progression.
RESULTS
Somatic mutation profiles of IgM MM
We performed whole exome sequencing (WES) for CD138+ enriched bone marrow cells from two IgM MM patients and 10 other types of MM (Supplementary Table 2). The average sequencing depth for WES was 130.0X (± 18.23). Sequencing reads covered whole exome regions with at least 98.5% (over 10X). Recurrent somatic single nucleotide variations (SNVs) in 12 MM patients including two IgM MM patients were identified from our study (Figure 1). In particular, SNVs in DIS3 and MYO10, reported at frequencies of 10% and 2% in MM [9], were found in both IgM MM patients. The DIS3 gene had missense mutations at the same amino acid residue (R780) with different base substitutions. Two mutations, K1767M and Y1668C in MYO10, were located between the Myosin Tail Homology 4 (MyTH4) domain and the FERM central domain. Other interesting mutations occurred in CCND1 (S55Y, in the first exon) for IgM08 and KRAS (G12V) for IgM13. CCND1 mutations in the first exon and the accompanying chromosomal translocation t(11;14) may indicate ongoing somatic hypermutation driven by activation-induced cytidine deaminase (AID) protein [9, 10]. The KRAS G12V mutation is known as a driver mutation of MMs as well as other cancers. Notably, the MYD88 L265P mutation, associated with Waldenström’s macroglobulinemia, was detected in none of the MM samples. We performed Sanger sequencing for the three genes (DIS3, MYO10, and MYD88) and verified WES results (Supplementary Figure S1).
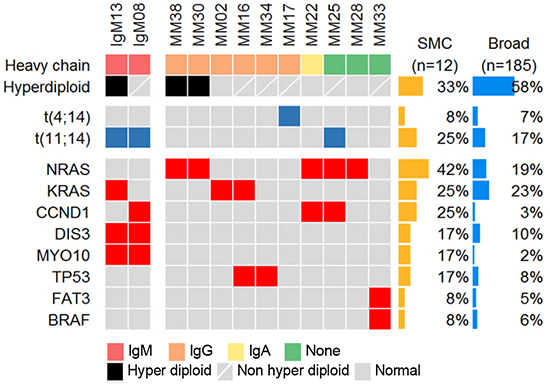
Figure 1: Mutational landscape of multiple myelomas (MMs), including the detected mutations from IgM MM patients. Heat map describing the recurrent somatic alterations in MM. The mutation frequency is obtained from our sequencing data (SMC) and Broad [9], (which was downloaded from cBioPortal).
Chromosomal abnormalities in IgM MM
According to previous studies, approximately 14% of whole MM samples harbor the chromosomal translocation t(11;14) [11], whereas 7 out of 8 IgM MM showed t(11;14) in cytogenetic analyses [12]. The two IgM MM samples in the current study also harbored t(11;14) as analyzed by fluorescence in situ hybridization (FISH), supporting the high incidence of t(11;14) in IgM MM (Figure 1). In addition, copy number variation (CNV) analysis indicated trisomy of chromosomes 1q, 3, 6, and 11 as well as focal amplification of 14q32.33 in the hyperdiploid IgM MM (Figure 2). The overall pattern of CNV in the IgM MM samples was similar to the previously observed pattern in other MMs.
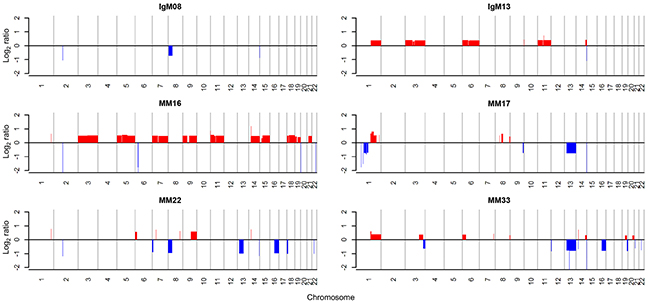
Figure 2: Copy number alterations of MM patients. Red and blue colors indicate amplification and deletion, respectively
Comparison of gene expression profiles to other types of MMs
RNA sequencing was performed on 21 MM samples including the twelve with WES analysis. Across all RNA-Seq data, 45.85 ± 1.05% of total reads were uniquely aligned to the human genome reference. The transcriptome analysis focused on the similarities and differences of gene expression patterns between IgM and the other types of MM. The expression pattern of IgM and other types of MM is markedly different from normal control cells (Figure 3a). IgM MM samples clustered with the group of MM samples, suggesting its inclusion in the MM subgroup. When we clustered them with 618 differentially expressed genes (DEGs) between IgM MM and normal control cells, most of the MM samples showed a similar expression pattern. Nevertheless, IgM MM could be grouped separately from the other MM types, showing subtle differences in gene expression (Figure 3b and Supplementary Table 3). Compared to the normal control cells, underexpressed genes were more prevalent than overexpressed genes, especially those related to major histocompatibility complex (MHC) class II and B-cell activation or differentiation (Supplementary Table 3). Overexpressed genes belonged to endoplasmic reticulum (ER) or mitochondrial components, which are elevated in MM in general [13]. A recent report suggested that MMs have distinct methylation and gene expression status for the B-cell-specific transcription factors (TFs) [14]. Interestingly, interferon regulatory factor 4 (IRF4), an indispensable transcription factor for plasma cell differentiation, was overexpressed in both IgM MM samples (Figure 3c). IRF4 is also known to be a survival factor for MM cells and correlates with the aggressive disease status [15, 16]. In our dataset, IRF4 also showed high expression levels in the most aggressive MMs as well as in the IgM MMs (Figure 3d and Supplementary Figure S2). The high-expression group showed shorter progression-free time (p =0.020) compared to the low-expression group. When we took other clinical parameters such as age, International Staging System (ISS) Stage, levels of lactate dehydrogenase, and high risk factors (HR; t(4;14) and 17p deletion [17]) into account, the high risk group showed poorer outcome (p = 0.05, Supplementary Figure S4), suggesting that IRF4 is an independent prognostic factor. We used independent public datasets to evaluate the prognostic significance of IRF4 expression and found a positive correlation (Supplementary Figure S3). The tumorigenesis mechanisms involving IRF4 are currently unclear, but its association in MM development and disease progression warrants further investigation.
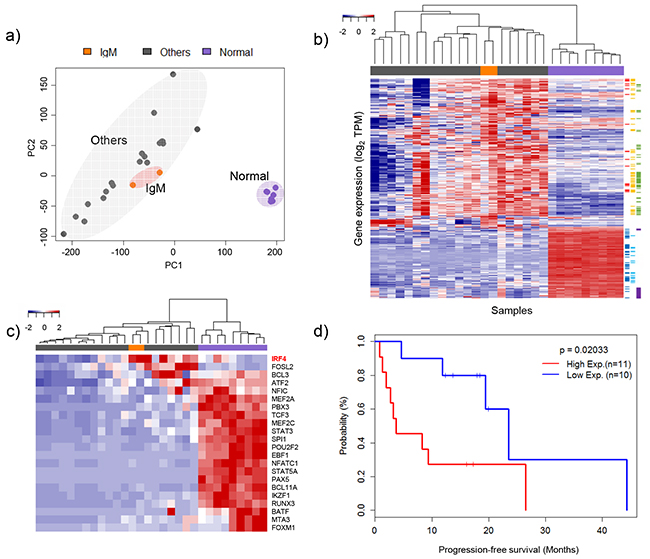
Figure 3: Clustering of gene expression profiles and heat map for specific gene sets. a. Principle component analysis of gene expression levels. Three distinct groups were plotted in two-dimensional space: IgM types, other types (IgG, IgA, and no heavy chain) and normal samples. b. Clustering of differentially expressed genes. Red, black, and blue groups indicate IgM types, other types and normal samples, respectively. Sidebar is color coded by molecular function using David (https://david.ncifcrf.gov): red = oxidative phosphorylation, yellow = organelle membrane, green = ER related genes, blue = immune response, sky-blue = leukocyte activation and purple = immunoglobulins. c. Heat map of the expression profiles of genes associated with B-cell-specific transcription factors (TFs) [14]. d. Clinical outcomes of multiple myeloma (MM) patients according to IRF4 expression level.
DISCUSSION
In this study, we performed comprehensive genomic profiling of IgM MM, which is an aggressive MM subtype with a low incidence rate of < 0.5% [18, 19]. Our results show that features of the IgM type were similar to the known genomic characteristics of MMs.
Several genes recurrently mutated in MM, such as KRAS, NRAS, FAM46C, DIS3, TP53, and BRAF, have been reported [9, 20]. Among those, mutation of DIS3 at position R780 was detected in both IgM MM samples. The DIS3 protein is an RNA exosome subunit containing exonucleolytic (RNB) and endonucleolytic (PIN) domains, and participates in the regulation of mRNA and small RNA processing [21–23]. The R780 substitution mutation in the RNB domain eliminates the exonucleolytic activity of DIS3 [24, 25], and thus may cause perturbations in cellular RNA metabolism and gene expression. Recently, Robinson et al. [26] suggested additional effects of DIS3 mutation in MM, i.e., defects in spindle assembly checkpoint and/or aberrant hypermutation and antibody class switching. These defects may cause genetic instability and aneuploidy, which are frequently found in multiple myeloma. As our IgM MM cases include one with aneuploidy (hyperdiploidy) and one with normal cytogenetics, the oncogenic effect of DIS3 mutation may be exerted by multiple mechanisms.
In the transcriptional study, we found that IRF4, an interferon regulatory factor and B-cell specific transcription factor, is a prognostic factor in multiple myeloma independent of patient age, ISS disease stage, levels of lactate dehydrogenase, and high risk factors. Previously, IRF4 positivity in immunohistochemical staining had a significant correlation with increased disease stage in multiple myeloma [15], and its silencing caused cell death in myeloma cell lines [16]. Through gene expression profiling and chromatin immunoprecipitation analysis [16], the Myc oncogene was demonstrated as a direct target of IRF4, and IRF4 was proposed as a master regulator of malignancy-specific gene expression in multiple myeloma.
Several cytogenetic abnormalities have been proposed as poor prognostic factors in multiple myeloma, such as the chromosome translocations t(4;14) and t(14;16), non-hyperdiploidy, 1q gains and 17p deletions [27]. In addition, gene expression signatures from 70 prognostic genes are being developed to predict the risk of relapse for MM patients [28]. By comparison, only a few genetic aberrations at the single gene level, such as DIS3 mutation [29] and IRF4 overexpression [15] were proposed as a poor prognostic factor. As we identified DIS3 mutation and IRF4 overexpression in IgM MM, these aberrations may contribute to the aggressive disease phenotype in this rare MM subtype.
MATERIALS AND METHODS
Patients and sample preparation
This study was approved by the institutional review board (IRB) of Samsung Medical Center (IRB approval no. SMC2013-09-009-012) and carried out in accordance with the principles of the Declaration of Helsinki. The study subjects were 21 Korean patients diagnosed with multiple myeloma including two with IgM MM at Samsung Medical Center, Seoul, Korea (Supplementary Table S1). Bone marrow aspirates after initial diagnosis were subjected to Ficoll-Paque PLUS (GE Healthcare, USA) gradient and magnetic separation with anti-CD138 antibody microbeads (Miltenyi Biotech, Germany). From the CD138-enriched bone marrow cells, genomic DNA and RNA was purified using the ALLPrep kit (Qiagen, USA). Matching blood DNA was isolated by the QIAamp DNA blood kit (Qiagen). RNAs from 21 patients were subjected to RNA sequencing whereas only 12 DNA samples were subjected to whole exome sequencing. Normal control RNA was collected from CD19+ blood B cells from four healthy volunteers and CD138+ tonsil plasma cells from five tonsilectomy tissues.
Whole exome sequencing and data analysis
Genomic DNA (1 μg) from the bone marrow and matching blood samples was sheared by Covaris S220 (Covaris, MA, USA) and used for library construction with SureSelect XT Human All Exon v5 and SureSelect XT reagent kit, HSQ (Agilent Technologies, Santa Clara, CA, USA) according to manufacturer’s protocols. After multiplexing, the libraries were sequenced on the HiSeq 2500 sequencing platform (Illumina, USA), using the 100 bp paired-end mode of the TruSeq Rapid PE Cluster kit and TruSeq Rapid SBS kit (Illumina).
Sequencing reads were aligned to the UCSC hg19 reference genome (downloaded from http://genome.ucsc.edu) using Burrows-Wheeler Aligner (BWA) [30], version0.6.2 with default settings. PCR duplications are marked by Picard-tools-1.8 (http://picard.sourceforge.net/), data cleanup was followed by GATK, and variants were identified with GATK-2.2.9 (https://www.broadinstitute.org/gatk/). Then, point mutations were identified by MuTect (https://github.com/broadinstitute/mutect) and VarScan 2 (http://varscan.sourceforge.net) with paired samples. Perl script and ANNOVAR [31] were used to annotate variants.
RNA sequencing and data analysis
The library construction for whole transcriptome sequencing was performed using the TruSeq RNA sample preparation v2 kit (Illumina). Sequencing of the transcriptome library was carried out using the 100 bp paired-end mode of the TruSeq Rapid PE Cluster kit and TruSeq Rapid SBS kit (Illumina).
The reads from the FASTQ files were mapped against the GRCh37.75 human reference genome by using STAR (https://github.com/alexdobin/STAR/releases) version 2.4.0. The output files in BAM format were analyzed by RSEM (http://deweylab.biostat.wisc.edu/rsem/) version 1.2.18 to quantify the transcript abundance in transcripts per million (TPM). Coding genes were selected (20,652) and low-expression genes were filtered out by applying the criteria that the total TPM should be > 20.42 (mean TPM value) across all samples. Clustering was performed by Principal Component Analysis (PCA). We identified differentially expressed genes (DEGs) and performed gene ontology (GO) analysis using the ‘DESeq’ [32] which is Bioconductor package (http://bioconductor.org) in R and ‘DAVID’ [33]. We used two GEO datasets to evaluate the prognostic significance of IRF4 expression (GSE9782 [34], GSE24080 [35]).
Validation of SNVs by Sanger sequencing
Regions flanking the mutation sites of DIS3 and MYO10 were amplified from genomic DNA and subjected to Sanger sequencing. The primer sequences are DIS3 forward: 5′-TTAGCCACTCGCTGTATGATG-3′; DIS3 reverse: 5′-G ATGCACGTTGGGCATATTG-3′; DIS3 sequencing: 5′-GC TTGTGTTTGTCTGTCAACTC-3′; MYO10(5003) forward: 5′-CAGCAAAGGCATCTAACAGAAC-3′; MYO10(5003) reverse: 5′-AGTGAGACATTGGCTCTTTAGG-3′; MYO10 (5003) sequencing: 5′-GTGGGAGTTGATGGTGATCTT-3′; MYO10(5300) forward: 5′-TCACGTAAGACCGTAGCT TTATC-3′; MYO10(5300) reverse: 5′-GATGACCACAC GGGTAACAT-3′; MYO10(5300) sequencing: 5′-ACAG GCATCAACACAGGTAAA-3′. Regions flanking the WM hotspot mutation site MYD88 L265 were amplified and sequenced by MEMO (Mutant Enrichment with 3′-Modified Oligonucleotides) PCR [36] using primers MYD88 blocking: 5′-AAGCGACTGATCCCCATCAA-3′[C3SP]; MYD88 forward: 5′-CAGGTGCCCATCAGAAGC-3′; MYD88 reverse: 5′-GAAGTTGGCATCTCCAGGAA-3′. MYD88 reverse primer was used as a sequencing primer.
Real time RT-PCR analysis
Three nanogram of total RNA was used for the RT-PCR reaction using One-step RT-PCR premix kit (iNtRON, Seoul, Korea) with SYBR Green for IRF4 and GAPDH. Primer sequences are IRF4 forward: 5′-CCCGGAAATCCCGTACCAAT-3′; IRF4 reverse: 5′-AGGTGGGGCACAAGCATAAA-3′; GAPDH forward: 5′-GAAGGTGAAGGTCGGAGT-3′; GAPDH reverse: 5′-TGGCAACAATATCCACTTTACCA-3′. Normalized IRF4 mRNA expression is presented as −ΔCt (IRF4-GAPDH).
ACKNOWLEDGMENTS
This research was supported by the Samsung Medical Center and Health Technology R&D Project, the Ministry of Health & Welfare (HI13C2096000013).
Authorship contributions
DR and J-GJ performed the statistical and bioinformatics analyses; J-SB performed WES and RNA-Seq experiments; HJK, KK, S-JK, and HSK recruited and treated patients; H-OL, KK, and W-YP wrote the manuscript; and KK and W-YP designed and guided the study. All authors read and approved the final manuscript.
CONFLICTS OF INTEREST
The authors declare that they have no competing interests.
REFERENCES
1. Kyle RA and Rajkumar SV. Multiple myeloma. Blood. 2008; 111:2962-2972.
2. Rajkumar SV, Dimopoulos MA, Palumbo A, Blade J, Merlini G, Mateos MV, Kumar S, Hillengass J, Kastritis E, Richardson P, Landgren O, Paiva B, Dispenzieri A, Weiss B, LeLeu X, Zweegman S, et al. International Myeloma Working Group updated criteria for the diagnosis of multiple myeloma. Lancet Oncol. 2014; 15:e538-548.
3. King RL, Howard MT, Hodnefield JM and Morice WG. IgM multiple myeloma: pathologic evaluation of a rare entity. Am J Clin Pathol. 2013; 140:519-524.
4. Ghobrial IM. Are you sure this is Waldenstrom macroglobulinemia? Hematology Am Soc Hematol Educ Program. 2012; 2012:586-594.
5. Corre J, Munshi N and Avet-Loiseau H. Genetics of multiple myeloma: another heterogeneity level? Blood. 2015; 125:1870-1876.
6. Hunter ZR, Xu L, Yang G, Zhou Y, Liu X, Cao Y, Manning RJ, Tripsas C, Patterson CJ, Sheehy P and Treon SP. The genomic landscape of Waldenstrom macroglobulinemia is characterized by highly recurring MYD88 and WHIM-like CXCR4 mutations, and small somatic deletions associated with B-cell lymphomagenesis. Blood. 2014; 123:1637-1646.
7. Hodge LS, Ziesmer SC, Yang ZZ, Secreto FJ, Novak AJ and Ansell SM. Constitutive activation of STAT5A and STAT5B regulates IgM secretion in Waldenstrom’s macroglobulinemia. Blood. 2014; 123:1055-1058.
8. Xu L, Hunter ZR, Yang G, Zhou Y, Cao Y, Liu X, Morra E, Trojani A, Greco A, Arcaini L, Varettoni M, Brown JR, Tai YT, Anderson KC, Munshi NC, Patterson CJ, et al. MYD88 L265P in Waldenstrom macroglobulinemia, immunoglobulin M monoclonal gammopathy, and other B-cell lymphoproliferative disorders using conventional and quantitative allele-specific polymerase chain reaction. Blood. 2013; 121:2051-2058.
9. Lohr JG, Stojanov P, Carter SL, Cruz-Gordillo P, Lawrence MS, Auclair D, Sougnez C, Knoechel B, Gould J, Saksena G, Cibulskis K, McKenna A, Chapman MA, Straussman R, Levy J, Perkins LM, et al. Widespread genetic heterogeneity in multiple myeloma: implications for targeted therapy. Cancer Cell. 2014; 25:91-101.
10. Bolli N, Avet-Loiseau H, Wedge DC, Van Loo P, Alexandrov LB, Martincorena I, Dawson KJ, Iorio F, Nik-Zainal S, Bignell GR, Hinton JW, Li Y, Tubio JM, McLaren S, S OM, Butler AP, et al. Heterogeneity of genomic evolution and mutational profiles in multiple myeloma. Nature communications. 2014; 5:2997.
11. Morgan GJ, Walker BA and Davies FE. The genetic architecture of multiple myeloma. Nat Rev Cancer. 2012; 12:335-348.
12. Avet-Loiseau H, Garand R, Lode L, Robillard N and Bataille R. 14q32 Translocations discriminate IgM multiple myeloma from Waldenstrom’s macroglobulinemia. Seminars in oncology. 2003; 30:153-155.
13. White-Gilbertson S, Hua Y and Liu B. The role of endoplasmic reticulum stress in maintaining and targeting multiple myeloma: a double-edged sword of adaptation and apoptosis. Frontiers in genetics. 2013; 4:109.
14. Agirre X, Castellano G, Pascual M, Heath S, Kulis M, Segura V, Bergmann A, Esteve A, Merkel A, Raineri E, Agueda L, Blanc J, Richardson D, Clarke L, Datta A, Russinol N, et al. Whole-epigenome analysis in multiple myeloma reveals DNA hypermethylation of B cell-specific enhancers. Genome Res. 2015; 25:478-487.
15. Zhang S, Xu J, Wu S, Wang R, Qu X, Yu W, Li J and Chen L. IRF4 promotes cell proliferation by JNK pathway in multiple myeloma. Medical oncology. 2013; 30:594.
16. Shaffer AL, Emre NC, Lamy L, Ngo VN, Wright G, Xiao W, Powell J, Dave S, Yu X, Zhao H, Zeng Y, Chen B, Epstein J and Staudt LM. IRF4 addiction in multiple myeloma. Nature. 2008; 454:226-231.
17. Chng WJ, Dispenzieri A, Chim CS, Fonseca R, Goldschmidt H, Lentzsch S, Munshi N, Palumbo A, Miguel JS, Sonneveld P, Cavo M, Usmani S, Durie BG, Avet-Loiseau H and International Myeloma Working G. IMWG consensus on risk stratification in multiple myeloma. Leukemia. 2014; 28:269-277.
18. De Gramont A, Grosbois B, Michaux JL, Peny AM, Pollet JP, Smadja N, Krulik M, Debray J, Bernard JF and Monconduit M. [IgM myeloma: 6 cases and a review of the literature]. La Revue de medecine interne / fondee par la Societe nationale francaise de medecine interne. 1990; 11:13-18.
19. Tahan I, Seale J and Edwards D. IgM multiple myeloma presenting with spinal cord compression caused by a plasmacytoma: A case report. Cases journal. 2008; 1:207.
20. Szalat R and Munshi NC. Genomic heterogeneity in multiple myeloma. Curr Opin Genet Dev. 2015; 30:56-65.
21. Bousquet-Antonelli C, Presutti C and Tollervey D. Identification of a regulated pathway for nuclear pre-mRNA turnover. Cell. 2000; 102:765-775.
22. Mukherjee D, Gao M, O’Connor JP, Raijmakers R, Pruijn G, Lutz CS and Wilusz J. The mammalian exosome mediates the efficient degradation of mRNAs that contain AU-rich elements. The EMBO journal. 2002; 21:165-174.
23. Mitchell P, Petfalski E, Shevchenko A, Mann M and Tollervey D. The exosome: a conserved eukaryotic RNA processing complex containing multiple 3′—>5′ exoribonucleases. Cell. 1997; 91:457-466.
24. Reis FP, Barbas A, Klauer-King AA, Tsanova B, Schaeffer D, Lopez-Vinas E, Gomez-Puertas P, van Hoof A and Arraiano CM. Modulating the RNA processing and decay by the exosome: altering Rrp44/Dis3 activity and end-product. PloS one. 2013; 8:e76504.
25. Tomecki R, Drazkowska K, Kucinski I, Stodus K, Szczesny RJ, Gruchota J, Owczarek EP, Kalisiak K and Dziembowski A. Multiple myeloma-associated hDIS3 mutations cause perturbations in cellular RNA metabolism and suggest hDIS3 PIN domain as a potential drug target. Nucleic acids research. 2014; 42:1270-1290.
26. Robinson SR, Oliver AW, Chevassut TJ and Newbury SF. The 3′ to 5′ Exoribonuclease DIS3: From Structure and Mechanisms to Biological Functions and Role in Human Disease. Biomolecules. 2015; 5:1515-1539.
27. Bergsagel PL, Mateos MV, Gutierrez NC, Rajkumar SV and San Miguel JF. Improving overall survival and overcoming adverse prognosis in the treatment of cytogenetically high-risk multiple myeloma. Blood. 2013; 121:884-892.
28. Shaughnessy JD, Jr., Zhan F, Burington BE, Huang Y, Colla S, Hanamura I, Stewart JP, Kordsmeier B, Randolph C, Williams DR, Xiao Y, Xu H, Epstein J, Anaissie E, Krishna SG, Cottler-Fox M, et al. A validated gene expression model of high-risk multiple myeloma is defined by deregulated expression of genes mapping to chromosome 1. Blood. 2007; 109:2276-2284.
29. Weissbach S, Langer C, Puppe B, Nedeva T, Bach E, Kull M, Bargou R, Einsele H, Rosenwald A, Knop S and Leich E. The molecular spectrum and clinical impact of DIS3 mutations in multiple myeloma. British journal of haematology. 2015; 169:57-70.
30. Li H and Durbin R. Fast and accurate short read alignment with Burrows-Wheeler transform. Bioinformatics. 2009; 25:1754-1760.
31. Wang K, Li M and Hakonarson H. ANNOVAR: functional annotation of genetic variants from high-throughput sequencing data. Nucleic acids research. 2010; 38:e164.
32. Anders S and Huber W. Differential expression analysis for sequence count data. Genome biology. 2010; 11:R106.
33. Huang da W, Sherman BT and Lempicki RA. Systematic and integrative analysis of large gene lists using DAVID bioinformatics resources. Nature protocols. 2009; 4:44-57.
34. Mulligan G, Mitsiades C, Bryant B, Zhan F, Chng WJ, Roels S, Koenig E, Fergus A, Huang Y, Richardson P, Trepicchio WL, Broyl A, Sonneveld P, Shaughnessy JD, Jr., Bergsagel PL, Schenkein D, et al. Gene expression profiling and correlation with outcome in clinical trials of the proteasome inhibitor bortezomib. Blood. 2007; 109:3177-3188.
35. Shi L, Campbell G, Jones WD, Campagne F, Wen Z, Walker SJ, Su Z, Chu TM, Goodsaid FM, Pusztai L, Shaughnessy JD, Jr., Oberthuer A, Thomas RS, Paules RS, Fielden M, Barlogie B, et al. The MicroArray Quality Control (MAQC)-II study of common practices for the development and validation of microarray-based predictive models. Nature biotechnology. 2010; 28:827-838.
36. Lee ST, Kim JY, Kown MJ, Kim SW, Chung JH, Ahn MJ, Oh YL, Kim JW and Ki CS. Mutant enrichment with 3′-modified oligonucleotides a practical PCR method for detecting trace mutant DNAs. J Mol Diagn. 2011; 13:657-668.