
INTRODUCTION
Triple-negative breast cancer (TNBC), defined as a tumor that lacks expression of the oestrogen receptor (ER), the progesterone receptor (PR), and human epidermal growth factor receptor 2 (HER2), accounts for 15–20% of all breast cancer cases [1]. TNBC is associated with younger age at diagnosis, African-American race, higher histological grade, larger size, more advanced disease stage and a tendency towards local and visceral metastases rather than bone metastases [2–6]. TNBC is characterized by high invasiveness, poor prognosis, and an early peak of recurrence within the first 3 years, as well as a higher 5-year mortality rate than other breast cancer subtypes [7, 8].
Given the poor prognosis of TNBC, cancer-related outcomes must be estimated accurately. Several factors responsible for the poor clinical outcomes observed in TNBC, including age, race, grade, tumor size, lymph node status, and distant metastasis, have been studied. Among these factors, tumor size, lymph node status, and distant metastasis serve as important prognostic determinants and constitute the American Joint Committee on Cancer (AJCC) staging system [9]. As such, lymph node status has great clinical significance in guiding the treatment of breast cancer. Accumulating studies have focused on nodal status as one of the most crucial prognostic factors in breast cancer patients [10–12]. For instance, nodal status has been associated with overall prognosis [13, 14]. However, other studies did not confirm the prognostic significance of nodal status in TNBC [15, 16]. Arvold et al. [17] demonstrated that greater numbers of positive lymph nodes and tumor size were not significantly associated with increased risk of locoregional recurrence in their TNBC cohort. In addition, Hernandez-Aya et al. [18] elucidated that TNBC patients with positive lymph node status experienced worse overall survival (OS) and relapse-free survival (RFS) but that the prognosis of these patients may not be affected by the number of positive lymph nodes. Based on small numbers of patients and different populations, investigators have arrived at discordant conclusions. From these relevant studies, we consider that the prognostic value of nodal status continues to remain uncertain and controversial. Therefore, it is necessary to further elucidate the relationship between nodal status and the prognosis of TNBC patients in a larger cohort.
This study was designed to investigate the effects of lymph node status on breast cancer-specific survival (BCSS) and OS among TNBC patients by utilising population-based Surveillance, Epidemiology, and End Results (SEER) data to confirm whether nodal status has prognostic significance.
RESULTS
Demographic and clinical characteristics of the study population
As illustrated in Table 1, a total of 10,771 patients met the eligibility criteria for our study. Among these patients, 69.5% (n=7481) of the patients were classified as N0 (lymph node negative), 21.9% (n=2355) as N1 (one to three positive lymph nodes), 5.2% (n=562) as N2 (four to nine positive lymph nodes), and 3.5% (n=373) as N3 (≥10 positive lymph nodes). Compared with lymph node-negative patients, patients with nodal involvement tended to be younger (the median age of N0 patients was 57 years; P<0.001), presented with a higher histological grade (P<0.001), and were more likely to have a greater tumor size. Furthermore, as the number of positive lymph nodes increased, the tumor size also increased. In addition, lymph node-positive patients underwent mastectomy more frequently than N0 patients (42.5%, 54.1%, 70.3%, and 71.0% for N0, N1, N2, and N3 patients, respectively; P<0.001).
Table 1: Demographic and clinical characteristics of the study population
Characteristics |
N0 (n=7481) |
N1 (n=2355) |
N2 (n=562) |
N3 (n=373) |
Pc |
||||
|---|---|---|---|---|---|---|---|---|---|
No. |
% |
No. |
% |
No. |
% |
No. |
% |
||
Median follow-up duration (months) (IQR) |
16 (8-26) |
16 (8-25) |
17 (10-25) |
14 (7-22.5) |
|
||||
Age (years) |
|
|
|
|
|
|
|
|
<0.001 |
Median |
57 |
|
53 |
|
54 |
|
53 |
|
|
<50 |
2165 |
28.9 |
941 |
40.0 |
205 |
36.5 |
138 |
37.0 |
|
≥50 |
5316 |
71.1 |
1414 |
60.0 |
357 |
63.5 |
235 |
63.0 |
|
Race |
|
|
|
|
|
|
|
|
0.003 |
White |
5529 |
73.9 |
1649 |
70.0 |
409 |
72.8 |
258 |
69.2 |
|
Black |
1422 |
19.0 |
525 |
22.3 |
121 |
21.5 |
87 |
23.3 |
|
Othera |
530 |
7.1 |
181 |
7.7 |
32 |
5.7 |
28 |
7.5 |
|
Marital status |
|
|
|
|
|
|
|
|
0.075 |
Married |
4630 |
61.9 |
1443 |
61.3 |
327 |
58.2 |
211 |
56.6 |
|
Not marriedb |
2851 |
38.1 |
912 |
38.7 |
235 |
41.8 |
162 |
43.4 |
|
Laterality |
|
|
|
|
|
|
|
|
0.143 |
Left |
3882 |
51.9 |
1211 |
51.4 |
313 |
55.7 |
180 |
48.3 |
|
Right |
3599 |
48.1 |
1144 |
48.6 |
249 |
44.3 |
193 |
51.7 |
|
Histological type |
|
|
|
|
|
|
|
|
<0.001 |
Infiltrating duct carcinoma |
7397 |
98.9 |
2334 |
99.1 |
555 |
98.8 |
360 |
96.5 |
|
Lobular carcinoma |
84 |
1.1 |
21 |
0.9 |
7 |
1.2 |
13 |
3.5 |
|
Histological grade |
|
|
|
|
|
|
|
|
<0.001 |
I/II |
1532 |
20.5 |
306 |
13.0 |
71 |
12.6 |
54 |
14.5 |
|
III |
5949 |
79.5 |
2049 |
87.0 |
491 |
87.4 |
319 |
85.5 |
|
Tumor size (cm) |
|
|
|
|
|
|
|
|
<0.001 |
≤2 |
4343 |
58.1 |
747 |
31.7 |
130 |
23.1 |
72 |
19.3 |
|
>2 and ≤5 |
2825 |
37.8 |
1294 |
54.9 |
327 |
58.2 |
194 |
52.0 |
|
>5 |
313 |
4.2 |
314 |
13.3 |
105 |
18.7 |
107 |
28.7 |
|
Type of surgery |
|
|
|
|
|
|
|
|
<0.001 |
None |
196 |
2.6 |
135 |
5.7 |
15 |
2.7 |
15 |
4.0 |
|
Breast-conserving surgery |
4102 |
54.8 |
946 |
40.2 |
152 |
27.0 |
93 |
24.9 |
|
Mastectomy |
3183 |
42.5 |
1274 |
54.1 |
395 |
70.3 |
265 |
71.0 |
|
Radiation therapy |
|
|
|
|
|
|
|
|
<0.001 |
No |
4039 |
54.0 |
1090 |
46.3 |
196 |
34.9 |
235 |
63.0 |
|
Yes |
3442 |
46.0 |
1265 |
53.7 |
366 |
65.1 |
138 |
37.0 |
|
Abbreviation: IQR, interquartile range.
a Other includes American Indian/native Alaskan and Asian/Pacific Islander.
b Not married includes divorced, separated, single (never married), unmarried or domestic partner and widowed.
c P values were calculated among all groups using a Chi-squared test, and bold type indicates significance.
Survival estimates and pairwise comparisons according to tumor size and lymph node status
A Kaplan-Meier plot and log-rank tests were used to compare BCSS and OS between different subgroups according to tumor size classifications, and the results are listed in Table 2 and Figure 1. There were 337 deaths due to breast cancer and 547 deaths due to all causes. For each tumor size category, the Kaplan–Meier survival curves of different groups stratified by lymph node status were distinctly separated. Significant differences in survival outcomes were observed between N0 patients and N1–N3 patients. This result indicated that nodal status was associated with BCSS and OS (both P<0.001). Regardless of the tumor size, the N0 group exhibited better survival outcomes and the N3 group exhibited worse survival outcomes.
Table 2: Estimates of BCSS and OS and pairwise comparisons according to tumor size and lymph node status
Tumor size/nodal status |
No. of patients |
BCSS |
OS |
||||||
|---|---|---|---|---|---|---|---|---|---|
No. of events |
Overall Pa |
Pairwise |
Adjusted Pb |
No. of events |
Overall Pa |
Pairwise |
Adjusted Pb |
||
Total |
10771 |
337 |
<0.001 |
N0 v N1 |
0.133 |
547 |
<0.001 |
N0 v N1 |
0.011 |
N0 |
7481 |
115 |
|
N0 v N2 |
0.654 |
234 |
|
N0 v N2 |
0.785 |
N1 |
2355 |
130 |
|
N0 v N3 |
0.377 |
177 |
|
N0 v N3 |
0.999 |
N2 |
562 |
38 |
|
N1 v N2 |
1.000 |
63 |
|
N1 v N2 |
0.916 |
N3 |
373 |
54 |
|
N1 v N3 |
0.002 |
73 |
|
N1 v N3 |
0.054 |
|
|
|
|
N2 v N3 |
0.053 |
|
|
N2 v N3 |
0.729 |
T1 |
|
|
<0.001 |
N0 v N1 |
0.984 |
|
<0.001 |
N0 v N1 |
0.114 |
Total |
5292 |
76 |
|
N0 v N2 |
0.944 |
151 |
|
N0 v N2 |
0.999 |
N0 |
4343 |
37 |
|
N0 v N3 |
0.865 |
93 |
|
N0 v N3 |
1.000 |
N1 |
747 |
25 |
|
N1 v N2 |
0.998 |
35 |
|
N1 v N2 |
0.874 |
N2 |
130 |
6 |
|
N1 v N3 |
0.610 |
12 |
|
N1 v N3 |
0.836 |
N3 |
72 |
8 |
|
N2 v N3 |
0.592 |
11 |
|
N2 v N3 |
1.000 |
T2 |
|
|
<0.001 |
N0 v N1 |
0.138 |
|
<0.001 |
N0 v N1 |
0.248 |
Total |
4640 |
178 |
|
N0 v N2 |
0.678 |
280 |
|
N0 v N2 |
0.963 |
N0 |
2825 |
62 |
|
N0 v N3 |
1.000 |
112 |
|
N0 v N3 |
1.000 |
N1 |
1294 |
75 |
|
N1 v N2 |
1.000 |
102 |
|
N1 v N2 |
0.986 |
N2 |
327 |
26 |
|
N1 v N3 |
0.542 |
39 |
|
N1 v N3 |
0.874 |
N3 |
194 |
15 |
|
N2 v N3 |
0.829 |
27 |
|
N2 v N3 |
0.999 |
T3 |
|
|
<0.001 |
N0 v N1 |
0.841 |
|
<0.001 |
N0 v N1 |
0.854 |
Total |
839 |
83 |
|
N0 v N2 |
1.000 |
116 |
|
N0 v N2 |
0.931 |
N0 |
313 |
16 |
|
N0 v N3 |
0.987 |
29 |
|
N0 v N3 |
0.993 |
N1 |
314 |
30 |
|
N1 v N2 |
0.993 |
40 |
|
N1 v N2 |
1.000 |
N2 |
105 |
6 |
|
N1 v N3 |
0.190 |
12 |
|
N1 v N3 |
0.375 |
N3 |
107 |
31 |
|
N2 v N3 |
0.987 |
35 |
|
N2 v N3 |
0.670 |
a Overall P was calculated using the Kaplan-Meier method and the log-rank test, and bold type indicates significance.
b Adjusted P was calculated using Sidak pairwise comparisons, and bold type indicates significance.
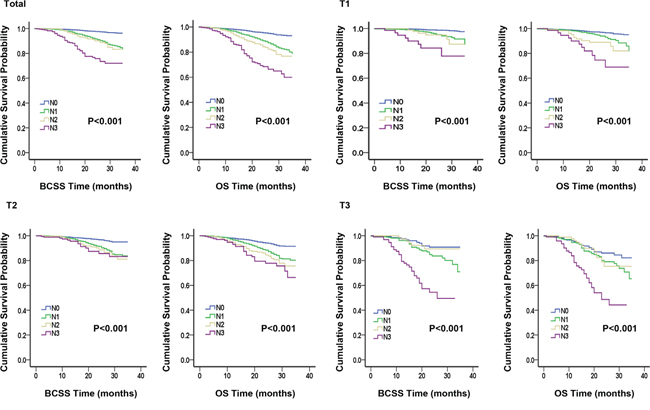
Figure 1: Kaplan-Meier plot and log-rank tests comparing breast cancer-specific survival (BCSS) and overall survival (OS) between different nodal status stages according to tumor size classification.
We conducted six Sidak-adjusted pairwise comparisons of BCSS and OS between the different lymph node status subgroups. The adjusted P values from the pairwise comparisons and the significance of the results are listed in Table 2. In the total cohort, significant differences in prognosis were observed between the N1 and N0 groups and between the N1 and N3 groups. However, no differences in BCSS or OS between the groups stratified by tumor size were observed.
Analyses of outcome-related factors using Cox proportional hazard regression models
The results of the analyses of BCSS and OS using univariate and multivariate Cox proportional hazard regression models are shown in Supplementary Table S1 and Table 3, respectively. According to the univariate analysis shown in Supplementary Table S1, compared with patients with a negative lymph node status, patients with a positive lymph node status exhibited significantly worse BCSS (hazard ratio (HR), 3.692; 95% confidence interval (CI), 2.872 to 4.745 for N1 disease; HR, 4.300; 95% CI, 2.979 to 6.205 for N2 disease; and HR, 11.377; 95% CI, 8.231 to 15.725 for N3 disease; P<0.001) and OS (HR, 2.461; 95% CI, 2.025 to 2.992 for N1 disease; HR, 3.493; 95% CI, 2.645 to 4.614 for N2 disease; and HR, 7.440; 95% CI, 5.719 to 9.678 for N3 disease; P<0.001). Moreover, as the extent of lymph node involvement increased from N1 to N3, the HRs of BCSS and OS increased. The same results were observed based on multivariate analysis. In addition, married status, lower histological grade, a tumor size of ≤2 cm, and receipt of surgery and radiation therapy were independently associated with increased BCSS and OS according to univariate and multivariate analyses.
Table 3: Multivariate Cox proportional hazard model for assessing outcome-related factors
Variable |
BCSS |
OS |
||||
|---|---|---|---|---|---|---|
HR |
95% CI |
Pc |
HR |
95% CI |
Pc |
|
Age (years) |
|
|
|
|
|
|
≥50 |
1 |
|
|
1 |
|
|
<50 |
0.974 |
0.778-1.218 |
0.815 |
0.773 |
0.643-0.929 |
0.006 |
Race |
|
|
0.144 |
|
|
0.029 |
White |
1 |
|
|
1 |
|
|
Black |
1.051 |
0.811-1.362 |
0.709 |
1.047 |
0.855-1.283 |
0.655 |
Othera |
0.606 |
0.359-1.023 |
0.061 |
0.569 |
0.370-0.876 |
0.010 |
Marital status |
|
|
|
|
|
|
Married |
1 |
|
|
1 |
|
|
Not marriedb |
1.144 |
0.915-1.427 |
0.234 |
1.269 |
1.067-1.508 |
0.007 |
Grade |
|
|
|
|
|
|
III |
1 |
|
|
1 |
|
|
I/II |
0.697 |
0.490-0.994 |
0.046 |
0.882 |
0.690-1.128 |
0.316 |
Tumor size |
|
|
<0.001 |
|
|
<0.001 |
T1 |
1 |
|
|
1 |
|
|
T2 |
1.884 |
1.427-2.487 |
<0.001 |
1.644 |
1.338-2.019 |
<0.001 |
T3 |
3.735 |
2.653-5.259 |
<0.001 |
3.032 |
2.322-3.959 |
<0.001 |
Lymph node status |
|
|
<0.001 |
|
|
<0.001 |
N0 |
1 |
|
|
1 |
|
|
N1 |
2.836 |
2.182-3.686 |
<0.001 |
2.024 |
1.650-2.482 |
<0.001 |
N2 |
3.311 |
2.260-4.850 |
<0.001 |
2.940 |
2.199-3.931 |
<0.001 |
N3 |
7.725 |
5.464-10.922 |
<0.001 |
5.599 |
4.228-7.415 |
<0.001 |
Type of surgery |
|
|
<0.001 |
|
|
<0.001 |
Breast-conserving surgery |
1 |
|
|
1 |
|
|
Mastectomy |
1.167 |
0.902-1.510 |
0.240 |
1.208 |
0.986-1.480 |
0.069 |
None |
2.810 |
1.800-4.387 |
<0.001 |
3.067 |
2.179-4.317 |
<0.001 |
Radiation therapy |
|
|
|
|
|
|
No |
1 |
|
|
1 |
|
|
Yes |
0.659 |
0.520-0.835 |
0.001 |
0.582 |
0.481-0.704 |
<0.001 |
Abbreviation: CI, confidence interval.
a Other includes American Indian/native Alaskan and Asian/Pacific Islander.
b Not married includes divorced, separated, single (never married), unmarried or domestic partner and widowed.
c P values were adjusted using a multivariate Cox proportional hazard regression model including all factors, as categorized in Table 3, and bold type indicates significance.
BCSS and OS in tumor size categories stratified by lymph node involvement
Considering the above confounding factors affecting TNBC outcomes, we further evaluated the BCSS and OS of different tumor-size groups stratified by the number of involved lymph nodes after adjusting for potential confounding factors. Among all of the patients, there was a significance difference in BCSS and OS between N0 patients and N1, N2, and N3 patients (P<0.001). N1 was used as a reference, and multivariate Cox proportional hazard regression models of BCSS and OS in each of the three tumor-size groups stratified by nodal status are shown in Table 4. For example, for patients with a tumor size ≤2 cm (T1), there were significant differences in survival outcomes between the N1 subgroup and the N0 and N3 subgroups. Those with N1 lymph node status experienced significantly better BCSS and OS than those with N3 lymph node status (HR, 4.142; 95% CI, 1.843-9.305; P=0.001 for BCSS; HR, 4.046; 95% CI, 2.033-8.049; P<0.001 for OS). However, those with N1 lymph node status experienced worse BCSS and OS than those with N0 lymph node status (HR, 0.258; 95% CI, 0.155-0.430 for BCSS; HR, 0.462; 95% CI, 0.312-0.683 for OS; both P<0.001). In addition, there was no significant difference in the HRs between the N1 and the N2 subgroups. Similar results were observed in patients with a tumor size >5 cm (T3). However, in the group of patients with a tumor size of 2-5 cm (T2), these analogous relationships were no longer apparent. Instead, the number of positive lymph nodes was inversely correlated with OS (HR=1.548 and 2.090 for N2 and N3, respectively). In contrast, the number of positive lymph nodes was not associated with BCSS. There was a significant difference in BCSS between the N1 and N0 groups (P<0.001) but not between the N1 group and either the N2 or N3 group (P=0.203 and P=0.114, respectively).
Table 4: Multivariate Cox proportional hazard model assessing the effect of tumor size stratified by the extent of lymph node involvement
Tumor size/ nodal status |
BCSS |
OS |
||||
|---|---|---|---|---|---|---|
HR |
95% CI |
Pa |
HR |
95% CI |
Pa |
|
Total |
|
|
<0.001 |
|
|
<0.001 |
N1 |
1 |
|
|
1 |
|
|
N0 |
0.296 |
0.229-0.383 |
<0.001 |
0.427 |
0.349-0.521 |
<0.001 |
N2 |
1.192 |
0.827-1.718 |
0.346 |
1.148 |
1.110-1.985 |
<0.001 |
N3 |
3.193 |
2.314-4.406 |
<0.001 |
3.203 |
2.430-4.221 |
<0.001 |
T1 |
|
|
<0.001 |
|
|
<0.001 |
N1 |
1 |
|
|
1 |
|
|
N0 |
0.258 |
0.155-0.430 |
<0.001 |
0.462 |
0.312-0.683 |
<0.001 |
N2 |
1.098 |
0.442-2.729 |
0.841 |
1.473 |
0.754-2.878 |
0.257 |
N3 |
4.142 |
1.843-9.305 |
<0.001 |
4.046 |
2.033-8.049 |
<0.001 |
T2 |
|
|
<0.001 |
|
|
<0.001 |
N1 |
1 |
|
|
1 |
|
|
N0 |
0.370 |
0.262-0.522 |
<0.001 |
0.487 |
0.370-0.641 |
<0.001 |
N2 |
1.098 |
0.897-2.764 |
0.203 |
1.548 |
1.062-2.255 |
0.023 |
N3 |
4.142 |
0.552-1.785 |
0.114 |
2.090 |
1.358-3.216 |
0.001 |
T3 |
|
|
<0.001 |
|
|
<0.001 |
N1 |
1 |
|
|
1 |
|
|
N0 |
0.480 |
0.259-0.890 |
0.020 |
0.605 |
0.372-0.985 |
0.043 |
N2 |
0.651 |
0.268-1.583 |
0.344 |
0.942 |
0.490-1.814 |
0.859 |
N3 |
3.514 |
2.098-5.884 |
<0.001 |
3.026 |
1.899-4.822 |
<0.001 |
Abbreviation: CI, confidence interval.
a P values were adjusted using a multivariate Cox proportional hazard regression model including age, race, marital status, grade, type of surgery, and radiation therapy, and bold type indicates significance.
DISCUSSION
In this large cohort of patients, we sought to determine the interaction effect of lymph node status and tumor size on clinical outcomes among TNBC patients utilising population-based SEER data. Our findings indicated that the lymph node-positive group had a larger tumor size than the lymph node-negative group. Additionally, our results reinforced the concept reported in previous studies that as the number of positive lymph nodes increased, the tumor size also increased [18, 19]. However, when we conducted pairwise comparisons using the Sidak adjustment method, significant differences in prognosis were observed only between N1 and both N0 and N3. Further, to minimize the influence of tumor size on prognosis, we evaluated BCSS and OS between nodal status groups stratified by tumor size using a multivariate Cox proportional hazard regression model. Importantly, among the T1 and T3 cohorts, the N1 subgroups exhibited similar BCSS and OS to the N2 subgroups, whereas the N3 subgroups tended to experience worse outcomes than the N1 subgroups. Therefore, ten metastatic lymph nodes served as the cut-off value for poor prognosis. Furthermore, in the T2 group, the number of positive lymph nodes contributed prognostic value to OS, and as the number of lymph nodes increased, OS decreased. However, a significant difference in BCSS was observed between N1 and N0 but not between N1 and either N2 or N3.
Our results indicated that patients with lymph-node negative TNBC had a clearly better prognosis than lymph node-positive TNBC patients. This result was in accordance with other studies [20–22]. It is well known that in breast cancer, the number of positive lymph nodes is inversely associated with prognosis and survival. However, Hernandez-Aya LF et al. [18] found that the prognosis of TNBC may not be affected by the number of positive lymph nodes. In our study, a higher number of positive lymph nodes did not completely guarantee worse outcomes. Instead, worse BCSS or OS with increasing lymph node involvement was not observed until a cut-off value of ten metastatic lymph nodes. Although TNBC is an aggressive disease, hematogenous metastasis is significantly more frequent than nodal metastasis in TNBC. Accordingly, we recognized that its prognosis is driven in part by the biology of triple-negative disease, as well as by clinical variables such as the extent of nodal involvement upon surpassing a cut-off value. Our findings might have an effect on clinical practice for TNBC patients. In particular, our study reinforced that N3 patients had substantial risk of mortality due to breast cancer and all causes; thus, N3 patients should be treated with aggressive systemic and locoregional therapy, especially intensive radiation therapy, which was essential for lymph node-positive patients.
In addition, tumor size was consistently recognized as another reliable factor confounding the prediction of outcomes among women with TNBC [23]. Our study showed that nodal status and tumor size exhibited distinct influences on prognosis. Further analysing the causes of this disparity, we initially suspected that tumor size had a great effect on the relationship between nodal status and prognosis. However, it has been reported by Carter et al. [19] that survival outcomes worsened with increased lymph node involvement regardless of tumor size. Therefore, we considered another potential explanation: as demonstrated by previous analyses of patients with TNBC, tumor size and lymph node status may not linearly correlate with survival outcomes [1, 24]. Wo et al. [25] reported that among ER-negative patients with four or more positive lymph nodes, those with T1b tumor stage exhibited a significantly lower rate of breast cancer–specific mortality (BCSM) than those with T1a tumor stage; however, in that study, there was no significant difference in BCSM between patients with T1a and either T1c or T2 tumor stages. Therefore, further analysis of the relationship between tumor size and nodal status is required in the future.
Our study contains several limitations. In terms of follow-up data, it is well known that information regarding HER-2 expression in the SEER database was not available until 2010. We were therefore compelled to focus on the short-term survival outcomes after initial diagnosis and to identify any outcome-related factors and an inadequate follow-up duration may lead to skewed results. But for TNBC subtype, an early peak of recurrence occurs within the first 2-3 years after diagnosis. In addition, differences in treatments could influence survival outcomes, but information regarding adjuvant or neoadjuvant chemotherapy is not available in the SEER database.
In conclusion, our study revealed that among all TNBC patients, those with N0 lymph node status experienced significantly better BCSS and OS than those with N1–N3 lymph node status. Additionally, for patients with T1 or T3, the prognosis of the N1 group was better than that of the N3 group but appeared similar to that of the N2 group. Therefore, nodal status and tumor size exhibited distinct interaction patterns for predicting the outcomes of TNBC. These results provide deeper insight into the prognostic value of nodal status for TNBC.
MATERIALS AND METHODS
Ethics statement
Our study was approved by an independent ethics committee/institutional review board at Fudan University Shanghai Cancer Center (Shanghai Cancer Center Ethics Committee). The data in the SEER database do not require informed patient consent because cancer is a disease reported by every state of the United States.
Patients
We used SEER*Stat version 8.2.1 to generate a case list. We identified 10,771 patients according to the following inclusion criteria: female; year of diagnosis from 2010 to 2012; age of diagnosis between 20 years and 74 years; breast cancer as the first and only malignant cancer diagnosis; pathologically confirmed infiltrating duct carcinoma-not otherwise specified (IDC-NOS, ICD-O-3 8500/3) or lobular carcinoma-not otherwise specified (ILC-NOS, ICD-O-3 8520/3); unilateral cancer; TNBC subtype (absence of ER, PR, and HER2); histological grades I-III; AJCC stages I-III; known tumor size category; and known lymph node status. We excluded patients with inflammatory breast cancer, in situ disease, histological grade IV (SEER program code: undifferentiated or anaplastic), and no record of surgery type or radiation therapy. We calculated follow-up durations from January 1, 2010 to December 31, 2012.
Patients were categorized according to their tumor size, i.e., T1 (tumor size ≤2 cm), T2 (tumor size 2-5 cm) or T3 (tumor size >5 cm), and lymph node status. The number of positive lymph nodes was categorized into one of four groups: N0 (no positive lymph nodes), N1 (1-3 positive lymph nodes), N2 (4-9 positive lymph nodes), and N3 (≥10 positive lymph nodes).
Statistical analyses
The demographic and clinical characteristics of the included cases were compared between the four lymph node groups using a Chi-squared test. The Kaplan-Meier method was performed to generate survival curves, and the log-rank test was performed to compare the unadjusted BCSS and OS rates of patients with different lymph node status. BCSS was measured from the date of diagnosis to the date of breast cancer death. OS was defined as the time from the date of diagnosis to the date of death due to any cause (including breast cancer) or the last follow-up. In addition, we conducted pairwise comparisons using the Sidak adjustment method and found that the N1 group was the only group that exhibited a significant difference in prognosis. Accordingly, we used N1 as a reference to compare the different HRs of BCSS and OS within each tumor size category. Adjusted HRs with 95% CIs were calculated using a Cox proportional hazard regression model to estimate the outcome-related factors. All tests were two-tailed. P-values <0.05 were considered significant. All statistical analyses were performed utilising SPSS version 20.0 software (IBM SPSS Statistics, Chicago, IL, US).
ACKNOWLEDGMENTS
This work was supported by grants from the Training Plan of Middle-aged and Young Talents of Fujian Province Health and Family Planning Commission (2014-ZQN-ZD-10); the Provincial Natural Science Foundation of Fujian, China (2012J01357); the Research Project of Fudan University Shanghai Cancer Center (YJ201401); the National Natural Science Foundation of China (81372848, 81370075); the Municipal Project for Developing Emerging and Frontier Technology in Shanghai Hospitals (SHDC12010116); the Cooperation Project of Conquering Major Diseases in Shanghai Municipality Health System (2013ZYJB0302); the Innovation Team of the Ministry of Education (IRT1223); and the Shanghai Key Laboratory of Breast Cancer (12DZ2260100).
CONFLICTS OF INTEREST
The authors have declared that no competing interests exist.
REFERENCES
1. Dent R, Trudeau M, Pritchard KI, Hanna WM, Kahn HK, Sawka CA, Lickley LA, Rawlinson E, Sun P, Narod SA. Triple-negative breast cancer: clinical features and patterns of recurrence. Clin Cancer Res. 2007; 13:4429-4434.
2. Azim HA, Jr., Michiels S, Bedard PL, Singhal SK, Criscitiello C, Ignatiadis M, Haibe-Kains B, Piccart MJ, Sotiriou C, Loi S. Elucidating prognosis and biology of breast cancer arising in young women using gene expression profiling. Clin Cancer Res. 2012; 18:1341-1351.
3. Cancello G, Maisonneuve P, Rotmensz N, Viale G, Mastropasqua MG, Pruneri G, Veronesi P, Torrisi R, Montagna E, Luini A, Intra M, Gentilini O, Ghisini R, et al. Prognosis and adjuvant treatment effects in selected breast cancer subtypes of very young women (<35 years) with operable breast cancer. Ann Oncol. 2010; 21:1974-1981.
4. Mersin H, Yildirim E, Berberoglu U, Gulben K. The prognostic importance of triple negative breast carcinoma. Breast. 2008; 17:341-346.
5. Lund MJ, Trivers KF, Porter PL, Coates RJ, Leyland-Jones B, Brawley OW, Flagg EW, O’Regan RM, Gabram SG, Eley JW. Race and triple negative threats to breast cancer survival: a population-based study in Atlanta, GA. Breast Cancer Res Treat. 2009; 113:357-370.
6. Liedtke C, Mazouni C, Hess KR, Andre F, Tordai A, Mejia JA, Symmans WF, Gonzalez-Angulo AM, Hennessy B, Green M, Cristofanilli M, Hortobagyi GN, Pusztai L. Response to neoadjuvant therapy and long-term survival in patients with triple-negative breast cancer. J Clin Oncol. 2008; 26:1275-1281.
7. Nguyen PL, Taghian AG, Katz MS, Niemierko A, Abi Raad RF, Boon WL, Bellon JR, Wong JS, Smith BL, Harris JR. Breast cancer subtype approximated by estrogen receptor, progesterone receptor, and HER-2 is associated with local and distant recurrence after breast-conserving therapy. J Clin Oncol. 2008; 26:2373-2378.
8. Haffty BG, Yang Q, Reiss M, Kearney T, Higgins SA, Weidhaas J, Harris L, Hait W, Toppmeyer D. Locoregional relapse and distant metastasis in conservatively managed triple negative early-stage breast cancer. J Clin Oncol. 2006; 24:5652-5657.
9. Singletary SE. Revision of the American Joint Committee on Cancer Staging System for Breast Cancer. J Clin Oncol. 2002; 20:3628-3636.
10. Vinh-Hung V, Burzykowski T, Cserni G, Voordeckers M, Van De Steene J, Storme G. Functional form of the effect of the numbers of axillary nodes on survival in early breast cancer. Int J Oncol. 2003; 22:697-704.
11. Fisher B, Bauer M, Wickerham DL, Redmond CK, Fisher ER, Cruz AB, Foster R, Gardner B, Lerner H, Margolese R. Relation of number of positive axillary nodes to the prognosis of patients with primary breast cancer. Cancer. 1983; 52:1551-1557.
12. Jatoi I, Hilsenbeck SG, Clark GM, Osborne CK. Significance of axillary lymph node metastasis in primary breast cancer. J Clin Oncol. 1999; 17:2334-2340.
13. Steward L, Conant L, Gao F, Margenthaler JA. Predictive factors and patterns of recurrence in patients with triple negative breast cancer. Ann Surg Oncol. 2014; 21:2165-2171.
14. Lee JA, Kim KI, Bae JW, Jung YH, An H, Lee ES, Korean Breast Cancer S. Triple negative breast cancer in Korea-distinct biology with different impact of prognostic factors on survival. Breast Cancer Res Treat. 2010; 123:177-187.
15. Nishimura R, Arima N. Is triple negative a prognostic factor in breast cancer? Breast Cancer. 2008; 15:303-308.
16. Shibuta K, Ueo H, Furusawa H, Komaki K, Rai Y, Sagara Y, Kamada Y, Tamaki N. The relevance of intrinsic subtype to clinicopathological features and prognosis in 4,266 Japanese women with breast cancer. Breast Cancer. 2011; 18:292-298.
17. Arvold ND, Taghian AG, Niemierko A, Abi Raad RF, Sreedhara M, Nguyen PL, Bellon JR, Wong JS, Smith BL, Harris JR. Age, breast cancer subtype approximation, and local recurrence after breast-conserving therapy. J Clin Oncol. 2011; 29:3885-3891.
18. Hernandez-Aya LF, Chavez-Macgregor M, Lei X, Meric-Bernstam F, Buchholz TA, Hsu L, Sahin AA, Do KA, Valero V, Hortobagyi GN, Gonzalez-Angulo AM. Nodal status and clinical outcomes in a large cohort of patients with triple-negative breast cancer. J Clin Oncol. 2011; 29:2628-2634.
19. Carter CL, Allen C, Henson DE. Relation of tumor size, lymph node status, and survival in 24,740 breast cancer cases. Cancer. 1989; 63:181-187.
20. Ovcaricek T, Frkovic S, Matos E, Mozina B, Borstnar S. Triple negative breast cancer - prognostic factors and survival. Radiol Oncol. 2011; 45:46-52.
21. Rakha EA, El-Sayed ME, Green AR, Lee AH, Robertson JF, Ellis IO. Prognostic markers in triple-negative breast cancer. Cancer. 2007; 109:25-32.
22. Liao GS, Chou YC, Hsu HM, Dai MS, Yu JC. The prognostic value of lymph node status among breast cancer subtypes. Am J Surg. 2015; 209:717-724.
23. Anders CK, Deal AM, Miller CR, Khorram C, Meng H, Burrows E, Livasy C, Fritchie K, Ewend MG, Perou CM, Carey LA. The prognostic contribution of clinical breast cancer subtype, age, and race among patients with breast cancer brain metastases. Cancer. 2011; 117:1602-1611.
24. Foulkes WD, Grainge MJ, Rakha EA, Green AR, Ellis IO. Tumor size is an unreliable predictor of prognosis in basal-like breast cancers and does not correlate closely with lymph node status. Breast Cancer Res Treat. 2009; 117:199-204.
25. Wo JY, Chen K, Neville BA, Lin NU, Punglia RS. Effect of very small tumor size on cancer-specific mortality in node-positive breast cancer. J Clin Oncol. 2011; 29:2619-2627.