
INTRODUCTION
Hepatitis B virus (HBV) infection is a global health concern with an estimated prevalence of 400 million people worldwide and causes over 1 million deaths annually [1, 2]. Patients with chronic HBV infection undergo variable clinical courses and have a wide spectrum of clinical presentations. The clinical manifestations after HBV infection include asymptomatic hepatitis B surface antigen carriers (AsC) state, chronic hepatitis B (CHB), with progression to LC, and HCC [3]. Despite much investigation, the causes underlying hepatocarcinogenesis have not been fully elucidated. Accumulated evidence suggests that host susceptibility, environmental factors (e.g., aflatoxin B1 exposure) and viral factors (e.g., HBV genotypes, viral mutants, and viral load) as well as the interplay between these factors, determine the phenotype [4–7].
Based on a divergence over the entire genome of greater than 8%, HBV is classified into eight genotypes (A to H), which can be further segregated into sub-genotypes based on a > 4% (but < 8%) difference in the entire nucleotide sequence with distinct ethnic or geographic origin [8]. Genotypes B and C are predominant in Asia [9, 10], while genotype A is the predominant HBV genotype in southern Africa. Several published studies indicate that genotype C is associated with an increased risk of HCC development [10, 11] and has a lower response rate to conventional interferon therapy compared with genotype B [12]. In the Caucasian and Indian populations, genotype D is associated with a greater risk for HCC than genotype A [13, 14]. However, HBV varies genetically not only between but also within genotypes. Therefore, HBV strains of the same genotype may differ in the capacity to induce the progression of liver disease.
HBV is a small, enveloped 3.2 kb DNA virus with four overlapping open reading frames (pre-S/S, precore/core, polymerase, and X-gene). The pre-S region plays an essential role in the interaction with the immune responses because they contain both B- and T-cell epitopes [15, 16]. The precore region encodes the precore protein, which is processed in the endoplasmic reticulum to produce secreted hepatitis B e antigen (HBeAg). The basic core promoter (BCP) resides in the overlapping HBV functional X gene domain and controls the transcription activity of procore RNA [17]. The HBV X protein is capable of transactivating HBV promoters and a variety of cellular functions [18]. As lacks proofreading activity of viral reverse transcriptase, spontaneous error in HBV replication occur at a much higher rate than in other DNA viruses. The HBV genome evolves during the course of infection under the antiviral pressure of the host immunity and/or specific therapy [19]. Hence, various mutations may be observed in the HBV genome during long-term infection, and these mutants could display alteration of epitopes important in the host immune recognition, enhanced virulence with increased replication of HBV, resistance to antiviral therapies, or facilitated cell attachment/penetration [20]. Furthermore, some of mutants could serve as viral markers in predicting the development of HBV-associated HCC.
In the past decades, numerous studies have been conducted to investigate mutations in viral genome and outcomes of HBV infection [21–27]. Among these mutants, precore G to A stop codon mutant at nucleotide position 1896 is detected in fulminant hepatitis, acute hepatitis, chronic hepatitis, LC, and HCC [28]. The pre-S deletions were found commonly in the pre-S1 region and pre-S2 region [29]. Several possible hepatocarcinogenic effects of pre-S deletions were speculated. The A1762T/G1764A double mutations, is the most commonly studied variants in the BCP region [30]. However, the relationship between Enh II/BCP mutations and LC/HCC risk is largely uncharacterized, especially with regard to the T1653 and V1753 mutations [26, 27]. Yang et al. [31] reported that the precore G1896A mutant was associated with a decreased risk of HCC; while Zhang et al. [32] found that G1896A mutation was more frequent in the patients with HBV-related liver diseases than in asymptomatic carriers. Considering lacks of sufficient evidence about the effect of HBV mutants on liver disease and the conflicting results reported, as well as increased studies in recent years, we therefore performed a systematic meta-analysis to assess the association between the most commonly studied HBV mutations and LC/HCC risks.
RESULTS
Characteristics of the included studies
Our database search retrieved 3676 citations. After duplicates were removed 2118 citations remained for title and abstract screening. Supplementary Figure S1 shows the study selection process. In all, we included 118 studies in this meta-analysis, with a total of 2,697 LC cases, 9,418 HCC cases and 18,785 HBV carriers concerning 11 viral mutations (T1753V, A1762T, G1764A, A1762T/G1764A double mutations C1766T, and T1768A in BCP region; C1653T in X region; T1858C, G1896A, G1899A in precore region; pre-S mutation). Most included studies were case-control design, involving participants from a wide range of populations in East Asian (n = 94), South Asian (n = 13), Caucasian (n = 4), African (n = 4), and other ethnic origins (n = 3). The main study characteristics were summarized in Supplementary Table S1.
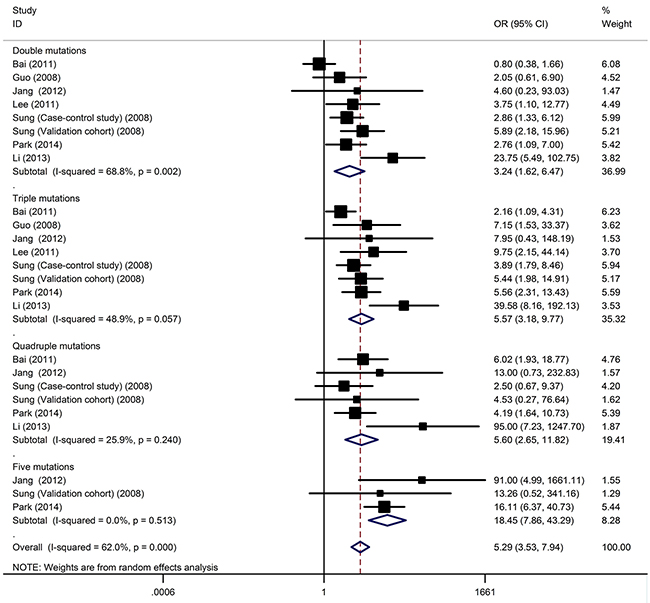
Figure 1: The cumulative effect of viral mutations on HCC development.
HBV genotype and HCC/LC risks
The data on genotypes of the HBV among cases stratified by outcomes of HBV infection were available in 51 studies (including 8337 subjects with genotype C, 6095 subjects with genotype B, 421 subjects with genotype D, 401 subjects with genotype A, 644 subjects with mixed genotypes). By combing 46 studies with 5440 subjects, the overall OR of the genotype C for HCC was 1.73 (95% CI: 1.30–2.32, P < 10-4; Pheterogeneity < 10-5, I2 = 89.0%) compared with genotype B. The data on genotype of HBV among HBV infected patients were available in 18 studies, which included 1162 LC cases and 3068 controls. The association between HBV genotype and LC susceptibility, for which an OR of 2.28 (95% CI: 1.73–3.00, P < 10-5; Pheterogeneity = 0.001, I2 = 59.8%) for genotype C appeared in compared with individuals with genotype B.
HBV mutations and HCC risks
Table 1 summarize the main results of the meta-analysis for 11 HBV mutations and HCC. Overall, significantly increased HCC risks were found for A1762T/G1764A (OR = 3.63, 95% CI: 3.07-4.29), G1896A (OR = 1.46, 95% CI: 1.18-1.80), G1899A (OR = 2.17, 95% CI: 1.49-3.16), T1753V (OR = 2.14, 95% CI: 1.75-2.60), C1653T (OR = 2.61, 95% CI: 2.16-3.16), G1766A (OR = 1.76, 95% CI: 1.30-2.39), A1762T (OR = 3.27, 95% CI: 2.22-4.81), G1764A (OR = 3.24, 95% CI: 2.13-4.92), T1768A (OR = 2.00, 95% CI: 1.09-3.67) and Pre-S mutations (OR = 3.27, 95% CI: 2.48-4.32). However, C1858T was not statistically significantly associated with HCC risk. The association for 9 mutations were still highly significant, but T1768A was failed to pass Bonferroni correction for multiple testing in 11 tests (adjusted P = 0.0045). We also conducted several subgroup analyses according to ethnicity, and sample size (Table 1). When stratified for ethnicity, significantly increased risks were found among East Asians in 9 mutations (A1762T/G1764A, G1896A, G1899A, T1753V, C1653T, G1766A, A1762T, G1764A, and Pre-S mutation). Among South Asians, positive result still maintained for A1762T/G1764A, G1899A, T1753V, C1653T, A1762T, T1768A, and Pre-S mutations. However, no significant association was found for Caucasians and African populations for almost all mutations (Supplementary Figure S2). In the stratified analysis by sample size, matching of age, significant associations were detected in almost all subgroups (Table 1).
Table 1: Associations of HBV mutations with HCC compared with non-HCC subjects
Mutations |
Overall and subgroups analyses |
No. of data sets |
OR (95% CI) |
P(Z) |
P(Q) |
I2 (%) |
|---|---|---|---|---|---|---|
A1762T/G1764A |
Total |
88 |
3.63 (3.07-4.29) |
<10-5 |
<10-5 |
78.5 |
East Asian |
69 |
3.69 (3.08-4.33) |
<10-5 |
<10-5 |
79.3 |
|
South Asian |
10 |
4.10 (2.34-7.20) |
<10-5 |
0.001 |
69.6 |
|
African |
4 |
2.49 (0.87-7.10) |
0.09 |
0.001 |
82.9 |
|
Caucasian |
4 |
3.28 (1.07-10.08) |
0.04 |
0.001 |
81.4 |
|
No. of cases <100 |
65 |
3.55 (2.90-4.35) |
<10-5 |
<10-5 |
65.1 |
|
No. of cases ≥ 100 |
23 |
3.77 (2.82-5.03) |
<10-5 |
<10-5 |
89.2 |
|
Age matched |
35 |
3.27 (2.57-4.15) |
<10-5 |
<10-5 |
77.3 |
|
Age-matching unknown |
53 |
3.94 (3.10-5.01) |
<10-5 |
<10-5 |
79.5 |
|
G1896A |
Total |
63 |
1.44 (1.19-1.74) |
<10-4 |
<10-5 |
80.4 |
East Asian |
46 |
1.49 (1.21-1.85) |
<10-4 |
<10-5 |
83.3 |
|
South Asian |
10 |
1.33 (0.64-2.73) |
0.44 |
<10-5 |
75.7 |
|
Caucasian |
3 |
1.44 (0.70-2.94) |
0.32 |
0.07 |
62.7 |
|
No. of cases <100 |
46 |
1.42 (1.10-1.84) |
0.008 |
<10-5 |
71.4 |
|
No. of cases ≥ 100 |
17 |
1.49 (1.11-2.01) |
0.009 |
<10-5 |
89.7 |
|
Age matched |
24 |
1.24 (1.03-1.49) |
0.03 |
<10-4 |
56.2 |
|
Age-matching unknown |
39 |
1.55 (1.15-2.08) |
0.004 |
<10-5 |
83.7 |
|
G1899A |
Total |
20 |
2.17 (1.49-3.16) |
<10-4 |
<10-5 |
79.3 |
East Asian |
14 |
2.24 (1.40-3.60) |
0.001 |
<10-5 |
84.9 |
|
South Asian |
4 |
2.17 (1.18-3.98) |
0.01 |
0.16 |
41.7 |
|
No. of cases <100 |
14 |
2.70 (1.83-3.97) |
<10-5 |
0.05 |
41.2 |
|
No. of cases ≥ 100 |
6 |
1.52 (0.76-3.04) |
0.24 |
<10-5 |
92.4 |
|
Age matched |
10 |
2.13 (1.11-4.06) |
0.02 |
<10-5 |
86.4 |
|
Age-matching unknown |
10 |
2.71 (1.99-3.69) |
<10-5 |
0.20 |
26.5 |
|
T1753V |
Total |
43 |
2.14 (1.75-2.60) |
<10-5 |
<10-5 |
70.5 |
East Asian |
34 |
2.20 (1.78-2.74) |
<10-5 |
<10-5 |
72.6 |
|
South Asian |
6 |
2.04 (1.06-3.91) |
0.03 |
0.004 |
71.3 |
|
No. of cases <100 |
31 |
2.20 (1.70-2.84) |
<10-5 |
<10-5 |
56.8 |
|
No. of cases ≥ 100 |
12 |
2.03 (1.46-2.82) |
<10-5 |
<10-5 |
84.7 |
|
Age matched |
20 |
1.89 (1.44-2.47) |
<10-5 |
<10-5 |
70.9 |
|
Age-matching unknown |
23 |
2.40 (1.78-3.24) |
<10-5 |
<10-5 |
69.9 |
|
C1653T |
Total |
36 |
2.61 (2.16-3.16) |
<10-5 |
<10-5 |
58.7 |
East Asian |
29 |
2.78 (2.29-3.38) |
<10-5 |
<10-5 |
58.7 |
|
South Asian |
5 |
2.19 (1.33-3.61) |
0.002 |
0.63 |
0 |
|
No. of cases <100 |
25 |
2.67 (1.96-3.63) |
<10-5 |
<10-5 |
60.4 |
|
No. of cases ≥ 100 |
11 |
2.61 (2.09-3.27) |
<10-5 |
0.01 |
57.2 |
|
Age matched |
17 |
2.49 (1.85-3.35) |
<10-5 |
0.003 |
53.7 |
|
Age-matching unknown |
19 |
2.73 (2.10-3.54) |
<10-5 |
<10-5 |
64.9 |
|
C1858T |
Total |
8 |
1.80 (0.86-3.74) |
0.12 |
<10-5 |
78.8 |
East Asian |
4 |
1.18 (0.39-3.53) |
0.77 |
<10-5 |
85.0 |
|
South Asian |
4 |
2.80 (1.67-4.69) |
<10-4 |
0.85 |
0 |
|
Age matched |
3 |
1.46 (0.59-3.57) |
0.41 |
0.09 |
58.2 |
|
Age-matching unknown |
5 |
2.06 (0.66-6.44) |
0.22 |
<10-5 |
85.8 |
|
G1766A |
Total |
9 |
1.76 (1.30-2.39) |
<10-4 |
0.51 |
0 |
East Asian |
6 |
1.79 (1.26-2.56) |
0.001 |
0.36 |
9.5 |
|
South Asian |
2 |
2.53 (0.88-7.33) |
0.09 |
0.33 |
0 |
|
Age matched |
4 |
2.49 (1.48-4.17) |
0.001 |
0.77 |
0 |
|
Age-matching unknown |
5 |
1.47 (1.01-2.14) |
0.04 |
0.47 |
0 |
|
A1762T |
Total |
20 |
3.27 (2.22-4.81) |
<10-5 |
<10-5 |
86.7 |
East Asian |
16 |
3.55 (2.30-5.48) |
<10-5 |
<10-5 |
88.3 |
|
South Asian |
2 |
2.82 (1.17-6.82) |
0.02 |
0.11 |
61.3 |
|
No. of cases <100 |
13 |
3.32 (1.80-6.13) |
<10-4 |
<10-5 |
78.1 |
|
No. of cases ≥ 100 |
7 |
3.32 (1.93-5.70) |
<10-5 |
<10-5 |
92.5 |
|
Age matched |
12 |
2.58 (1.64-4.05) |
<10-4 |
<10-5 |
87.5 |
|
Age-matching unknown |
8 |
5.11 (2.27-11.48) |
<10-4 |
<10-5 |
83.3 |
|
G1764A |
Total |
21 |
3.24 (2.13-4.92) |
<10-5 |
<10-5 |
87.1 |
East Asian |
16 |
4.02 (2.56-6.33) |
<10-5 |
<10-5 |
86.9 |
|
South Asian |
2 |
2.86 (0.92-8.89) |
0.07 |
0.04 |
75.6 |
|
No. of cases <100 |
14 |
3.07 (1.75-5.37) |
<10-4 |
<10-5 |
71.5 |
|
No. of cases ≥ 100 |
7 |
3.50 (1.87-6.55) |
<10-4 |
<10-5 |
93.5 |
|
Age matched |
13 |
2.80 (1.61-4.86) |
<10-4 |
<10-5 |
90.2 |
|
Age-matching unknown |
8 |
4.28 (2.16-8.45) |
<10-4 |
<10-5 |
76.6 |
|
T1768A |
Total |
6 |
2.00 (1.09-3.67) |
0.03 |
0.18 |
34.8 |
East Asian |
3 |
1.71 (0.64-4.58) |
0.29 |
0.05 |
66.2 |
|
South Asian |
2 |
3.29 (1.17-9.31) |
0.03 |
0.74 |
0 |
|
Pre-S |
Total |
27 |
3.27 (2.48-4.32) |
<10-5 |
<10-5 |
66.1 |
East Asian |
22 |
3.42 (2.47-4.75) |
<10-5 |
<10-5 |
71.4 |
|
South Asian |
3 |
2.38 (1.41-4.02) |
0.001 |
0.61 |
0 |
|
No. of cases <100 |
21 |
3.15 (2.60-3.81) |
<10-5 |
0.63 |
0 |
|
No. of cases ≥ 100 |
6 |
3.10 (1.35-7.12) |
0.008 |
<10-5 |
91.2 |
|
Age matched |
13 |
3.49 (2.54-4.81) |
<10-5 |
0.12 |
33.3 |
|
Age-matching unknown |
14 |
3.04 (1.99-4.64) |
<10-5 |
<10-5 |
77.0 |
P(Z): Z test used to determine the significance of the overall OR
P(Q): Cochran’s chi-square Q statistic test used to assess the heterogeneity in subgroups
Predictive value of HBV mutations on HCC development
To comprehensively evaluate the predictive value of HBV mutations, we also extracted data from 15 prospective studies (4 cohort and 11 nested case-control studies) to investigate if the HBV carriers with virus mutations have an accelerated HCC development. Overall, A1762T/G1764A, Pre-S, T1753V, and C1653T mutations at baseline were all significantly associated with an increased rate of development of HCC, showing ORs from 1.73 to 4.54 (Table 2).
Table 2: Predictive value of HBV mutations on HCC development by pooling data from prospective studies
Mutations |
Overall and subgroups analyses |
No. of data sets |
OR (95% CI) |
P(Z) |
P(Q) |
I2 (%) |
|---|---|---|---|---|---|---|
A1762T/G1764A |
Total |
12 |
4.54 (2.87-7.20) |
<10-5 |
<10-5 |
85.2 |
NCC |
8 |
4.18 (2.27-7.70) |
<10-5 |
<10-5 |
89.2 |
|
Cohort |
4 |
5.52 (2.62-11.60) |
<10-5 |
0.03 |
67.9 |
|
G1896A |
Total |
7 |
1.02 (0.45-2.51) |
0.97 |
<10-5 |
93.2 |
NCC |
4 |
1.51 (0.51-3.38) |
0.58 |
<10-5 |
93.6 |
|
Cohort |
3 |
0.64 (0.12-3.34) |
0.59 |
<10-5 |
91.2 |
|
T1753V |
Total |
4 |
1.73 (1.18-2.52) |
0.005 |
0.31 |
15.6 |
NCC |
3 |
1.69 (1.03-2.78) |
0.04 |
0.18 |
41.2 |
|
Cohort |
1 |
2.01 (0.83-4.90) |
0.12 |
NA |
NA |
|
C1653T |
Total |
3 |
2.00 (1.28-3.11) |
0.002 |
0.71 |
0 |
NCC |
2 |
1.95 (1.22-3.13) |
0.005 |
0.44 |
0 |
|
Cohort |
1 |
2.36 (0.63-8.92) |
0.20 |
NA |
NA |
|
Pre-S |
Total (All NCC) |
4 |
3.58 (2.10-6.08) |
<10-5 |
0.22 |
31.5 |
NCC: nested case-control; NA: not available
P(Z): Z test used to determine the significance of the overall OR
P(Q): Cochran’s chi-square Q statistic test used to assess the heterogeneity in subgroups
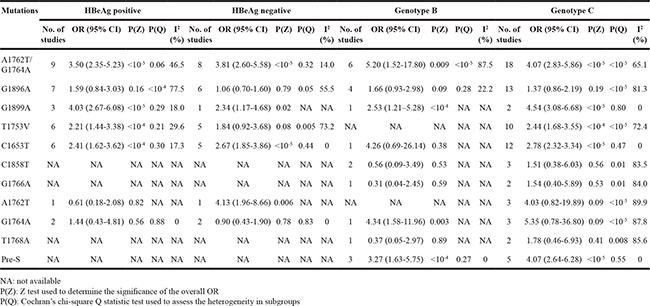
Subgroup analysis of HBV mutations on HCC risks by HBeAg status and HBV genotype
We next evaluated the risks of HCC for 11 HBV mutations among case and control subjects stratified by HBeAg status, and HBV genotype (Table 3). When analysed according to HBeAg status for A1762T/G1764A, significantly increased HCC risk was observed for HBeAg-positive and HBeAg-negative group with summary crude OR of 3.50 (95% CI: 2.35-5.23) and of 3.81 (95% CI: 2.60-5.58), respectively. Significant association was also observed between HCC risk and virus mutations in HBeAg-positive group for G1899A, T1753V, and C1653T. As for HBeAg-negative group, 3 mutations (G1899A, C1653T, and A1762T) were significantly associated with HCC. The overall OR for A1762T/G1764A mutations was higher in subjects with HBV genotype B than in those with HBV genotype C, whereas the opposite was true for G1899A, even though those mutations were significantly associated with increased risk of HCC irrespective of HBV genotypes. For A1762T/G1764A, individuals with HBV genotype D (OR = 6.31, 95% CI: 2.50-15.92; P = 0.001) had a higher increased HCC risk compared to individuals with HBV genotype A (OR = 3.84, 95% CI: 1.05-14.05; P = 0.04).
Table 3: Stratified analyses of HBV mutations and HCC risks by HBeAg status and HBV genotype
Cumulative effect of viral mutations on HCC development
The effect of each mutation of HCC risk was independently assessed. No association was established between combined mutations of HBV genome and HCC. The data on number of HBV mutations among cases and controls were available in eight studies, which included 898 HCC patients and 1,645 controls. Odds ratios were calculated based on the number of patients with no or one mutation. Generally, the presence of an increasing number of HCC-related mutations was associated with an increased risk of HCC (Figure 1). When the cumulative effects of HBV mutation were evaluated through stratified analysis according to mutation number with OR increased from 3.24 to 5.6, and patients with ≥ 5 mutations had a significantly increased HCC risk with OR of 18.45 (95% CI: 7.86–43.29, P < 10-5; Pheterogeneity = 0.51, I2 = 0%).
HBV mutations and LC risks
Liver cirrhosis is the strongest risk factor for HCC development. To better understand HBV mutants and the risk of LC, we performed an independent meta-analysis of 54 studies. Overall, 6 mutations (A1762T/G1764A double mutations, G1896A, G1899A, T1753V, C1653T and Pre-S mutation) were significantly associated with elevated LC risk with OR ranger from 1.76 to 4.10 (Table 4). In the stratified analysis by ethnicity, significant associations were also detected in almost all comparisons for these mutations (Supplementary Figure S3). However, no evidence of any association was obtained for C1858T. We found that association between A1762T/G1764A double mutations and risk for LC (OR = 4.10, 95% CI: 3.25-5.16) was stronger than that any other mutation (OR from 1.76 to 3.10). After Bonferroni correction, all significant associations for 6 mutations remained.
Table 4: Results of meta-analysis for hepatitis B virus mutations and LC risks
Mutations |
Overall and subgroups analyses |
No. of data sets |
OR (95% CI) |
P(Z) |
P(Q) |
I2 (%) |
|---|---|---|---|---|---|---|
A1762T/G1764A |
Total |
39 |
4.10 (3.25-5.16) |
<10-5 |
<10-5 |
59.2 |
East Asian |
32 |
4.21 (3.24-5.48) |
<10-5 |
<10-5 |
62.5 |
|
South Asian |
5 |
4.20 (2.36-7.49) |
<10-5 |
0.10 |
48.9 |
|
Others |
2 |
2.41 (1.14-5.11) |
0.02 |
0.33 |
0 |
|
G1896A |
Total |
35 |
1.76 (1.34-2.32) |
<10-4 |
<10-5 |
72.0 |
East Asian |
28 |
1.82 (1.34-2.46) |
<10-4 |
<10-5 |
73.5 |
|
South Asian |
5 |
1.69 (0.83-3.42) |
0.15 |
0.09 |
53.2 |
|
Others |
2 |
1.26 (0.15-10.66) |
0.83 |
0.006 |
86.7 |
|
G1899A |
Total |
11 |
2.85 (1.93-4.22) |
<10-5 |
0.17 |
29.3 |
East Asian |
9 |
2.77 (1.68-4.57) |
<10-4 |
0.11 |
38.6 |
|
T1753V |
Total |
20 |
3.10 (2.53-3.79) |
<10-5 |
0.51 |
0 |
East Asian |
16 |
3.01 (2.38-3.81) |
<10-5 |
0.36 |
8.1 |
|
South Asian |
3 |
3.96 (2.29-6.86) |
<10-5 |
0.99 |
0 |
|
C1653T |
Total |
10 |
2.57 (1.98-3.33) |
<10-5 |
0.76 |
0 |
East Asian |
9 |
2.54 (1.95-3.31) |
<10-5 |
0.60 |
0 |
|
C1858T |
Total |
6 |
1.29 (0.75-2.20) |
0.35 |
0.54 |
0 |
East Asian |
4 |
0.89 (0.45-1.75) |
0.73 |
0.78 |
0 |
|
Pre-S |
Total |
7 |
2.68 (1.94-3.72) |
<10-5 |
0.68 |
0 |
East Asian |
5 |
2.61 (1.71-3.97) |
<10-5 |
0.43 |
0 |
P(Z): Z test used to determine the significance of the overall OR
P(Q): Cochran’s chi-square Q statistic test used to assess the heterogeneity in subgroups
Heterogeneity exploration
Since significant heterogeneity were detected in the overall and subgroup analysis, we performed a panel of subgroup analyses on ethnicity, sample size, HBeAg status, and HBV genotype, but strong between-studies heterogeneity maintained in most comparisons (Table 1-4). As the formal test for heterogeneity may not be powerful enough, we further conducted meta-regression since there were grounds for considering the ethnicity, sample size, study design, mean age, sex distribution and study quality as covariates to identify potential source of heterogeneity. In meta-regression analysis, it was found that ethnic population, study quality and sample size was correlated with the magnitude of the effect (Supplementary Table S2). In addition, Galbraith plot analyses were used to assess the potential sources of heterogeneity for all included studies (Supplementary Figure S4 and S5).
Sensitivity analyses and publication bias
In sensitivity analyses, no individual studies had a large influence on the pooled the overall result for HCC (Supplementary Figure S6) and LC (Supplementary Figure S7), suggesting stability of the meta-analyses. Formal investigation using Begg’s test and Egger’s test indicated no publication bias in the meta-analyses for associations of HBV mutations with HCC, and LC development (P > 0.05 for all, Supplementary Table S3). The shapes of the funnel plot for these comparisons seemed symmetrical (Supplementary Figure S8 and S9).
DISCUSSION
On the basis of 118 studies including 30,900 cases of HBV infection, our meta-analysis showed that 10 viral genomic markers (Pre-S mutation, A1762T/G1764A double mutations, G1896A, G1899A, T1753V, C1653T, G1766A, A1762T, G1764A and T1768A) are significantly positively associated with risk of HCC and six of them were also risk factor for developing LC. These findings were consistent and did not differ appreciably by study population, study size, HBV genotype and HBeAg status.
When stratified by ethnicity, inconsistent association results were observed among Asians and non-Asian populations. Such results could be due to the limited number of studies among non-Asians, which had insufficient statistical power to detect a slight effect. On the other hand, differences in genetic backgrounds across ethnic groups may also attribute to these results. Moreover, the effect of HBV mutations on the risk of HCC may be more pronounced in the presence of specific environmental factors like aflatoxin B1 exposure [3] and prevalence of HBV [4].
Several studies have shown that mutations at the EnhII/BCP/Precore region were associated with decreased HBsAg expression, less-active liver disease, and a lower likelihood of developing HCC with genotype B than with genotype C [33–35]. Thus, we investigated the risks of HCC for HBV mutations stratified by by HBeAg status and genotype. The overall OR for G1899A, and T1753V were higher in the HBeAg-positive patients than in the HBeAg-negative patients. As a marker of infectivity and active virus replication, HBeAg expression and high viral load are associated with an increased risk of HCC [36, 37]. The precore protein is processed in the endoplasmic reticulum to produce secreted HBeAg, and sustained HBV replication often leads to chronic necroinflammatory hepatic diseases and hepatocarcinogenesis [36, 37]. HBV genotype C is often associated with the risks of HCC compared with genotype B [9, 38]. Stratified analysis by HBV genotype showed that HBV genotype C patients with certain mutations like G1899A, and Pre-S would be more susceptible in developing HCC; while higher risk for A1762T/G1764A mutations was found in those infected with genotype B. One possible reason for the difference is that different HBV genotypes may have distinct patterns of mutations that have been associated with the risk of HCC [31, 39]. Furthermore, it is hypothesized that HBV genotype-associated mutations might be selected by HBV– host immune selection [40].
If genetic susceptibility to HCC development is, in part, mediated through viral mutation(s), it is possible that accumulation of mutations is a risk marker for the development of HCC. Indeed, we observed that association between BCP A1762T/G1764A double mutations and risk for HCC (OR = 3.63) was stronger than any other single mutation. Further stratification analyses indicated that viral genome containing five or more mutations were sharply associated with HCC risk, with linearity in the accumulated dose–risk manner between mutation number and HCC. Our result suggests that the number of mutations on viral genome is more important for predicting the risk of HCC than any individual mutation. Jang et al. reported that the predictive performance of six or more mutations was comparable to that of AFP with 97.3% specificity and 94.3% positive predictive value [41].
The relationship between HBV viral mutations and HCC risk has been investigated extensively and several mutations are proven to shape clinical outcomes [31, 42]. However, whether viral mutant is associated with higher risk of LC has not been clearly addressed. Our study was the first meta-analysis to show that 6 HBV mutations (A1762T/G1764A double mutations, G1896A, G1899A, T1753V, C1653T and Pre-S mutation) was associated with LC development. Furthermore, we found that genotype C infection was associated with higher risk of LC than did genotype B. Such difference may be partly due to the high replication rate of genotype C than that of genotype B [33]. Those viral genomic markers could be integrated into the risk calculator for predicting cirrhosis development, especially in those with high viral loads [43].
Compared with the previous meta-analysis [44–47], the present study is much larger, with about three times as many subjects as the earlier studies. Based on the accumulation of published data, we investigated the 11 naturally occurring mutations and HCC development. In addition, we for the first time assessed the effect of various HBV mutations and LC risks. We also investigated the cumulative effects of HBV mutations on HCC development. Our results suggest accumulation of mutations in HBV genome is likely to have pathological significance and may be predictive for hepatocarcinogenesis. In addition, potential sources of heterogeneity across previous studies and the possibility of publication bias were also systematically explored.
Given the observational nature of included studies and considerable between-study heterogeneity, some limitations of this meta-analysis should be addressed. First, the inherent problem of unadjusted confounding from other risk factors may contribute to heterogeneity between studies. Second, most of the included studies have conducted on Asians, and studies of other Non-Asian ethnicities may have been underpowered to detect a small but real association. Future studies of different ethnic populations, especially Caucasian and African are needed to confirm our findings. Third, multiple strata analyses were conducted on based on a fraction of all available data to be pooled, failure to adjust for matching factors can introduce a selection bias and the results may be overinflated [48]. Finally, lack of individual-level data prevents us from making further analysis to identify potential source of heterogeneity. A potential source of heterogeneity in the overall analysis was the small-study effects, and chronic alcohol abuse, HBV genotype, viral activity, duration of infection may also contribute such heterogeneity.
In summary, our meta-analysis of 118 studies indicates that HBV mutation(s) may increase the risks of LC and HCC. Furthermore, our results suggested that the A1762T/G1764A, T1753V, C1653T, Pre-S mutations may serve as a useful molecular marker for predicting HCC development. Moreover, a combined examination of HBV mutations would be more precisely in predicting the clinical outcomes of liver disease, thus screening whom at high-risk of HCC to benefit from early diagnoses and interventions.
MATERIALS AND METHODS
Identification and eligibility of relevant studies
The present study was performed according to the guideline of PRISMA statement. To identify all studies that examined the association of HBV mutations with HCC and/or LC, a computer-based search was conducted in databases including PubMed, ISI Web of Knowledge, EMBASE, SCOPUS, Cochrane Library databases, CSPD (China Science Periodical Database) and CNKI (China National Knowledge Infrastructure) databases (last search update in Feb. 2016). No language restrictions were applied. Several individual search terms, as well as combinations, were used: “hepatitis B virus”, “HBV”, “chronic hepatitis B”, “mutation”, “liver cirrhosis”, and “hepatocellular carcinoma”. Reference lists of included studies and relevant reviews were also manually screened. The titles and abstracts were screened, clearly irrelevant articles were excluded and the remaining studies were further evaluated for information on the topic of interest.
The outcome of interest was histologically or pathologically confirmed LC and HCC. Eligible studies were selected according to the following inclusion criteria: (a) case–control or cohort studies to evaluate the association between HBV mutation(s) and advanced liver disease (LC, HCC); (b) original study containing independent data; (c) clinical diagnoses of HBV infection were in line with standard guidelines; (d) presented odds ratio (OR), relative risk (RR) or hazard ratio (HR) estimates with the 95% confidence interval (CI), or provided data for their calculation. Exclusion criteria were as follows: (a) lack of available data, (b) overlapping data, (c) case-only studies, and (d) reviews or editorials or comment. We excluded patients co-infected with HCV and/or HDV and studies with sample size less than 20 since very small studies may be vulnerable to selection bias. Study subjects with a history of antiviral therapy or alcohol-related liver diseases were also excluded. Where there were duplicate or overlapping publications from the same study group, the most complete results were included.
Quality assessment and data extraction
To assess study methodology, publications were evaluated and were given a quantitative quality score according to Newcastle – Ottawa Scale system [49]. In brief, the overall score evaluated several dimensions of the methodology, grouped into 4 main categories: scientific design, description of the methods, how well the data could be generalized, and the interpretation of data.
Data were extracted independently by two authors from each qualified study: the first author, published year, country, ethnicity, identification of cases and controls, HBV genotype, HBeAg statuses, mutation sites and genotype distribution, viral activity, duration of infection, ALT (alanine aminotransferase) level, AST (aspartate aminotransferase) level, Albumin level, bilirubin level, definition of control groups, age, sex, study design, sample size, clinical outcomes (CHB, AsC, LC, HCC), and genotyping methods. Studies that included participants from the same source but examined different mutation(s) in different paper(s) were included. Meanwhile, different case–control groups in one study were considered as independent studies. Differences in the data extraction reports were reconciled through group discussion.
Statistical analysis
The data from each mutation was divided into two groups: HCC cases vs. non-HCC controls and LC cases vs. HBV carriers. As for limited evidence, mutations with data no more than five studies were excluded for meta-analysis. The strength of the association between advanced outcomes of HBV infection and the HBV mutations was estimated using ORs, with the corresponding 95 % CIs. The random effects model using the DerSimonian and Laird method, which is usually more conservative, was employed to combine the individual effect size estimates to calculate pooled weighted ORs [50]. The significance of the overall OR was determined by the Z-test. To assess the credibility of genetic associations, we considered the Bonferroni correction for multiple mutations. Cochran’s chi-square-based Q statistic test and I2 (ranging from 0 to 100%) statistics was performed to evaluate possible heterogeneity caused by non-threshold effect, with P value < 0.05 and a I2 value ≥ 50% indicated significant heterogeneity [51, 52]. Ethnicity, sample size (No. cases ≥ 100 or, <100) and matching of age were pre-specified as characteristics for the assessment to identify potential source of heterogeneity. Ethnic group was defined as East Asians (i.e., Chinese, Taiwanese, Japanese, and Korean), South Asians (i.e., Indian, Filipinos, Thai, and Vietnamese), Caucasians (i.e., people of European origin), African, and other ethnic populations. In addition, stratified analysis based on HBV genotype and HBeAg statuses were also explored. In meta-regression analysis, study design, ethnicity, age, sex, study size, matching status were analysed as covariates. Furthermore, Galbraith plot was also used to determine the main sources of the heterogeneity. To assess the extent to which individual studies with extremely large effect sizes influenced the overall result, one-way sensitivity analysis was also conducted. The visual funnel plots, and Egger’s test as well as Begg–Mazemdar test, were used to assess potential publication bias [53, 54]. All P values are two-sided at the P = 0.05 level. Statistical analyses were carried out using the STATA software version 11.0 (Stata Corporation, College Station, TX, USA).
CONFLICTS OF INTEREST
All authors declare that they have no conflict of interests.
REFERENCES
1. Poland GA, Jacobson RM. Clinical practice: Prevention of hepatitis B with the hepatitis B vaccine. N Engl J Med. 2004; 351:2832–2838.
2. Chen DS. Fighting against viral hepatitis: lessons from Taiwan. Hepatology. 2011; 54:381–392.
3. Kao JH, Chen DS. Global control of hepatitis B virus infection. Lancet Infect Dis. 2002; 2:395–403.
4. Liaw YF, Chu CM. Hepatitis B virus infection. Lancet. 2009; 373:582–592.
5. Yu L, Cheng YJ, Cheng ML, Yao YM, Zhang Q, Zhao XK, Liu HJ, Hu YX, Mu M, Wang B, Yang GZ, Zhu LL, Zhang S. Quantitative assessment of common genetic variations in HLA-DP with hepatitis B virus infection, clearance and hepatocellular carcinoma development. Sci Rep. 2015; 5:14933.
6. Yang Y, Zhang D, Feng N, Chen G, Liu J, Chen G, Zhu Y. Increased intake of vegetables, but not fruit, reduces risk for hepatocellular carcinoma: a meta-analysis. Gastroenterology. 2014; 147:1031–1042.
7. Chen CJ, Chen DS. Interaction of hepatitis B virus, chemical carcinogen, and genetic susceptibility: multistage hepatocarcinogenesis with multifactorial etiology. Hepatology. 2002; 36:1046–1049.
8. Pujol FH, Navas MC, Hainaut P, Chemin I. Worldwide genetic diversity of HBV genotypes and risk of hepatocellular carcinoma. Cancer Lett. 2009; 286:80–88.
9. Yu MW, Yeh SH, Chen PJ, Liaw YF, Lin CL, Liu CJ, Shih WL, Kao JH, Chen DS, Chen CJ. Hepatitis B virus genotype and DNA level and hepatocellular carcinoma: a prospective study in men. J Natl Cancer Inst. 2005; 97:265–272.
10. Chan HL, Hui AY, Wong ML, Tse AM, Hung LC, Wong VW, Sung JJ. Genotype C hepatitis B virus infection is associated with an increased risk of hepatocellular carcinoma. Gut. 2004; 53:1494–1498.
11. Kao JH, Chen PJ, Lai MY, Chen DS. Hepatitis B genotypes correlate with clinical outcomes in patients with chronic hepatitis B. Gastroenterology. 2000; 118:554–559.
12. Kao JH, Wu NH, Chen PJ, Lai MY, Chen DS. Hepatitis B genotypes and the response to interferon therapy. J Hepatol. 2000; 33:998–1002.
13. Welschinger R, Kew MC, Viana R, Badri M. T1653 mutation in the enhancer II region of the hepatitis B virus genome in southern African Blacks with hepatocellular carcinoma. Eur J Gastroenterol Hepatol. 2010; 22:541–545.
14. Tong MJ, Blatt LM, Kao JH, Cheng JT, Corey WG. Basal core promoterT1762/A1764 and precore A1896 gene mutations in hepatitis B surface antigen-positive hepatocellular carcinoma: a comparison with chronic carriers. Liver Int. 2007; 27:1356–1363.
15. Park JH, Cho EW, Lee YJ, Shin SY, Kim KL. Determination of the protective effects of neutralizing anti-hepatitis B virus (HBV) immunoglobulins by epitope mapping with recombinant HBV surface antigen protein. Microbiol Immunol. 2000; 44:703–710.
16. Ferrari C, Cavalli A, Penna A, Valli A, Bertoletti A, Pedretti G, Pilli M, Vitali P, Neri TM, Giuberti T. Fine specificity of the human T-cell response to the hepatitis B virus preS1 antigen. Gastroenterology. 1992; 103:255–263.
17. Andrisani OM, Barnabas S. The transcriptional function of the hepatitis B virus X protein and its role in hepatocarcinogenesis (Review). Int J Oncol. 1999;15:373–379.
18. Yen TSB. Hepadnaviral X-protein: review of recent progress. J Biomed Sci. 1996; 3:20–30.
19. Gunther S, Fischer L, Pult I, Sterneck M, Will H. Naturally occurring variants of hepatitis B virus. Adv Virus Res. 1999; 52:125–137.
20. Hunt CM, McGill JM, Allen MI, Condreay LD. Clinical relevance of hepatitis B viral mutations. Hepatology. 2000; 31:1037–1044.
21. Tseng TC, Liu CJ, Yang HC, Chen CL, Yang WT, Tsai CS, Kuo SF, Verbree FC, Su TH, Wang CC, Liu CH, Chen PJ, Chen DS, Kao JH. Higher proportion of viral basal core promoter mutant increases the risk of liver cirrhosis in hepatitis B carriers. Gut. 2015; 64:292-302.
22. Muñoz A, Chen JG, Egner PA, Marshall ML, Johnson JL, Schneider MF, Lu JH, Zhu YR, Wang JB, Chen TY, Kensler TW, Groopman JD. Predictive power of hepatitis B 1762T/1764A mutations in plasma for hepatocellular carcinoma risk in Qidong, China. Carcinogenesis. 2011; 32: 860-865.
23. Yin J, Xie J, Liu S, Zhang H, Han L, Lu W, Shen Q, Xu G, Dong H, Shen J, Zhang J, Han J, Wang L, et al. Association between the various mutations in viral core promoter region to different stages of hepatitis B, ranging of asymptomatic carrier state to hepatocellular carcinoma. Am J Gastroenterol. 2011; 106: 81-92.
24. Sung FY, Jung CM, Wu CF, Lin CL, Liu CJ, Liaw YF, Tsai KS, Yu MW. Hepatitis B Virus Core Variants Modify Natural Course of Viral Infection and Hepatocellular Carcinoma Progression. Gastroenterology. 2009; 137: 1687-1697.
25. Yuen MF, Tanaka Y, Shinkai N, Poon RT, But DY, Fong DY, Fung J, Wong DK, Yuen JC, Mizokami M, Lai CL. Risk for hepatocellular carcinoma with respect to hepatitis B virus genotypes B/C, specific mutations of enhancer II/core promoter/precore regions and HBV DNA levels. Gut. 2008; 57: 98-102.
26. Fang ZL, Sabin CA, Dong BQ, Ge LY, Wei SC, Chen QY, Fang KX, Yang JY, Wang XY, Harrison TJ. HBV A1762T, G1764A mutations are a valuable biomarker for identifying a subset of male HBsAg carriers at extremely high risk of hepatocellular carcinoma: a prospective study. Am J Gastroenterol. 2008; 103: 2254-2262.
27. Qu LS, Liu TT, Jin F, Guo YM, Chen TY, Ni ZP, Shen XZ. Combined pre-S deletion and core promoter mutations related to hepatocellular carcinoma: A nested case-control study in China. Hepatol Res. 2011; 41: 54-63.
28. Omata M, Ehata T, Yokosuka O, Hosoda K, Ohto M. Mutations in the precore region of hepatitis B virus DNA in patients with fulminant and severe hepatitis. N Engl J Med. 1991; 324:1699–1704.
29. Fan YF, Lu CC, Chen WC, Yao WJ, Wang HC, Chang TT, Lei HY, Shiau AL, Su IJ. Prevalence and significance of hepatitis B virus (HBV) pre-S mutants in serum and liver at different replicative stages of chronic HBV infection. Hepatology. 2001; 33:277–286.
30. Günther S, Piwon N, Will H. Wild-type levels of pregenomic RNA and replication but reduced pre-C RNA and e-antigen synthesis of hepatitis B virus with C(1653) --> T, A(1762) --> T and G(1764) --> A mutations in the core promoter. J Gen Virol. 1998; 79:375–380.
31. Yang HI, Yeh SH, Chen PJ, Iloeje UH, Jen CL, Su J, Wang LY, Lu SN, You SL, Chen DS, Liaw YF, Chen CJ; REVEAL-HBV Study Group. Associations between hepatitis B virus genotype and mutants and the risk of hepatocellular carcinoma. J Natl Cancer Inst. 2008; 100:1134-1143.
32. Zhang Q, Yin J, Zhang Y, Deng Y, Ji X, Du Y, Pu R, Han Y, Zhao J, Han X, Zhang H, Cao G. HLA-DP polymorphisms affect the outcomes of chronic hepatitis B virus infections, possibly through interacting with viral mutations. J Virol. 2013; 87:12176-12186.
33. Orito E, Ichida T, Sakugawa H, Sata M, Horiike N, Hino K, Okita K, Okanoue T, Iino S, Tanaka E, Suzuki K, Watanabe H, Hige S, et al. Geographic distribution of hepatitis B virus (HBV) genotype in patients with chronic HBV infection in Japan. Hepatology. 2001; 34: 590–594.
34. Kay A, Zoulim F. Hepatitis B virus genetic variability and evolution. Virus Res. 2007; 127: 164–176.
35. Chu CJ, Hussain M, Lok AS. Hepatitis B virus genotype B is associated with earlier HBeAg seroconversion compared with hepatitis B virus genotype C. Gastroenterology. 2002; 122:1756–1762.
36. Yang HI, Lu SN, Liaw YF, You SL, Sun CA, Wang LY, Hsiao CK, Chen PJ, Chen DS, Chen CJ; Taiwan Community-Based Cancer Screening Project Group. Hepatitis B e antigen and the risk of hepatocellular carcinoma. N Engl J Med. 2002; 347:168–174.
37. Chen CJ, Yang HI, Su J, Jen CL, You SL, Lu SN, Huang GT, lloeje UH; REVEAL-HBV Study Group. Risk of hepatocellular carcinoma across a biological gradient of serum hepatitis B virus DNA level. JAMA. 2006; 295:65–73.
38. Chan HL, Tse CH, Mo F, Koh J, Wong VW, Wong GL, Lam Chan S, Yeo W, Sung JJ, Mok TS. High viral load and hepatitis B virus subgenotype ce are associated with increased risk of hepatocellular carcinoma. J Clin Oncol. 2008; 26:177-182.
39. Yuen MF, Tanaka Y, Shinkai N, Poon RT, But DY, Fong DY, Fung J, Wong DK, Yuen JC, Mizokami M, Lai CL. Risk for hepatocellular carcinoma with respect to hepatitis B virus genotypes B/C, specific mutations of enhancer II/core promoter/precore regions and HBV DNA levels. Gut. 2008; 57:98–102.
40. Yuen MF, Wong DK, Zheng BJ, Chan CC, Yuen JC, Wong BC, Lai CL. Difference in T helper responses during hepatitis flares in hepatitis B e antigen (HBeAg)-positive patients with genotypes B and C: implication for early HBeAg seroconversion. J Viral Hepat. 2007; 14:269–275.
41. Jang JW, Chun JY, Park YM, Shin SK, Yoo W, Kim SO, Hong SP. Mutational complex genotype of the hepatitis B virus X precore regions as a novel predictive marker for hepatocellular carcinoma. Cancer Sci. 2012; 103: 296–304.
42. Kao JH, Chen PJ, Lai MY, Chen DS. Basal core promoter mutations of hepatitis B virus increase the risk of hepatocellular carcinoma in hepatitis B carriers. Gastroenterology. 2003; 124:327–334.
43. Lee MH, Yang HI, Liu J, Batrla-Utermann R, Jen CL, Iloeje UH, Lu SN, You SL, Wang LY, Chen CJ; R.E.V.E.A.L.-HBV Study Group. Prediction models of long-term Cirrhosis and hepatocellular carcinoma risk in chronic hepatitis B patients: risk scores integrating host and virus profiles. Hepatology. 2013; 58:546–554.
44. Liu S, Zhang H, Gu C, Yin J, He Y, Xie J, Cao G. Associations between hepatitis B virus mutations and the risk of hepatocellular carcinoma: a meta-analysis. J Natl Cancer Inst. 2009; 101:1066–1082.
45. Yang Z, Zhuang L, Lu Y, Xu Q, Tang B, Chen X. Naturally occurring basal core promoter A1762T/G1764A dual mutations increase the risk of HBV-related hepatocellular carcinoma: a meta-analysis. Oncotarget. 2016; 7:12525–1236. doi: 10.18632/oncotarget.7123.
46. Liao Y, Hu X, Chen J, Cai B, Tang J, Ying B, Wang H, Wang L. Precore mutation of hepatitis B virus may contribute to hepatocellular carcinoma risk: evidence from an updated meta-analysis. PLoS One. 2012; 7:e38394.
47. Hu F, Bi S, Yan H, Shi Y, Sheng J. Associations between hepatitis B virus basal core promoter/pre-core region mutations and the risk of acute-on-chronic liver failure: a meta-analysis. Virol J. 2015; 12:87.
48. Miettinen OS. The “case-control” study: valid selection of subjects. J Chronic Dis. 1985; 38:543–548.
49. Stang A. Critical evaluation of the Newcastle-Ottawa scale for the assessment of the quality of nonrandomized studies in meta-analyses. Eur J Epidemiol. 2010; 25:603–605.
50. DerSimonian R, Laird N. Meta-analysis in clinical trials. Control Clin Trials. 1986; 7:177–188.
51. Cochran WG. The combination of estimates from different experiments. Biometrics. 1954; 10:101–129.
52. Higgins JP, Thompson SG. Quantifying heterogeneity in a meta-analysis. Stat Med. 2002; 21: 1539–1558.
53. Begg CB, Mazumdar M. Operating characteristics of a rank correlation test for publication bias. Biometrics. 1994; 50:1088–1101.
54. Egger M, Smith G Davey, Schneider M. Bias in meta-analysis detected by a simple, graphical test. BMJ. 1997; 315:629–634.