
INTRODUCTION
Colorectal cancer (CRC) is the third most commonly diagnosed cancer in males and the second in females in the worldwide [1]. In China, the incidence and mortality of CRC have rapidly increased in the past ten years, with an estimated 310,244 new cases and 149,722 deaths occurring in 2011 [2, 3]. In addition to environment factors like diet, obesity, physical inactivity, cigarette smoking and alcohol consumption [4, 5], genetics has been well established as an important factor in CRC etiology [6–8]. Large-scale genome-wide association studies (GWASs) and following researches have identified numerous CRC-associated single nucleotide polymorphisms (SNPs) in over 30 chromosome loci [9–23]. However, most risk variants are located in non-coding regions without clear biological mechanisms [24], and the functional and causal SNPs remain to be mined.
At the same time, it has been proved that the identification of functional SNPs could be facilitated with the application of regulatory elements predicted by chromatin status like histone modifications [25–28]. For example, using their own chromatin immunoprecipitation-sequencing (ChIP-seq) data of histone modifications and other data from Encyclopedia of DNA Elements (ENCODE), Biancolella et al. identified rs10891246 and rs7130173 as functional SNPs mapping to CRC GWAS locus 11q23.1. They also indicated C11orf53, C11orf92 and C11orf93 as novel candidate genes for CRC risk [29].
Chromosome 5q31.1 was discovered and replicated as a CRC susceptibility locus by Jia et al. [20] and Zhang et al. [23], and the reported strongest risk SNPs rs647161 is of unclear function. To refine this region, we searched potentially functional SNPs in regulatory elements indicated by CRC-specific histone modifications. And we found rs17716310 confer significantly and marginally increase risk for CRC in a Chinese population [30]. Here we continued the previous study with another independent Chinese population including 1075 cases and 1999 controls, and a Combined Study including 1766 cases and 2708 controls. Furthermore, we verified the functionality of rs17716310 by the dual luciferase reporter gene assays and the analyses of TCGA (The Cancer Genome Atlas) data.
RESULTS
Population characteristics
Characteristics of the study subjects were summarized in the Table 1. 1075 incident cases and 1999 controls were enrolled in the present validation study. Combing the samples of the discovery stage [30], 1766 cases and 2708 controls were included in the combined study. In both stages, cases and controls are adequately matched in terms of gender and age (P > 0.05). Significantly more smokers were found among the cases than controls in either stage (Present Study: 40.6% versus 34.5%, P = 0.001; Combined Study: 38.4% versus 33.2%, P = 4.308E-04). According to the calculations adjusted by sex and age, smokers in our study owned a higher risk for CRC than non-smokers (Present Study: OR = 1.385, 95% CI = 1.154–1.661; Combined Study: OR = 1.332, 95% CI = 1.147–1.546).
Table 1: The characteristics of the study population
|
Present Study |
Combined Study |
||||||
|---|---|---|---|---|---|---|---|---|
|
Case (%) |
Control (%) |
χ2 |
P |
Case (%) |
Control (%) |
χ2 |
P |
Total |
1075 |
1999 |
|
|
1766 |
2708 |
|
|
Gender |
|
|
0.707 |
0.400a |
|
|
0.892 |
0.345a |
Male |
646 (60.1) |
1170 (58.5) |
|
|
1049 (59.4) |
1570 (58.0) |
|
|
Female |
429 (39.9) |
829 (41.5) |
|
|
717 (40.6) |
1138 (42.0) |
|
|
Age (mean ± SD) |
60.51 ± 12.82 |
61.07 ± 11.97 |
|
0.232b |
60.36 ± 12.62 |
60.79 ± 12.30 |
|
0.254b |
Agegroup |
|
|
3.959 |
0.266a |
|
|
0.718 |
0.869a |
≤ 50 |
237 (22.1) |
460 (23.0) |
|
|
386 (21.9) |
614 (22.7) |
|
|
51–60 |
281 (26.1) |
574 (28.7) |
|
|
487 (27.6) |
755 (27.9) |
|
|
61–70 |
293 (27.3) |
494 (24.7) |
|
|
475 (26.9) |
703 (26.0) |
|
|
≥ 71 |
263 (24.5) |
471 (23.6) |
|
|
417 (23.6) |
636 (23.5) |
|
|
Smoking Status |
|
|
10.990 |
0.001a |
|
|
12.723 |
4.308E–04a |
Non-Smoker |
639 (59.4) |
1309 (65.5) |
|
|
1087 (61.6) |
1808 (66.8) |
|
|
Smoker |
436 (40.6) |
690 (34.5) |
|
|
679 (38.4) |
900 (33.2) |
|
|
Abbreviations: SD, standard deviation.
aP value was calculated by chi-square test.
bP value was calculated by the t test.
The nominal significant results were in bold.
Association analysis
Shown in Table 2, rs17716310 was evidently associated with CRC risk in the present validation study and in the combined study.
Table 2: Association between individual SNP and colorectal cancer risk
|
Present Study |
Combined Study |
||||||
|---|---|---|---|---|---|---|---|---|
|
Cases (%) |
Controls (%) |
OR (95% CI)a |
Pa |
Cases (%) |
Control (%)s |
OR (95% CI)a |
Pa |
rs17716310 |
|
|
|
|
|
|
|
|
AA |
481 (45.2) |
951 (48.1) |
1.000 |
|
775 (44.4) |
1289 (48.2) |
1.000 |
|
AC |
454 (42.7) |
842 (42.6) |
1.071 (0.914–1.256) |
0.397 |
768 (44.0) |
1126 (42.1) |
1.144 (1.006–1.300) |
0.041 |
CC |
129 (12.1) |
183 (9.3) |
1.420 (1.104–1.827) |
0.006 |
203 (11.6) |
259 (9.7) |
1.313 (1.070–1.612) |
0.009 |
Dominant |
|
|
1.133 (0.975–1.316) |
0.104 |
|
|
1.175 (1.041–1.327) |
0.009 |
Recessive |
|
|
1.374 (1.081–1.747) |
0.009 |
|
|
1.231 (1.012–1.496) |
0.037 |
Additive |
|
|
1.149 (1.027–1.286) |
0.016 |
|
|
1.145 (1.045–1.254) |
0.004 |
Abbreviations: OR, Odds ratio; 95% CI, 95% confidence interval.
aData were calculated by logistic regression model after adjusting for sex, age group and smoking status.
The nominal significant results were in bold.
Under multivariable logistic regression model adjusted for gender, age group and smoking status, individuals with CC genotype of rs17716310 had a significantly increased risk of CRC compared to those with AA homozygote (homozygous model: OR = 1.420, 95% CI = 1.104–1.827, P = 0.006), and to those with AA and AC (recessive model: OR = 1.374, 95% CI = 1.081–1.747, P = 0.009). Likewise, positive outcome was found in the additive models, with per-A-allele OR of 1.149 (95% CI = 1.027–1.286, P = 0.016).
To expand sample size and improve statistical power, we combined our previously published data [30] with aforementioned data into a pooled analysis (Combined Study). Significant associations were exhibited between rs17716310 and CRC risk in all genetic models we investigated (Heterozygous model: OR = 1.144, 95% CI = 1.006–1.300, P= 0.041; Homozygous model: OR = 1.313, 95% CI = 1.070–1.613, P = 0.009; Dominant model: OR = 1.175, 95% CI = 1.041–1.327, P = 0.009; Recessive model: OR = 1.231, 95% CI = 1.012–1.496, P = 0.037; Additive model: OR = 1.145, 95% CI = 1.046–1.254, P = 0.004). The results of stratified analyses by gender and median age were presented in Table S1.
Table 3 detailed the results of interaction analysis between rs17716310 and smoke in Combined Study, where we observed a significant interaction in multiplicative terms (Pmult = 0.003), but not in additive terms (Padd = 0.509). Individuals carrying rs17716310 variant genotypes showed an association with the risk of CRC, especially for smokers.
Table 3: Interaction analysis between smoking and rs17716310 associated with CRC risk in combined study
Smoking Status |
Genotype |
Case/Control |
OR (95% CI)a |
Pmulta |
Padd |
|---|---|---|---|---|---|
Non-smoker |
AA |
470/856 |
1.000 |
0.003 |
0.509 |
|
AC + CC |
601/925 |
1.186 (1.019–1.382) |
|
|
Smoker |
AA |
304/432 |
1.363 (1.114–1.669) |
|
|
|
AC + CC |
369/460 |
1.560 (1.281–1.898) |
|
|
Pmult was calculated using the multiplicative interaction term.
Padd was calculated using the additive interaction model.
aData were calculated by logistic regression model after adjusting for gender and age group.
The nominal significant results were in bold.
Dual luciferase reporter gene assay
We generated two luciferase reporter plasmids containing rs17716310 A and C allele, respectively, and used pRL-SV40 plasmids as normalized controls. In either CRC cell line HCT116 or LoVo, luciferase expression was significantly higher in the mutant C allelic construct compared with the major A construct in both forward and reverse sequence directions (P < 0.01, Figure 1). It showed that rs17716310 A > C could upregulate gene expression by increasing the transcriptional activity.
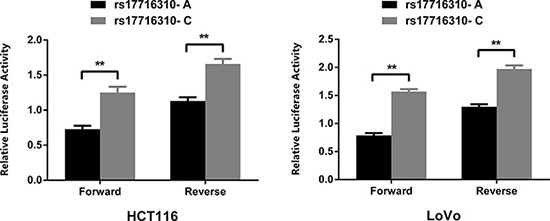
Figure 1: Reporter gene assays with two constructs containing major and minor alleles of rs17716310 in HCT116 and LoVo. Both constructs were cotransfected with pRL-SV40 to standardize transfection efficiency. Luciferase levels of pGL3-promoter and pRL-SV40 were determined in triplicate. Data shown are the from three independent transfection experiments, each performed in triplicate. The rs17716310 C-containing enhancer drove significantly higher reporter gene expression than the rs17716310 A-containing fragment in both CRC cell lines (**P < 0.01).
eQTL analyses
Applying the multi-level TCGA datasets for COAD and READ, we performed an adjusted eQTL-analysis of the association between rs17716310 and expression of 23 genes in flanking 1Mb region. Shown in Table 4 and Figure 2, rs17716310 was identified as a cis-eQTL for the gene SMAD5 (mothers against decapentaplegic homolog 5, P < 0.05), and its C allele was correlated with higher SMAD5 expression. In addition, we compared SMAD5 expression between 347 cancer and 50 adjacent normal tissues, and found significantly greater expression in CRC samples (P = 6.56 × 10⁻⁷, CRC tissue: 1323 ± 423 RPKM (reads per kilobases per million reads), peritumor tissue: 1020 ± 294 RPKM). When the expression of SMAD5 was compared between 32 CRC tissues and paired peritumor tissues, obviously higher expression was still observed in cancerous tissues (P = 0.002, CRC tissue: 1421 ± 376 RPKM, paired peritumor tissue: 1109 ± 312 RPKM).
Table 4: Expression correlation between rs17716310 and flanking 1 Mb genes
Gene |
Correlation P |
Correlation R2 |
|---|---|---|
SMAD5 |
4.997E–02 |
1.516E–02 |
SAR1B |
1.311E–01 |
9.020E–03 |
UBE2B |
1.371E–01 |
8.749E–03 |
DDX46 |
1.426E–01 |
8.510E–03 |
C5orf24 |
1.694E–01 |
7.478E–03 |
CAMLG |
2.307E–01 |
5.695E–03 |
LECT2 |
3.019E–01 |
4.229E–03 |
PCBD2 |
3.151E–01 |
4.004E–03 |
CATSPER3 |
3.281E–01 |
3.796E–03 |
TXNDC15 |
4.023E–01 |
2.786E–03 |
TGFBI |
4.380E–01 |
2.388E–03 |
PPP2CA |
4.524E–01 |
2.242E–03 |
SEC24A |
5.204E–01 |
1.641E–03 |
PHF15 |
5.212E–01 |
1.635E–03 |
H2AFY |
5.324E–01 |
1.549E–03 |
CXCL14 |
6.699E–01 |
7.222E–04 |
C5orf20 |
8.198E–01 |
2.064E–04 |
PITX1 |
8.438E–01 |
1.543E–04 |
CDKL3 |
8.716E–01 |
1.039E–04 |
CDKN2AIPNL |
8.742E–01 |
9.965E–05 |
TCF7 |
9.262E–01 |
3.409E–05 |
TIFAB |
9.610E–01 |
9.483E–06 |
SKP1 |
9.949E–01 |
1.604E–07 |
The nominal significant results were in bold.
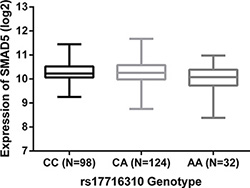
Figure 2: Expression correlation between rs17716310 and SMAD5. The C allele of rs17716310 was correlated with higher SMAD5 expression under an adjusted linear regression model (P < 0.05). The values (average ± SD) of expression level (log2) were 10.29 ± 0.42 for CC, 10.28 ± 0.46 for CA and 10.06 ± 0.54 for AA.
DISCUSSION
In post-GWAS era, the major challenge is to identify specific functional genetic variants that actually account for phenotypes and diseases [31]. With the analysis of ChIP-seq data of histone modifications, we previously screened out a potentially regulatory SNP rs17716310 associated with CRC risk. In current study, we verified rs17716310 as a functional variant of the chromosome 5q31.1. It showed that the minor C allele of rs17716310 conferred increased risk of CRC, improved transcriptional activity, and was associated with higher SMAD5 expression in CRC tissue.
The findings led us to purpose that rs17716310 might influence CRC risk by altering the activity of an enhancer that control SMAD5 expression. Lying within a region of the genome exhibiting H3k4me1 and H3k27ac, rs17716310 is highly suggested to locate in an active enhancer [30, 32, 33]. It is approximately 1Mb upstream of the gene SMAD5, which acts as an intracellular mediators that transduces signals of BMPs (bone morphogenetic proteins) belonging to TGF-β (transforming growth factor beta) superfamily [34–36]. It was reported that the Smad 1/5/8 signaling pathway could be activated by microRNA-1246, which was secreted from colorectal cancer cell-derived microvesicles, and thus be involved in the promotion of angiogenesis [37]. Recently, the inflammatory factor S100A8 was found to activate the Akt1-Smad5-Id3 axis, which promoted the proliferation, invasion and metastasis of colon cancer cells [38]. Moreover, the participation of TGF-β in colorectal tumorigenesis has been well recognized. The TGF-β signaling alterations mediated by variants of TGF-β receptors or SMADs contributed to colon cancer development and progression [39, 40]. On the other side, in a online database HaploReg [41], rs17716310 was indicated to change the binding motif of p300 that functions as a transcriptional coactivator and histone acetyltransferase regulating gene expression by remodeling chromatin [42]. Taken all together, the variant might improve the binding of some transcription factor(s) like p300, and stimulate the interaction between this active enhancer and the SMAD5 promoter. It thereby activates the transcription of the effector SMAD5, and then strengthens the transduction of TGF-β signaling pathway that promotes the survival, invasion and metastasis of colorectal cancer cells [39].
As for the interaction with smoking found in multiplicative model, it might be due to the relations between cigarette smoke and the TGF-β pathway [43, 44] involving SMAD5. So, it is biologically plausible that rs17716310 could cooperate with smoking to increase CRC risk.
However, there are several limitations in this report. First of all, more functional experiments, such as electrophoretic mobility shift assays (EMSA) and real-time quantitative polymerase chain reactions (qPCR) were needed to verify our assumptions about the biological mechanism. Second, we did not study the association between the identified variant rs17716310 and metastasis or survival, because of the lack of clinical and prognostic information. Third, insufficient demographic and environmental data restricted us to adjust other influencing factors like diet, obesity, physical activity and drinking status in our statistical analyses.
In conclusion, integrating bioinformatics analysis, large-sample-size population association study and functional experiments, we highlighted a functional SNP rs17716310 for colorectal cancer risk mapping to chromosome 5q31.1. Systematic researches on more susceptibility loci are warranted to identify causal variants and elaborate the genetic etiology of CRC.
MATERIALS AND METHODS
Study participants
The present validation study included 1075 cases and 1999 controls, which were enrolled from 2011 to 2015 at the Tongji Hospital of Huazhong University of Science and Technology (HUST). All subjects were unrelated ethnic Han Chinese. The inclusion criteria for patients were histopathologically confirmed CRC without previous chemotherapy or radiotherapy. Cancer-free controls came from health check-up programs at the same hospital during the same time, which were matched to cases by gender and age (± 5 years). 1 ml peripheral blood was collected from each subject after a written informed consent was obtained, and demographic information including sex, age and smoking status were collected by interviewers. Herein, definitions of smoking status were the same as a previous study of our group [45]. And the population characteristics of discovery study were detailed in our previous report [30]. This study was conducted under the approval from the Institutional Review Board of Tongji Medical College of Huazhong University of Science and Technology.
Genotyping
DNA was extracted from peripheral blood leukocytes with RelaxGene Blood System DP319-02 (Tiangen, Beijing, China). Candidate SNP was genotyped by the TaqMan SNP Genotyping Assay on an ABI PRISM 7900HT Fast Real-Time PCR platform (Applied Biosystems, Foster City, CA, USA). Quality control was preformed by including 5% duplicate samples in blinded fashion, with a concordance rate of 100%.
Construction of reporter plasmids, transient transfections and luciferase assay
The 2001 bp DNA fragments, which were 1 kb upstream and downstream flanking A and C allele of rs17716310 (chr5: 134475759-134477759), were synthesized and cloned into Kpnl and Xhol restrictive sites of the pGL3-promoter vector (Promega) in both forward and reverse directions (Genewiz). The constructed plasmids were sequenced to verify the accuracy. HCT-116 and LoVo cells (1.25 × 10⁴ cells/well) were seeded into 96-well plates. Cells were co-transfected with 100 ng constructed vector (with the A allele or C allele) and 1ng pRL-SV40 Renilla luciferase plasmid (Promega) using Lipofectamine 3000 Reagent (Life Technologies) according to the manufacturer’s instructions. After 24 hours, Firefly and Renilla luciferase activities were determined with the Dual-Luciferase Reporter Assay System (Promega). As the relative luciferase activity, the ratio of Firefly to Renilla luciferase activities was calculated for each sample. Three independent transfection experiments were carried out, and each experiment was conducted in triplicate. The data was presented as mean ± SD (standard deviation) and two-sided P-values were calculated using the Student’s t-test.
eQTL analyses
From the TCGA portal (http://cancergenome.nih.gov/) up to October 2014, we downloaded the data of gene expression, CpG methylation, somatic copy number and germline genotypes for COAD (colon adenocarcinoma) and READ (rectum adenocarcinoma). The correlations between the SNP and expression of genes within 1 Mb flanking regions was evaluated under a linear regression model with the effects of CpG methylation and somatic copy numbers being adjusted, according to the algorithms reported by Li et al. [46]. And the gene expression levels between CRC and peri-tumorous normal tissues were compared by independent-sample and paired-sample t-test.
Statistical analysis
The differences in the distributions of demographic variables and genotype frequencies between cases and controls were estimated by χ2 test or t-test, where appropriate. Hardy-Weinberg equilibrium (HWE) of genotypes was evaluated in controls by a goodness-of-fit χ2 test. Odds ratios (ORs) and corresponding 95% confidence intervals (95% CIs) were calculated by unconditional multivariable logistic regression, with gender, age group and smoking status adjusted as categorical covariables. The potential gene-environment interaction was evaluated by a pair-wise analysis under multiplicative [47] and additive interaction models [48]. All statistical analyses, including the calculation of P values for multiplicative interaction under the multivariable logistic regression model, were performed with SPSS Software v20.0 (SPSS, Chicago, Illinois, USA), except the P values for additive interaction that were assessed by a bootstrapping test of goodness-of-fit using Stata v11.0 (Stata Corporation, College Station, TX). P values were two sided with the statistical significance criteria of P < 0.05 all through the study.
ACKNOWLEDGMENTS
The authors wish to thank all the study participants, research staff and students who participated in this work. We thank the TCGA Project for making the data public.
CONFLICTS OF INTEREST
The authors declare no competing financial interest.
GRANT SUPPORT
This work was supported by National Program for Support of Top-notch Young Professionals, National Natural Science Foundation of China NSFC-81001275, 81171878, 81222038, 81402744 and 81502875; the Fok Ying Tung Foundation for Young Teachers in the Higher Education Institutions of China-131038; Natural Science Foundation of Hubei-2012FFA011 to X.M. and Special Financial Grant from the China Postdoctoral Science Foundation (2015T80806) to J.G.
REFERENCES
1. Torre LA, Bray F, Siegel RL, Ferlay J, Lortet-Tieulent J, Jemal A. Global cancer statistics, 2012. CA Cancer J Clin. 2015; 65:87–108.
2. Chen W, Zheng R, Zeng H, Zhang S, He J. Annual report on status of cancer in China, 2011. Chin J Cancer Res. 2015; 27:2–12.
3. Dai Z, Zheng RS, Zou XN, Zhang SW, Zeng HM, Li N, Chen WQ. [Analysis and prediction of colorectal cancer incidence trend in China]. [Article in Chinese]. Zhonghua Yu Fang Yi Xue Za Zhi. 2012; 46:598–603.
4. Haggar F, Boushey R. Colorectal Cancer Epidemiology: Incidence, Mortality, Survival, and Risk Factors. Clinics in Colon and Rectal Surgery. 2009; 22:191–197.
5. Zhu B, Zou L, Qi L, Zhong R, Miao X. Allium Vegetables and Garlic Supplements Do Not Reduce Risk of Colorectal Cancer, Based on Meta-analysis of Prospective Studies. Clinical Gastroenterology and Hepatology. 2014; 12:1991–2001.e1994.
6. De la Chapelle A. Genetic predisposition to colorectal cancer. Nat Rev Cancer. 2004; 4:769–780.
7. Lichtenstein P, Holm NV, Verkasalo PK, Iliadou A, Kaprio J, Koskenvuo M, Pukkala E, Skytthe A, Hemminki K. Environmental and heritable factors in the causation of cancer—analyses of cohorts of twins from Sweden, Denmark, and Finland. N Engl J Med. 2000; 343:78–85.
8. Gong J, Tian J, Lou J, Ke J, Li L, Li J, Yang Y, Gong Y, Zhu Y, Zhang Y, Zhong R, Chang J, Miao X. A functional polymorphism in lnc-LAMC2-1:1 confers risk of colorectal cancer by affecting miRNA binding. Carcinogenesis. 2016; 37:443–51.
9. Zanke BW, Greenwood CM, Rangrej J, Kustra R, Tenesa A, Farrington SM, Prendergast J, Olschwang S, Chiang T, Crowdy E, Ferretti V, Laflamme P, Sundararajan S, et al. Genome-wide association scan identifies a colorectal cancer susceptibility locus on chromosome 8q24. Nat Genet. 2007; 39:989–994.
10. Tomlinson I, Webb E, Carvajal-Carmona L, Broderick P, Kemp Z, Spain S, Penegar S, Chandler I, Gorman M, Wood W, Barclay E, Lubbe S, Martin L, et al. A genome-wide association scan of tag SNPs identifies a susceptibility variant for colorectal cancer at 8q24.21. Nat Genet. 2007; 39:984–988.
11. Broderick P, Carvajal-Carmona L, Pittman AM, Webb E, Howarth K, Rowan A, Lubbe S, Spain S, Sullivan K, Fielding S, Jaeger E, Vijayakrishnan J, Kemp Z, et al. A genome-wide association study shows that common alleles of SMAD7 influence colorectal cancer risk. Nat Genet. 2007; 39:1315–1317.
12. Jaeger E, Webb E, Howarth K, Carvajal-Carmona L, Rowan A, Broderick P, Walther A, Spain S, Pittman A, Kemp Z, Sullivan K, Heinimann K, Lubbe S, et al. Common genetic variants at the CRAC1 (HMPS) locus on chromosome 15q13.3 influence colorectal cancer risk. Nat Genet. 2008; 40:26–28.
13. Tenesa A, Farrington SM, Prendergast JG, Porteous ME, Walker M, Haq N, Barnetson RA, Theodoratou E, Cetnarskyj R, Cartwright N, Semple C, Clark AJ, Reid FJ, et al. Genome-wide association scan identifies a colorectal cancer susceptibility locus on 11q23 and replicates risk loci at 8q24 and 18q21. Nat Genet. 2008; 40:631–637.
14. Tomlinson IP, Webb E, Carvajal-Carmona L, Broderick P, Howarth K, Pittman AM, Spain S, Lubbe S, Walther A, Sullivan K, Jaeger E, Fielding S, Rowan A, et al. A genome-wide association study identifies colorectal cancer susceptibility loci on chromosomes 10p14 and 8q23.3. Nat Genet. 2008; 40:623–630.
15. Houlston RS, Webb E, Broderick P, Pittman AM, Di Bernardo MC, Lubbe S, Chandler I, Vijayakrishnan J, Sullivan K, Penegar S, Carvajal-Carmona L, Howarth K, Jaeger E, et al. Meta-analysis of genome-wide association data identifies four new susceptibility loci for colorectal cancer. Nat Genet. 2008; 40:1426–1435.
16. Houlston RS, Cheadle J, Dobbins SE, Tenesa A, Jones AM, Howarth K, Spain SL, Broderick P, Domingo E, Farrington S, Prendergast JG, Pittman AM, Theodoratou E, et al. Meta-analysis of three genome-wide association studies identifies susceptibility loci for colorectal cancer at 1q41, 3q26.2, 12q13.13 and 20q13.33. Nat Genet. 2010; 42:973–977.
17. Tomlinson IP, Carvajal-Carmona LG, Dobbins SE, Tenesa A, Jones AM, Howarth K, Palles C, Broderick P, Jaeger EE, Farrington S, Lewis A, Prendergast JG, Pittman AM, et al. Multiple common susceptibility variants near BMP pathway loci GREM1, BMP4, and BMP2 explain part of the missing heritability of colorectal cancer. PLoS Genet. 2011; 7:e1002105.
18. Dunlop MG, Dobbins SE, Farrington SM, Jones AM, Palles C, Whiffin N, Tenesa A, Spain S, Broderick P, Ooi LY, Domingo E, Smillie C, Henrion M, et al. Common variation near CDKN1A, POLD3 and SHROOM2 influences colorectal cancer risk. Nat Genet. 2012; 44:770–776.
19. Peters U, Jiao S, Schumacher FR, Hutter CM, Aragaki AK, Baron JA, Berndt SI, Bezieau S, Brenner H, Butterbach K, Caan BJ, Campbell PT, Carlson CS, et al. Identification of Genetic Susceptibility Loci for Colorectal Tumors in a Genome-Wide Meta-analysis. Gastroenterology. 2013; 144:799–807.
20. Jia WH, Zhang B, Matsuo K, Shin A, Xiang YB, Jee SH, Kim DH, Ren Z, Cai Q, Long J, Shi J, Wen W, Yang G, et al. Genome-wide association analyses in East Asians identify new susceptibility loci for colorectal cancer. Nat Genet. 2013; 45:191–196.
21. Zhang B, Jia WH, Matsuo K, Shin A, Xiang YB, Matsuda K, Jee SH, Kim DH, Cheah PY, Ren Z, Cai Q, Long J, Shi J, et al. Genome-wide association study identifies a new SMAD7 risk variant associated with colorectal cancer risk in East Asians. Int J Cancer. 2014; 135:948–955.
22. Cui R, Okada Y, Jang SG, Ku JL, Park JG, Kamatani Y, Hosono N, Tsunoda T, Kumar V, Tanikawa C, Kamatani N, Yamada R, Kubo M, et al. Common variant in 6q26-q27 is associated with distal colon cancer in an Asian population. Gut. 2011; 60:799–805.
23. Zhang B, Jia WH, Matsuda K, Kweon SS, Matsuo K, Xiang YB, Shin A, Jee SH, Kim DH, Cai Q, Long J, Shi J, Wen W, et al. Large-scale genetic study in East Asians identifies six new loci associated with colorectal cancer risk. Nat Genet. 2014; 46:533–542.
24. Welter D, MacArthur J, Morales J, Burdett T, Hall P, Junkins H, Klemm A, Flicek P, Manolio T, Hindorff L, Parkinson H. The NHGRI GWAS Catalog, a curated resource of SNP-trait associations. Nucleic Acids Res. 2014; 42:D1001–1006.
25. Hardison RC. Genome-wide epigenetic data facilitate understanding of disease susceptibility association studies. J Biol Chem. 2012; 287:30932–30940.
26. Maurano MT, Humbert R, Rynes E, Thurman RE, Haugen E, Wang H, Reynolds AP, Sandstrom R, Qu H, Brody J, Shafer A, Neri F, Lee K, et al. Systematic localization of common disease-associated variation in regulatory DNA. Science. 2012; 337:1190–1195.
27. Farnham PJ. Thematic minireview series on results from the ENCODE Project: Integrative global analyses of regulatory regions in the human genome. J Biol Chem. 2012; 287:30885–30887.
28. Yao L, Tak YG, Berman BP, Farnham PJ. Functional annotation of colon cancer risk SNPs. Nat Commun. 2014; 5:5114.
29. Biancolella M, Fortini BK, Tring S, Plummer SJ, Mendoza-Fandino GA, Hartiala J, Hitchler MJ, Yan C, Schumacher FR, Conti DV, Edlund CK, Noushmehr H, Coetzee SG, et al. Identification and characterization of functional risk variants for colorectal cancer mapping to chromosome 11q23.1. Hum Mol Genet. 2014; 23:2198–2209.
30. Ke J, Lou J, Chen X, Li J, Liu C, Gong Y, Yang Y, Zhu Y, Zhang Y, Gong J. Identification of a Potential Regulatory Variant for Colorectal Cancer Risk Mapping to Chromosome 5q31.1: A Post-GWAS Study. Plos One. 2015; 10:e0138478.
31. Zhang X, Bailey SD, Lupien M. Laying a solid foundation for Manhattan—'setting the functional basis for the post-GWAS era'. Trends Genet. 2014; 30:140–149.
32. Pasquali L, Gaulton KJ, Rodriguez-Segui SA, Mularoni L, Miguel-Escalada I, Akerman I, Tena JJ, Moran I, Gomez-Marin C, van de Bunt M, Ponsa-Cobas J, Castro N, Nammo T, et al. Pancreatic islet enhancer clusters enriched in type 2 diabetes risk-associated variants. Nat Genet. 2014; 46:136–143.
33. Creyghton MP, Cheng AW, Welstead GG, Kooistra T, Carey BW, Steine EJ, Hanna J, Lodato MA, Frampton GM, Sharp PA, Boyer LA, Young RA, Jaenisch R. Histone H3K27ac separates active from poised enhancers and predicts developmental state. Proceedings of the National Academy of Sciences. 2010; 107:21931–21936.
34. Massagué J. TGFβ in Cancer. Cell. 2008; 134:215–230.
35. Nohe A. Signal transduction of bone morphogenetic protein receptors. Cellular Signalling. 2004; 16:291–299.
36. Weiss A, Attisano L. The TGFbeta Superfamily Signaling Pathway. Wiley Interdisciplinary Reviews: Developmental Biology. 2013; 2:47–63.
37. Yamada N, Tsujimura N, Kumazaki M, Shinohara H, Taniguchi K, Nakagawa Y, Naoe T, Akao Y. Colorectal cancer cell-derived microvesicles containing microRNA-1246 promote angiogenesis by activating Smad 1/5/8 signaling elicited by PML down-regulation in endothelial cells. Biochim Biophys Acta. 2014; 1839:1256–1272.
38. Zhang X, Ai F, Li X, She X, Li N, Tang A, Qin Z, Ye Q, Tian L, Li G, Shen S, Ma J. Inflammation-induced S100A8 activates Id3 and promotes colorectal tumorigenesis. Int J Cancer. 2015; 137:2803–2814.
39. Xu Y, Pasche B. TGF-beta signaling alterations and susceptibility to colorectal cancer. Hum Mol Genet. 2007; 16:R14–20.
40. Bellam N, Pasche B. Tgf-beta signaling alterations and colon cancer. Cancer Treat Res. 2010; 155:85–103.
41. Ward LD, Kellis M. HaploReg: a resource for exploring chromatin states, conservation, and regulatory motif alterations within sets of genetically linked variants. Nucleic Acids Research. 2011; 40:D930–D934.
42. Liu X, Wang L, Zhao K, Thompson PR, Hwang Y, Marmorstein R, Cole PA. The structural basis of protein acetylation by the p300/CBP transcriptional coactivator. Nature. 2008; 451:846–850.
43. Marwick JA, Kirkham P, Gilmour PS, Donaldson K, Mac NW, Rahman I. Cigarette smoke-induced oxidative stress and TGF-beta1 increase p21waf1/cip1 expression in alveolar epithelial cells. Ann N Y Acad Sci. 2002; 973:278–283.
44. Sarir H, Mortaz E, Karimi K, Kraneveld AD, Rahman I, Caldenhoven E, Nijkamp FP, Folkerts G. Cigarette smoke regulates the expression of TLR4 and IL-8 production by human macrophages. J Inflamm (Lond). 2009; 6:12.
45. Zhong R, Liu L, Zou L, Sheng W, Zhu B, Xiang H, Chen W, Chen J, Rui R, Zheng X, Yin J, Duan S, Yang B, et al. Genetic variations in the TGFbeta signaling pathway, smoking and risk of colorectal cancer in a Chinese population. Carcinogenesis. 2013; 34:936–942.
46. Li Q, Seo JH, Stranger B, McKenna A, Pe’er I, Laframboise T, Brown M, Tyekucheva S, Freedman ML. Integrative eQTL-based analyses reveal the biology of breast cancer risk loci. Cell. 2013; 152:633–641.
47. Andersson T, Alfredsson L, Kallberg H, Zdravkovic S, Ahlbom A. Calculating measures of biological interaction. Eur J Epidemiol. 2005; 20:575–579.
48. Knol MJ, van der Tweel I, Grobbee DE, Numans ME, Geerlings MI. Estimating interaction on an additive scale between continuous determinants in a logistic regression model. Int J Epidemiol. 2007; 36:1111–1118.