
INTRODUCTION
The candidate sub-region of chromosome 19q13.3 includes four genes. From 3'→5', they are ERCC2/XPD (excision repair cross-complementing rodent repair deficiency, complementation group 2/xeroderma pigmentosum complementary group D), PPP1R13L/IASPP/RAI [protein phosphatase 1, regulatory (inhibitor) subunit 13 like/Inhibitory member of the ASPP family/RelA-associated inhibitor], CD3EAP/ASE-1 [CD3e molecule, epsilon-associated protein/antisense to ERCC1)], and ERCC1 (excision repair cross-complementing rodent repair deficiency, complementation group 1) (Figure 1). ERCC2 and ERCC1 are involved in DNA repair while PPP1R13L and CD3EAP participate in apoptosis and rRNA transcription, respectively [1, 2]. Genetically determined changes in activity of any of the four genes may play vital roles in carcinogenesis.
Lung cancer is a leading cause of death worldwide [3]. Genetically determined susceptibility may contribute to carcinogenesis, possibly through gene-environment interactions. Three linkage disequilibrium (LD)-mapping studies in Caucasian populations have identified the sub-region encompassing ERCC2, PPP1R13L, CD3EAP and ERCC1 within chromosome 19q13.3 as being associated with risk of basal cell carcinoma, breast cancer and with multiple myeloma prognosis [4, 5, 1, 6]. Fine-mapping of cancer susceptibility related to the four genes at this chromosome region is still pending in Asian populations. Since the allele frequencies of a number of polymorphisms are very different among Caucasians and Asians, fine-mapping of the region in Asians may provide a tool for identification of the causal genetic variants.
In previous studies, we have examined all the commonly occurring single nucleotide polymorphisms (SNP) of the four genes at chromosome 19q13.3 in relation to lung cancer risk [7-10]. In order to further refine genetic variant location of lung cancer susceptibility at the same region in Chinese populations, we here used a dense fine-mapping strategy and performed extensive genotyping of SNPs.
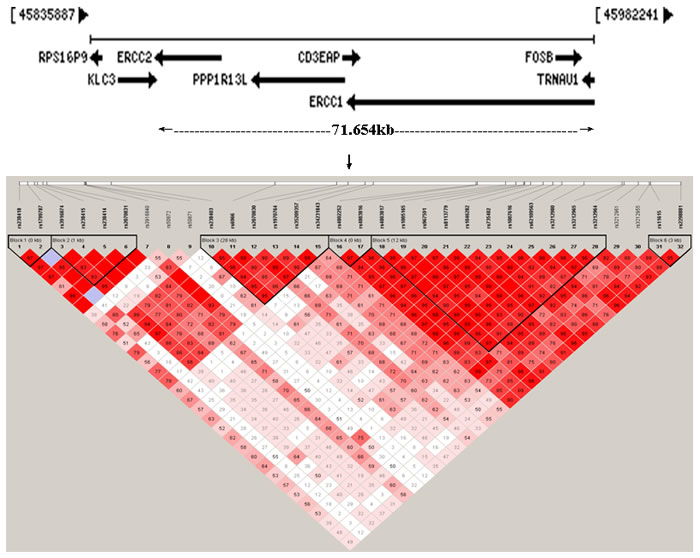
Figure 1: Schematic presentations of the studied genomic region 19q13.3. Upper panel: Gene locations with HUGO gene nomenclature on the chromosome sub-region 19q13.3 are shown. The arrow length represents the extent of the gene and the arrowhead indicates the transcription direction (From: http://www.ncbi.nlm.nih.gov/)(Adopted time: 2013-10-31). The distributed extent of 39 SNPs related to ERCC2, PPP1R13L, CD3EAP and ERCC1 in current study was 71.654kb. Lower panel: D′ LD map and LD plot of 32 SNPs covering ERCC2 (SNP1~10), PPP1R13L (SNP11~19), CD3EAP (SNP20~25) and ERCC1 (SNP26~32) on chromosome 19q13.3 from this Chinese lung cancer study. SNPs in 3' to 5' order as indicated in Table 4. Six blocks were detected by Haploview 4.2. The criteria of block partition were based on 95% confidence interval bounds of D′ values. The digit in the boxes represents D′ value (e.g. 99 means 0.99; 1 means 0.01; empty boxes means 1.0). Deep red boxes designate strong evidence of LD. Light red boxes designate uninformative. White boxes designate strong evidence of recombination.
RESULTS
The current study group included 384 lung cancer cases and 387 cancer-free controls. Lung cancer cases had significantly higher occurrence of cancer family history [OR (95% CI) = 11.70 (4.62-29.66), P < 0.0001] and longer smoking history ( > 20 years) (P < 0.0001) compared to the control group. There was no notably statistically significant difference between cases and controls for mean age and gender. There were more males than females among cases (Table 1).
Table 1: Basic characteristics of lung cancer cases and controls
Lung cancer cases n (%) |
Controls n (%) |
OR (95% CI) |
P-value |
|
(n= 384) |
(n= 387) |
|||
Age (years) |
||||
Mean (±SD) |
58 (±11) |
58 (±11) |
|
0.91a |
≤40 |
21 (5.5) |
20 (5.2) |
||
41–50 |
70 (18.2) |
83 (21.4) |
||
51–60 |
125 (32.6) |
116 (30.0) |
0.69b |
|
>60 |
168 (43.8) |
168 (43.4) |
||
Gender |
||||
Male |
273 (71.1) |
276 (71.3) |
||
Female |
111 (28.9) |
111 (28.7) |
0.95b |
|
Family historyc |
||||
Nod |
333 (86.7) |
382 (98.7) |
1.0 |
|
Yes |
51 (13.3) |
5 (1.3) |
11.70 (4.62-29.66) |
<0.0001b |
Smoking history |
||||
Neverd |
133 (34.6) |
206 (53.2) |
1.0 |
|
≤20 (years) |
67 (17.4) |
73 (18.9) |
1.42 (0.96-2.11) |
<0.0001b |
>20 (years) |
184 (47.9) |
108 (27.9) |
2.64 (1.91-3.64) |
a For t' test
b For χ2 test (two-sided), boldface means statistical significance
c Family history of cancer
d No family history group and Never smoking group as reference category, respectively
Thirty-nine polymorphisms were genotyped in the chromosome 19q13.3 region encompassing the 4 genes. Genotyping revealed no variant alleles for rs10418623, rs3212967, and rs3212950. All other polymorphisms were in Hardy-Weinberg equilibrium among controls except rs2097215, rs8112723, rs201704 and rs3212986. So, these 7 SNPs were excluded leaving 32 SNPs for the subsequent evaluation.
Thirty-two SNPs in 19q13.3 were analyzed using five different genetic models in relation to lung cancer risk adjusting for smoking duration (Table 2). PPP1R13L rs1970764, rs1005165, CD3EAP rs967591, rs735482, rs1007616, rs62109563, and ERCC1 rs3212965 were all associated with lung cancer risk in at least one of the models. The associations were evaluated on the basis of AIC (Akaike’s Information Criterion) for different genetic models (to choose the smallest values). Six SNPs, PPP1R13L rs1970764 [OR, Odd Ratio (95% CI, 95% confidence interval) = 1.58 (1.09-2.29), P = 0.014] in the recessive model and PPP1R13L rs1005165 [OR (95% CI) = 1.25 (1.01-1.54), P = 0.036], CD3EAP rs967591 [OR (95% CI) = <1.40 (1.13-1.75), P = 0.0023], rs735482 [OR (95% CI) = 1.29 (1.03-1.61), P = 0.026], rs1007616 [OR (95% CI) = 0.78 (0.61-1.00), P = 0.046], and rs62109563 [OR (95% CI) = 1.28 (1.03-1.59), P = 0.024] in the log-additive model, were associated with increased lung cancer risk. ERCC1 rs3212965 [OR (95% CI) = 0.70 (0.52-0.94), P = 0.019] was associated with lowered lung cancer risk in the over-dominant model. The association of CD3EAP rs967591 [OR (95% CI) = 1.40 (1.13-1.75), P = 0.0023] with lung cancer risk was the strongest using the log-additive model.
Table 2: Single analysis for lung cancer association of 32 SNPs on Chromosome 19q13.3 in five genetic modelsa, OR (95%CI) adjusted for smoking duration
Gene/rs |
Ca/Co |
Co-dominant |
Dominant |
Recessive |
Over-dominant |
Log-additive |
(AB vs AA)/(BB vs AA)/P |
(AB+BB vs AA)/P |
(BB vs AA+AB)/P |
(AB vs AA+BB)/P |
(- -) /P |
||
ERCC2 |
||||||
rs238418 |
378/384 |
1.05 (0.77-1.43)/1.08 (0.66-1.76)/0.93 |
1.06 (0.79-1.42)/0.7 |
11.05 (0.66-1.67)/0.84 |
1.04 (0.77-1.39)/0.8 |
1.04 (0.84-1.30)/0.71 |
rs1799787 |
320/344 |
1.10 (0.68-1.81)/0.92 (0.12-6.88)/0.92 |
1.09 (0.68-1.77)/0.7 |
10.91 (0.12-6.79)/0.93 |
1.11 (0.68-1.81)/0.69 |
1.08 (0.69-1.68)/0.75 |
rs3916874 |
331/346 |
0.97 (0.69-1.38)/0.42 (0.16-1.15)/0.21 |
0.90 (0.64-1.26)/0.5 |
40.43 (0.16-1.15)/0.08 |
1.01 (0.71-1.42)/0.98 |
0.85 (0.63-1.14)/0.28 |
rs238415 |
381/382 |
1.00 (0.71-1.40)/1.14 (0.75-1.73)/0.78 |
1.04 (0.76-1.43)/0.81 |
1.14 (0.79-1.63)/0.48 |
0.95 (0.71-1.27)/0.72 |
1.06 (0.86-1.31)/0.58 |
rs238414 |
377/383 |
0.93 (0.66-1.31)/0.80 (0.52-1.23)/0.58 |
0.89 (0.64-1.24)/0.49 |
0.84 (0.58-1.21)/0.34 |
1.02 (0.76-1.37)/0.88 |
0.90 (0.73-1.11)/ 0.32 |
rs2070831 |
381/386 |
1.13 (0.84-1.54)/0.76 (0.41-1.41)/0.4 |
1.08 (0.80-1.44)/0.62 |
0.72 (0.39-1.32)/0.28 |
1.17 (0.87-1.57)/0.3 |
1.00 (0.79-1.26)/0.98 |
rs3916840 |
329/348 |
1.05 (0.61-1.80)/NA (0.00-NA)/0.61 |
1.07 (0.63-1.84)/0.8 |
NA (0.00-NA)/0.33 |
1.04 (0.61-1.80)/0.88 |
1.10 (0.65-1.86)/0.72 |
rs50872 |
381/385 |
1.18 (0.87-1.60)/1.35(0.57-3.20)/0.49 |
1.19 (0.88-1.61)/0.25 |
1.27 (0.54-3.00)/0.58 |
1.16 (0.86-1.58)/0.33 |
1.17 (0.90-1.53)/0.24 |
rs50871 |
310/346 |
0.91 (0.66-1.27)/1.23 (0.64-2.36)/0.66 |
0.95 (0.70-1.31)/0.78 |
1.27 (0.67-2.41)/0.46 |
0.89 (0.65-1.24)/0.5 |
1.01 (0.78-1.30)/0.94 |
rs238403 |
319/331 |
0.88 (0.61-1.29)/ 0.94(0.59-1.48)/0.81 |
0.90 (0.63-1.28)/0.55 |
1.01 (0.69-1.50)/0.94 |
0.91 (0.66-1.25)/0.56 |
0.96 (0.76-1.21)/0.73 |
PPP1R13L |
||||||
rs6966 |
291/300 |
1.03 (0.69-1.55)/1.17 (0.72-1.89)/0.8 |
1.07 (0.73-1.57)/0.72 |
1.14 (0.77-1.70)/0.52 |
0.96 (0.69-1.34)/0.82 |
1.08 (0.85-1.37)/0.54 |
rs2070830 |
381/384 |
1.13 (0.83-1.52)/1.25 (0.69-2.25)/0.63 |
1.14 (0.85-1.53)/0.37 |
1.18 (0.67-2.09)/0.57 |
1.10 (0.82-1.47)/0.54 |
1.12 (0.89-1.42)/0.34 |
rs1970764 |
352/360 |
1.09 (0.76-1.56)/1.67 (1.07-2.61)/0.046b |
1.23 (0.87-1.74)/0.24 |
1.58 (1.09-2.29)/0.014b |
0.86(0.64-1.16)/0.33 |
1.28 (1.03-1.60)/0.026b |
rs35209357 |
381/384 |
1.19 (0.88-1.61)/1.54 (0.90-2.66)/0.23 |
1.24 (0.92-1.66)/0.15 |
1.42 (0.84-2.38)/0.19 |
1.11 (0.83-1.49)/0.49 |
1.22 (0.97-1.53)/0.089 |
rs34231843 |
379/383 |
1.14 (0.84-1.54)/1.68 (0.97-2.90)/0.17 |
1.21 (0.90-1.62)/0.21 |
1.58 (0.93-2.67)/0.089 |
1.05 (0.78-1.40)/0.76 |
1.23 (0.97-1.54)/0.083 |
rs4802252 |
330/335 |
0.80 (0.57-1.12)/0.88 (0.44-1.77)/0.42 |
0.81 (0.59-1.12)/0.2 |
0.96 (0.49-1.90)/0.91 |
0.81 (0.58-1.12)/0.2 |
0.86 (0.66-1.12)/0.27 |
rs4803816 |
380/383 |
0.75 (0.55-1.03)/0.80 (0.42-1.52)/0.18 |
0.76 (0.56-1.02)/0.067 |
0.89 (0.47-1.67)/0.72 |
0.77 (0.56-1.04)/0.087 |
0.82 (0.64-1.04)/0.1 |
rs4803817 |
330/335 |
0.73 (0.53-1.02)/0.74(0.42-1.29)/0.15 |
0.73 (0.53-1.01)/0.053 |
0.86 (0.51-1.47)/0.59 |
0.77 (0.56-1.06)/0.11 |
0.81 (0.63-1.03)/0.084 |
rs1005165 |
379/381 |
1.20 (0.86-1.68)/1.57(1.03-2.40)b/0.11 |
1.30 (0.94-1.78)/0.11 |
1.40 (0.97-2.02)/0.068 |
1.00 (0.75-1.34)/1 |
1.25 (1.01-1.54)/0.036b |
CD3EAP |
||||||
rs967591 |
352/360 |
1.48 (1.05-2.09)/1.93(1.23-3.02)/0.0088b |
1.59 (1.15-2.20)/0.0049b |
1.52 (1.02-2.27)/0.036b |
1.17 (0.87-1.59)/0.3 |
1.40 (1.13-1.75)/0.0023b |
rs8113779 |
379/384 |
1.19 (0.85-1.66)/1.52 (1.00-2.33)/0.15 |
1.27 (0.93-1.75)/0.14 |
1.37 (0.95-1.98)/0.091 |
1.00 (0.75-1.34)/0.99 |
1.23 (1.00-1.52)/0.052 |
rs1046282 |
330/335 |
0.74 (0.53-1.03)/0.78 (0.45-1.35)/0.18 |
0.74 (0.54-1.02)/0.066 |
0.90 (0.53-1.53)/0.71 |
0.77 (0.56-1.06)/0.11 |
0.82 (0.65-1.05)/0.12 |
rs735482 |
330/335 |
1.28 (0.89-1.85)/1.66 (1.06-2.62)b/0.084 |
1.38 (0.98-1.96)/0.067 |
1.42 (0.97-2.09)/0.074 |
1.03 (0.76-1.41)/0.84 |
1.29 (1.03-1.61)/0.026b |
rs1007616 |
377/384 |
0.75 (0.55-1.03)/0.66 (0.34-1.25)/0.13 |
0.74 (0.55-1.00)/0.048b |
0.73 (0.39-1.38)/0.33 |
0.78 (0.58-1.06)/0.12 |
0.78 (0.61-1.00)/0.046b |
rs62109563 |
381/385 |
1.30 (0.95-1.78)/1.63 (1.02-2.58)b/0.078 |
1.36 (1.01-1.84)/0.042b |
1.40 (0.92-2.15)/0.12 |
1.14 (0.85-1.53)/0.37 |
1.28 (1.03-1.59)/0.024b |
ERCC1 |
||||||
rs3212980 |
330/335 |
0.76 (0.55-1.06)/0.79 (0.45-1.37)/0.25 |
0.77 (0.56-1.05)/0.095 |
0.90 (0.53-1.53)/0.71 |
0.79 (0.58-1.09)/0.15 |
0.84 (0.66-1.07)/0.15 |
rs3212965 |
379/383 |
0.70 (0.51-0.95)b/0.98 (0.59-1.63)/0.063 |
0.75 (0.56-1.00)/0.049b |
0.87 (0.70-1.09)/0.22 |
0.70 (0.52-0.94)/0.019b |
0.87 (0.70-1.09)/ 0.22 |
rs3212964 |
330/335 |
1.05 (0.73-1.51)/1.42 (0.90-2.23)/0.28 |
1.14 (0.81-1.61)/0.44 |
1.37 (0.92-2.03)/0.12 |
0.92 (0.67-1.25)/0.59 |
1.17 (0.94-1.47)/0.16 |
rs3212961 |
330/335 |
1.07 (0.73-1.57)/1.42 (0.91-2.22)/0.25 |
1.17 (0.82-1.68)/0.39 |
1.36 (0.94-1.96)/0.1 |
0.90 (0.66-1.23)/0.51 |
1.19 (0.95-1.49)/0.13 |
rs3212955 |
381/387 |
1.01 (0.75-1.36)/1.15 (0.64-2.05)/0.89 |
1.03 (0.77-1.37)/0.86 |
1.15 (0.65-2.01)/0.63 |
0.99 (0.74-1.32)/0.94 |
1.04 (0.82-1.31)/0.74 |
rs11615 |
357/378 |
0.86 (0.63-1.19)/0.82 (0.43-1.57)/0.6 |
0.86 (0.63-1.16)/0.32 |
0.86 (0.46-1.63)/0.65 |
0.88 (0.64-1.20)/0.42 |
0.88 (0.69-1.13)/0.32 |
rs2298881 |
330/335 |
1.19 (0.84-1.69)/1.40 (0.88-2.23)/0.34 |
1.24 (0.89-1.73)/0.2 |
1.26 (0.83-1.91)/0.28 |
1.06 (0.78-1.45)/0.7 |
1.18 (0.94-1.49)/0.14 |
a Dominant model: AB(Heterozygote) + BB(Homozygous variant-type) versus AA(Homozygous wild-type)
Recessive model: BB versus AA+AB
Co-dominant model: AB versus AA or BB versus AA
Over-dominant model: AB versus AA+BB
Log-additive model: Analysis of trend where AA is ‘0’, AB is ‘1’ and BB is ‘2’
b Boldface means statistical significance
The log transformed P-values from the associations between the 32 single SNPs and lung cancer risk in the five genetic models are illustrated in Figure 2. The 7 closely situated markers from PPP1R13L rs1970764 (thirteenth SNP) to ERCC1 rs3212965 (twenty-seventh SNP) constitute a risk sub-region of 29.707kb on chromosome 19q13.3. This sub-region encompasses three genes PPP1R13L, CD3EAP and ERCC1. The SNP with the most statistically significant association with lung cancer risk was CD3EAP rs967591 (twentieth SNP). This SNP was statistically significantly associated with lung cancer risk in four different models (adjusted for smoking duration) (Table 2).
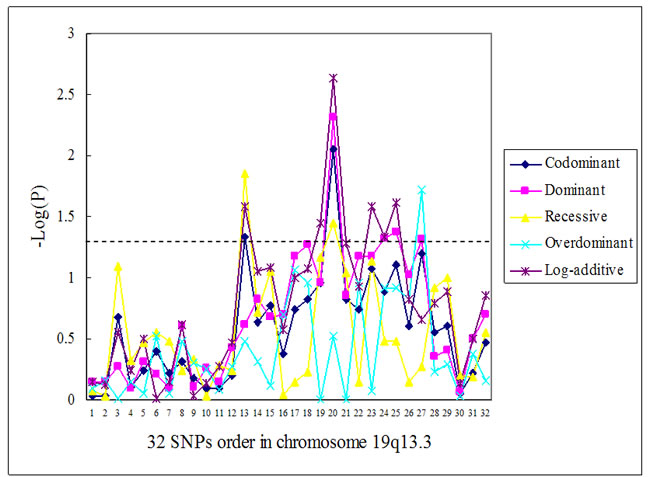
Figure 2: Association of single SNPs with lung cancer for five genetic models, adjusted by smoking duration. Data from Table 2. 32 SNPs in 3' to 5' order on chromosome 19q13.3 as indicated in Table 4. A dotted line indicates P-value of -Log (0.05).
The analysis of single-SNP associations with lung cancer risk was further stratified by smoking duration. We have previously reported that carriers of genotypes of rs967591 (G > A) AA, rs735482 (A > C) AC and CC, rs3212961 (C > A) CA and AA, rs2298881 (C > A) CA and AA were at increased risk among the heavy smokers ( > 20 years). There was interaction between rs3212961 and smoking duration (Ptrend = 0.03) [11, 10, 8]. In this study, we re-confirmed the aforementioned results and furthermore showed that carriers of rs1005165 (C > T) TT and CT [TT versus CC, OR (95% CI) = 2.24 (1.08-4.65), CT versus CC, OR (95% CI) = 1.73 (1.02-2.93)] or rs8113779 (G > T) TT [TT versus GG, OR(95% CI) = 2.20 (1.06-4.56)] in this sub-region were at increased lung cancer risk among heavy smokers ( > 20 years of smoking) (data not shown).
Linkage disequilibrium and haplotype block structure of the 32 SNPs in the genes ERCC2, PPP1R13L, CD3EAP and ERCC1 are illustrated in Figure 1. Six haplotype blocks were identified based on 95% confidence interval bounds of D′ values (Figure 1). Global test of the haplotype distribution between cases and controls showed statistically different haplotype distribution in block 5 (global P = 0.011). Moreover, a protective haplotype ACGGTATTACG spanning 11 SNPs (encompassing the minor allele of rs1007616 and the major alleles of remaining 10 SNPs) of PPP1R13L, CD3EAP and ERCC1 in this block [OR (95%CI) = 0.72 (0.53- 0.97), P = 0.032, adjusted for smoking duration] was detected after haplotypes with frequency < 0.03 in both cases and controls were excluded (Supplementary Table 1).
In a second approach used to identify causative polymorphisms, linkage was determined between the seven SNPs which were associated with lung cancer risk (rs1970764, rs1005165, rs967591, rs735482, rs1007616, rs62109563, rs3212965) (Supplementary Figure 1). Rs967591, rs735482 and rs1005165 were in tight linkage with high r2 values (Supplementary Figure 1). Therefore, rs735482 and rs1005165 were excluded from further analysis. Haplotype analysis of rs1970764, rs967591, rs1007616, rs62109563, and rs3212965 is shown in Table 3. The P-value of the global haplotype association was 0.023. The second most frequent haplotype encompassing the variant alleles of rs1970764, rs967591, and rs62109563 was associated with 1.44-fold (95% CI = 1.05-1.97, P = 0.022) increased risk of lung cancer. The sixth haplotype associated with a non-statistically significant 1.8-fold increased risk of lung cancer (95% CI = 0.92-3.54, P = 0.088) also included the variant allele of rs1970764 and in addition, the variant allele of rs3212965. Thus, this analysis points to rs1970764 as being most consistently associated with lung cancer risk.
Table 3: Haplotype association in 5 significant SNPs, adjusted by smoking durationa, b
Hap |
rs1970764 |
rs967591 |
rs100761 |
rs62109563 |
rs3212965 |
Control |
Case |
OR (95% CI) |
P-value |
frequency |
frequency |
||||||||
1 |
A |
G |
C |
T |
T |
0.2731 |
0.2473 |
1.00 |
--- |
2 |
G |
A |
C |
C |
C |
0.217 |
0.2615 |
1.44 (1.05 - 1.97)c |
0.022c |
3 |
G |
G |
T |
T |
C |
0.1198 |
0.1262 |
1.12 (0.76 - 1.66) |
0.57 |
4 |
A |
G |
T |
T |
C |
0.1123 |
0.0876 |
0.85 (0.54 - 1.33) |
0.47 |
5 |
A |
A |
C |
C |
C |
0.0879 |
0.0995 |
1.33 (0.82 - 2.15) |
0.25 |
6 |
G |
G |
C |
T |
T |
0.0336 |
0.0509 |
1.80 (0.92 - 3.54) |
0.088 |
7 |
A |
A |
C |
T |
C |
0.0365 |
0.0449 |
1.32 (0.68 - 2.55) |
0.41 |
8 |
G |
A |
C |
T |
C |
0.0365 |
0.0339 |
1.12 (0.56 - 2.25) |
0.75 |
a Analyzed by SNPStats program. Haplotypes with frequency < 0.03 in both cases and controls were excluded
b Global haplotype association P-value = 0.023
c Boldface means association with increased susceptibility of lung cancer
DISCUSSION
We have previously identified a susceptibility region on chromosome 19q13.3 in relation to lung cancer risk using a HapMap-based strategy among Chinese (16 tag SNPs) [10]. Fine-mapping studies now enable us to narrow down the set of candidate causal polymorphisms. This study is an elaboration of our previous association analysis with lung cancer including 18 tag SNPs and 14 non-tag SNPs. To the best of our knowledge, this is the first comprehensive fine-mapping of lung cancer (or cancer) susceptibility encompassing ERCC2, PPP1R13L, CD3EAP and ERCC1 on chromosome 19q13.3 among Chinese (also Asian).
We have previously reported that PPP1R13L rs1970764 in intron8 and CD3EAP rs967591 in the 5' UTR and CD3EAP rs735482 in exon3 were associated with increased lung cancer risk in a co-dominant model or dominant model after adjustment for smoking duration [11, 10]. In the present study, we report that rs1970764 was associated with lung cancer risk in a recessive model, and rs967591 and rs735482 was associated with lung cancer risk in a log-additive model as previously reported (Table 2). In addition, we identified 4 new polymorphisms in the vicinity of three SNPs as being associated with lung cancer risk. There are PPP1R13L rs1005165 near the 5' end of CD3EAP, CD3EAP rs1007616 in the 3' UTR, rs62109563 in the 3' UTR, and ERCC1 rs3212965 in intron5.
We determined 6 haplotype blocks in the sub-region of chromosome 19q13.3. Seven SNPs which were associated with lung cancer risk were partitioned in block 3 and block 5. PPP1R13L rs1970764 is located in block 3. The remaining 6 SNPs were all located in block 5. The 6 SNPs were in strong pair-wise linkage disequlibrim with one another (all D' > 0.8) (Figure 1), implying that they probably detect the same biological effect. Both PPP1R13L rs1970764 in block 3 and CD3EAP rs967591 in block 5 were important constituents of the previously identified “high-risk haplotype” associated with increased risk of several cancers among Caucasian [12-14]. We also proposed the two SNPs as risk candidates for single genetic locus among Chinese [11, 15]. Recent studies of Koreans reported that PPP1R13L rs1970764 was significantly associated with relapse-free and disease-specific survival in a recessive model for rectal cancer and CD3EAP rs967591 AA genotype exhibited lower overall survival of early-stage lung cancer [16, 17]. The two blocks spanning ERCC2, PPP1R13L, CD3EAP and ERCC1 within chromosome 19q13.3 were high linkage disequilibrium as also observed in Caucasian Danes [1].
We attempted to locate the causal sequences and polymorphisms. The haplotype block analysis suggested that the causal genetic variation could locate to the 28.406 kb from ERCC2 intron11 rs238403 to PPP1R13L intron8 rs34231843 in block 3 and to the 12.836kb from PPP1R13L intron1 rs4803817 to ERCC1 intron5 rs3212964 in block 5. However, when combining this information with the multiple single marker analysis, our data clearly indicated that the biologically relevant effectors probably locates to the 29.707kb spanning from PPP1R13L intron8 rs1970764 to ERCC1 intron5 rs3212965 as all significant P-values were found in this region. The most probable location is therefore in the 23.173kb spanning from PPP1R13L intron8 rs1970764 to rs62109563 3' to CD3EAP. This DNA segment contains 6 SNPs with significant P-values. The sub-region span was very similar to the region identified for Caucasian Danes [1, 5, 6]. Using an alternative approach where we performed a haplotype analysis of all significant polymorphisms, rs1970764 was found to be most consistently associated with lung cancer risk.
However, the present case-control study group had a modest sample size and verification should be attempted in larger population-based cohorts.
We performed functional predictions for the 7 SNPs that were significantly associated with lung cancer risk using web-based SNP selection tools: SNPinfo [18] and Polyphen-2 [19]. The SNPinfo analysis suggested that rs1005165 at 5' near gene and rs967591 at 5' UTR may potentially modify activity of both PPP1R13L and CD3EAP because of the close proximity of both genes. Rs1005165 with high regulatory potential score (RPS) (0.405099) and conservation score (0.781) and rs967591 with RPS (0.199765) were predicted to create TFBS (Transcription Factor Binding Sites) or TFBS and Splicing [ESE or ESS (Exonic Splicing Enhancer or Exonic Splicing Silencer)]. Rs1007616 in the 3' UTR and rs62109563 near the 3' may potentially influence both CD3EAP and ERCC1 since the two SNPs locate to a region with overlapping transcription of CD3EAP and ERCC1. TFBS and MicroRNA-binding sites were predicted for rs1007616. A benign influence was predicted by Polyphen-2 for rs735482 which is a non-synonymous SNP. Thus, 4 of the SNPs associated with lung cancer risk could potentially be the biologically relevant polymorphism. An important next step would be to experimentally characterize the potential biological effects of these all candidate SNPs.
In summary, we have fine-mapped the sub-region encompassing ERCC2, PPP1R1, CD3EAP and ERCC1 on chromosome 19q13.3 region in relation to lung cancer susceptibility among Chinese. We observed that of the 32 (39) SNPs directly genotyped covering a 71.654kb region, seven closely situated SNPs were all associated with lung cancer risk. Studying combinations of markers, LD blocks and their haplotypes, we suggest that a sub-region with the strongest association to lung cancer susceptibility might locate to the 23.173kb from PPP1R13L intron8 rs1970764 to rs62109563 3' to CD3EAP. Further fine-mapping studies of cancer susceptibility with other Asian populations should focus on these loci.
MATERIALS AND METHODS
Ethics statement
The Chinese Administration Office of Human Genetic Resources approved this protocol. It complied with the principles outlined in the Helsinki Declaration. All study participants granted written or oral informed consent.
Samples
The studied population comprised 771 subjects, including 384 cases with lung cancer and 387 cancer-free controls using the same study population with increased sample size [10]. Briefly, lung cancer diagnosis was based on standard clinical and histological criteria. Eligible cases were previously untreated (recruited prior to chemotherapy or radiotherapy for cancer). Cancer-free controls were identified from the orthopedics wards in the same region. Cancer-free status was ensured by Doctor’s query in detail. Cancer-free, randomly selected controls were matched to the cases by ±3 years age, sex and ethnicity (So population stratification was not carried out). All subjects were unrelated ethnic Han Chinese. All covariate data were obtained from questionnaires. Stratification analyses were defined by gender, age (10-year intervals) and smoking history (20-year intervals) (Table 1).
SNP selection
We added more non-tag SNPs in present study to tag SNPs from our previous studies and combined all data to enable fine-mapping of lung susceptibility on chromosome 19q13.3. As a whole, SNPs were determined in the Chr19q13.3 lung cancer candidate region spanning 45855262 - 45926916 bp (range: 71.654kb) from 37.3 Genome Build in NCBI dbSNP. In total 39 SNPs, containing 18 tag SNPs (r2 ≥ 0.80 and MAF ≥ 0.05) and 21 non-tag SNPs with MAF ≥ 0.05, were included to capture the variability present across the sub-region in Chinese populations. The tag SNPs covered 90% of the common variation in the sub-region. The risk loci from our previous publications [10] were used as the center source of selection of non-tag SNPs. More details are presented in Table 4.
Table 4: The information of selected 39 SNPs in ERCC2, PPP1R13L, CD3EAP and ERCC1 on Chr19q13.3
Gene/ dbSNP ID |
Location |
Position |
Base change |
Allele frequency in HapMap CHB |
MAF in control group |
Genotyping technique |
ERCC2a |
||||||
rs238418 |
intron |
45855262 |
C/T |
C0.675/A0.325 |
A0.33 |
Sequenom |
rs1799787/Tag |
intron |
45856144 |
C/T |
C0.932/T0.068 |
T0.06 |
PCR-RFLP |
rs3916874/Tag |
intron |
45856926 |
G/C |
G0.811/C0.189 |
C0.17 |
PCR-RFLP |
rs238415/Tag |
intron |
45857235 |
C/G |
C0.525/G0.475 |
G0.45 |
Sequenom |
rs238414 |
intron |
45857820 |
C/T |
C0.608/T0.392b |
T0.48 |
Sequenom |
rs2070831 |
intron |
45858246 |
C/T |
C0.767/T0.233b |
T 0.27 |
Sequenom |
rs3916840/Tag |
intron |
45862297 |
C/T |
C0.944/T0.056 |
T 0.04 |
PCR-RFLP |
rs50872/Tag |
intron |
45862449 |
C/T |
C0.709/T0.291 |
T0.19 |
Sequenom |
rs50871/Tag |
intron |
45862515 |
T/G |
T0.678/G0.322 |
G0.25 |
Tag-Man |
rs238403/Tag |
intron11 |
45865217 |
C/T |
C0.560/T0.440 |
T0.47 |
PCR-RFLP |
rs2097215c |
5' near gene |
45875787 |
A/G |
A0.537G0.463 |
G0.49 |
Sequenom |
PPP1R13La |
||||||
rs6966/Tag |
3' UTR |
45882962 |
A/T |
A0.500/T0.500 |
T0.48 |
PCR-RFLP |
rs8112723c |
intron |
45885279 |
A/T |
A0.533/T0.467b |
T0.31 |
Sequenom |
rs201704c |
intron |
45887265 |
A/T |
No |
T0.49 |
Sequenom |
rs2070830/Tag |
intron |
45889650 |
G/T |
G0.667/T0.333 |
T0.28 |
Sequenom |
rs1970764 |
intron8 |
45890873 |
A/G |
No |
G0.46 |
LDR-PCR |
rs10418623d |
intron |
45891670 |
G/A |
G0.667/A0.333b |
0 |
Sequenom |
rs35209357 |
intron |
45892719 |
G/C |
G0.692/C0.308b |
C0.3 |
Sequenom |
rs34231843 |
intron8 |
45893623 |
A/G |
A0.692/G0.308b |
G0.29 |
Sequenom |
rs4802252/Tag |
intron |
45904759 |
C/T |
C0.732/T0.268b |
T0.24 |
LDR-PCR |
rs4803816 |
intron |
45904888 |
T/C |
T0.707/C0.293 |
C0.24 |
Sequenom |
rs4803817/Tag |
intron1 |
45907960 |
A/G |
A0.678/G 0.322 |
G0.34 |
LDR-PCR |
rs1005165 |
5' near gene |
45909050 |
C/T |
C0.575/T0.425 |
T0.43 |
Sequenom |
CD3EAPa |
||||||
rs967591 |
5' UTR |
45909934 |
G/A |
G0.525/A0.475b |
A0.39 |
LDR-PCR |
rs8113779 |
intron |
45910003 |
G/T |
G0.517/T0.483b |
T0.43 |
Sequenom |
rs1046282/Tag |
intron/3' UTR for ERCC1 |
45910672 |
T/C |
T0.673/C0.327b |
C0.34 |
LDR-PCR |
rs735482/Tag |
exon3/3' UTR for ERCC1 |
45912002 |
A/C |
A0.556/C0.444 |
C0.44 |
LDR-PCR |
rs3212986c |
exon3/3' UTR for ERCC1 |
45912736 |
G/T |
G0.686/T0.314 |
T0.33 |
Sequenom |
rs1007616 |
3' UTR |
45913093 |
C/T |
C0.683/T0.317b |
T0.25 |
Sequenom |
rs62109563 |
3' near gene |
45914046 |
T/C |
T0.650/C 0.350b |
C0.35 |
Sequenom |
ERCC1a |
||||||
rs3212980/Tag |
intron |
45916441 |
A/C |
A0.679/C0.321b |
C0.34 |
LDR-PCR |
rs3212967d |
intron |
45920264 |
C/T |
C0.550/T0.450b |
T1.0 |
Sequenom |
rs3212965 |
intron5 |
45920580 |
C/T |
C0.689 /T0.311 |
T0.33 |
Sequenom |
rs3212964/Tag |
intron5 |
45920796 |
G/A |
G0.567/A0.433 |
A0.43 |
LDR-PCR |
rs3212961/Tag |
intron |
45922323 |
A/C |
A0.500/C0.500 |
A0.48 |
LDR-PCR |
rs3212955 |
intron |
45923496 |
A/G |
A0.711/G0.289 |
G0.29 |
Sequenom |
rs11615/Tag |
exon4 |
45923653 |
G/A |
G0.778/A0.222 |
A0.23 |
PCR-RFLP |
rs3212950d |
intron |
45924086 |
C/G |
C0.658/G0.342b |
C1.0 |
Sequenom |
rs2298881/Tag |
intron |
45926916 |
T/C |
T0.517/A0.444 |
A0.4 |
LDR-PCR |
a The information from NCBI SNP database (37.3 Genome Build) and HapMap database
b CHB+JPT
c Hardy-Weinberg equilibrium departure
d Genotyping fail
Genotyping platform
Sequenom MassARRAY iPLEX platform (San Diego, CA, USA) was used for genotyping of ERCC2 rs238418, rs238414, rs2070831, rs50872, rs2097215; PPP1R13L rs8112723, rs201704, rs10418623, rs35209357, rs34231843, rs4803816, rs1005165; CD3EAP rs8113779, rs3212986, rs1007616, rs62109563; and ERCC1 rs3212967, rs3212965, rs3212955, rs3212950. Genotypes of ERCC2 rs1799787, rs3916874, rs3916840, rs50871, rs238403; PPP1R13L rs6966, rs1970764, rs4802252, rs4803817; CD3EAP rs967591, rs1046282, rs735482; and ERCC1 rs3212980, rs3212964, rs3212961, rs11615, rs2298881 were determined by methods of PCR-RFLP or Taq-Man or LDR-PCR as our previous reports [7-11]. Assay design and mass spectrometric genotyping were performed as previously described [20] with modifications as indicated in Supplementary Material, Methods. Primer and probe sequences are listed in Supplementary Material, Table 2. As previously described, assay design failed for rs50872 of ERCC2 [7], whereas the genotype distribution of rs2070830 in PPP1R13L (strongly) [9] and rs238415 in ERCC2 (slightly) [7] deviated from Hardy-Weinberg equilibrium among the controls. The three SNPs were regenotyped using Sequenom platform in the present analysis.
Statistics methods
For each SNP, Hardy-Weinberg equilibrium test, allele frequencies, and genotype frequencies were calculated using the SNPStats program [21] and Plink software v1.07 (http://pngu.mgh.harvard.edu/~purcell/plink/). Genotype distribution for each SNP among controls was tested for deviation from Hardy-Weinberg equilibrium and rejected at P < 0.05. Unconditional logistic regression was applied for calculation of adjusted OR, 95% CI (adjusted for smoking duration) and interaction between genotypes and smoking duration by using SNPStats. We did not adjust for family history of cancer since the study object is genetic susceptibility factors. Five genetic models (co-dominant model, dominant model, recessive model, over-dominant model and log-additive model) (Table 2) were performed for each single-locus case-control association. Haploview software 4.2 [22] and SNPStats program [21] were used to calculate D' and r2 values between the genotyped SNPs and haplotype frequencies, to generate D' and r2 map and LD block boundaries (based on 95% confidence bounds on D' values [23]) and to analyze the haplotype associations (OR, 95% CI, adjusted for duration of smoking) of LD blocks identified. Haplotypes with frequency < 0.03 among both cases and controls were excluded from the analysis.
Acknowledgments
This study was approved by the Chinese Administration Office of Human Genetic Resources (No. [2001]015).
Funding
This work was supported by National Natural Science Foundation of China (30571016 and 81072384); Foundation of Key Application Basis Studies, Science and Technology Bureau of Shenyang, People’s Republic of China (1081233-1-00-04) and Key Laboratory Foundation of Science and Technology Research, Education Ministry of Liaoning Province, People’s Republic of China (2008S222).
Conflicts of interest
The authors declare no conflict of interest.
Editorial note
This paper has been accepted based in part on peer-review conducted by another journal and the authors’ response and revisions as well as expedited peer-review in Oncotarget.
REFERENCES
1. Nexø BA, Vogel U, Olsen A, Nyegaard M, Bukowy Z, Rockenbauer E, Zhang X, Koca C, Mains M, Hansen B, Hedemand A, Kjeldgaard A, Laska MJ, Raaschou-Nielsen O, Cold S, Overvad K, Tjønneland A, Bolund L, Børglum AD. Linkage disequilibrium mapping of a breast cancer susceptibility locus near RAI/PPP1R13L/Iaspp. BMC Med Genet. 2008;9:56.
2. Schierup MH, Mailund T, Li H, Wang J, Tjønneland A, Vogel U, Bolund L, Nexø BA. Haplotype frequencies in a sub-region of chromosome 19q13.3, related to risk and prognosis of cancer, differ dramatically between ethnic groups. BMC Med Genet. 2009;10:20.
3. Ferlay J, Soerjomataram I, Dikshit R, Eser S, Mathers C, Rebelo M, Parkin DM, Forman D, Bray F. Cancer incidence and mortality worldwide: sources, methods and major patterns in GLOBOCAN 2012. Int J Cancer. 2015;136: E359-386.
4. Yin J, Rockenbauer E, Hedayati M, Jacobsen NR, Vogel U, Grossman L, Bolund L, Nexø BA. Multiple single nucleotide polymorphisms on human chromosome 19q13.2-3 associate with risk of Basal cell carcinoma. Cancer Epidemiol Biomarkers Prev. 2002;11:1449-1453.
5. Rockenbauer E, Bendixen MH, Bukowy Z, Yin J, Jacobsen NR, Hedayati M, Vogel U, Grossman L, Bolund L, Nexø BA. Association of chromosome 19q13.2-3 haplotypes with basal cell carcinoma: tentative delineation of an involved region using data for single nucleotide polymorphisms in two cohorts. Carcinogenesis. 2002;23:1149-1153.
6. Vangsted AJ, Klausen TW, Gimsing P, Abildgaard N, Andersen NF, Gregersen H, Nexø BA, Vogel UB. The importance of a sub-region on chromosome 19q13.3 for prognosis of multiple myeloma patients after high-dose treatment and stem cell support: a linkage disequilibrium mapping in RAI and CD3EAP. Ann Hematol. 2011;90:675-684.
7. Yin J, Vogel U, Ma Y, Qi R, Wang H. HapMap-based study of the DNA repair gene ERCC2 and lung cancer susceptibility in a Chinese population. Carcinogenesis . 2009;30:1181-1185.
8. Yin J, Vogel U, Ma Y, Qi R, Wang H, Yue L, Liang D, Wang C, Li X, Song T. HapMap-based study of a region encompassing ERCC1 and ERCC2 related to lung cancer susceptibility in a Chinese population. Mutat Res. 2011;713:1-7.
9. Yin J, Vogel U, Wang C, Liang D, Ma Y, Wang H, Yue L, Liu D, Ma J, Sun X. HapMap-based evaluation of ERCC2, PPP1R13L and ERCC1 and lung cancer risk in a Chinese population. Environ Mol Mutagen. 2012;53:239-245.
10. Yin J, Vogel U, Wang H, Ma Y, Wang C, Liang D, Liu J, Yue L, Zhao Y, Ma J. HapMap-based study identifies risk sub-region on chromosome 19q13.3 in relation to lung cancer among Chinese. Cancer Epidemiol. 2013;37:923-929.
11. Yin J, Vogel U, Ma Y, Wang H, Wang C, Liang D, Yue L, Ma J, Li X. A specific diplotype defined by PPP1R13L rs1970764, CD3EAP rs967591 and ERCC1 rs11615 and lung cancer risk in a Chinese population. Lung Cancer. 2012;76: 286-291.
12. Nexø BA, Vogel U, Olsen A, Ketelsen T, Bukowy Z, Thomsen BL, Wallin H, Overvad K, Tjønneland A. A specific haplotype of single nucleotide polymorphisms on chromosome 19q13.2-3 encompassing the gene RAI is indicative of post-menopausal breast cancer before age 55. Carcinogenesis. 2003; 24:899-904.
13. Vogel U, Laros I, Jacobsen NR, Thomsen BL, Bak H, Olsen A, Bukowy Z, Wallin H, Overvad K, Tjønneland A, Nexø BA, Raaschou-Nielsen O. Two regions in chromosome 19q13.2-3 are associated with risk of lung cancer. Mutat Res. 2004;546:65-74.
14. Skjelbred CF, Saebø M, Nexø BA, Wallin H, Hansteen IL, Vogel U, Kure EH. Effects of polymorphisms in ERCC1, ASE-1 and RAI on the risk of colorectal carcinomas and adenomas: a case control study. BMC Cancer. 2006;6:175.
15. Yin J, Guo L, Wang C, Wang H, Ma Y, Liu J, Liang D, Ma J, Zhao Y. Effects of PPP1R13L and CD3EAP variants on lung cancer susceptibility among nonsmoking Chinese women. Gene. 2013;524:228-231.
16. Chae YS, Kim JG, Kang BW, Lee SJ, Jeon HS, Park JS, Choi GS, Lee WK. PPP1R13L variant associated with prognosis for patients with rectal cancer. J Cancer Res Clin Oncol. 2013;139:465-473.
17. Jeon HS, Jin G, Kang HG, Choi YY, Lee WK, Choi JE, Bae EY, Yoo SS, Lee SY, Lee EB, Kim YT, Lee J, Cha SI, Kim CH, Jheon S, Kim IS, Park JY. A functional variant at 19q13.3, rs967591G > A, is associated with shorter survival of early-stage lung cancer. Clin Cancer Res. 2013;19:4185-4195.
18. Xu Z, Taylor JA. SNPinfo: integrating GWAS and candidate gene information into functional SNP selection for genetic association studies. Nucleic Acids Res. 2009;37:W600-5.
19. Adzhubei IA, Schmidt S, Peshkin L, Ramensky VE, Gerasimova A, Bork P, Kondrashov AS, Sunyaev SR. A method and server for predicting damaging missense mutations. Nat Methods. 2010;7:248-249.
20. Gabriel S, Ziaugra L, Tabbaa D. SNP genotyping using the Sequenom MassARRAY iPLEX platform, Curr. Protoc. Hum Genet 2009 Jan; Chapter 2: Unit 2.12. doi: 10.1002/0471142905.hg0212s60.
21. Solé X, Guinó E, Valls J, Iniesta R, Moreno V. SNPStats: a web tool for the analysis of association studies. Bioinformatics. 2006;22:1928-1929.
22. Barrett JC, Fry B, Maller J, Daly MJ. Haploview: analysis and visualization of LD and haplotype maps. Bioinformatics. 2005;21:263-265.
23. Gabriel SB, Schaffner SF, Nguyen H, Moore JM, Roy J, Blumenstiel B, Higgins J, DeFelice M, Lochner A, Faggart M, Liu-Cordero SN, Rotimi C, Adeyemo A, Cooper R, Ward R, Lander ES, Daly MJ, Altshuler D. The structure of haplotype blocks in the human genome. Science. 2002;296:2225-2229.