
INTRODUCTION
The RHO family of RAS-related GTPases, which includes CDC42, RAC, and RHO, regulates a variety of proliferative, cytoskeletal, and adhesive functions [1], and RHO activity is increased in many advanced cancers [2-3]. Although the RAS GTPases are frequently activated by mutation in tumors [4], such changes are less common among the RHO family GTPases [5-6]. Instead, their high activity is usually attributed to increased function of their activators, the RHO-specific guanine nucleotide exchange factors (GEFs), and/or decreased function of their inactivators, the Rho guanine nucleotide dissociation inhibitors (GDIs) and the RHO-specific GTPase accelerating proteins (GAPs), which hydrolyze the gamma phosphate of active Rho-GTP to inactive Rho-GDP [6]. A few of the 69 RHO-specific GEFs in the human genome have been implicated in a small number of cancers. Among the 64 RHO-specific GAPs, by contrast, reduced expression in cancer has been found frequently among members of the Deleted in Liver Cancer (DLC) family of Rho-GAPs. This family is comprised of three closely related genes: DLC1 (also known as ARHGAP7) [7], DLC2 (STARD13) [8], and DLC3 (STARD8) [9]. Their encoded Rho-GAP activity strongly hydrolyzes Rho-GTP, weakly hydrolyzes Cdc42-GTP, and has no detectable activity against Rac-GTP [8, 10-11].
Down-regulation of one or more DLC genes occurs frequently in a wide range of malignancies. These include solid tumors, such as liver cancer, lung cancer, colorectal cancer, prostate cancer, and breast cancer, as well as several hematopoietic neoplasms [12, 13]. DLC1 was the first family member identified, and a considerable amount of clinical and experimental evidence has established it as a bona fide tumor suppressor gene. Overexpression of DLC1 inhibits several biological parameters of neoplastic growth [13], and inactivation of endogenous DLC1 can, in conjunction with other genetic and/or epigenetic changes, lead to cell transformation and tumor formation [14, 15]. DLC2 and DLC3 have been studied less extensively, but they also appear to be tumor suppressors that are down-regulated in malignancies [9, 16].
However, it is not known whether the three DLC genes are down-regulated with a similar frequency or to the same degree in tumors. Furthermore, in normal cells, it is not clear whether their level of expression is similar or whether one of them may predominate in this regard. This is an important question, as down-regulation of a highly expressed tumor suppressor gene may have greater biological consequences than a similar fold reduction of a less highly expressed related gene, provided the genes have comparable tumor suppressor activities.
To address these issues, here we have taken advantage of The Cancer Genome Atlas (TCGA) database, which includes quantitative RNA-Seq data for expression of the DLC genes in a variety of tumors as well as in the respective adjacent normal tissues. In addition, we have experimentally compared the ability of the three DLC proteins to negatively regulate biological and biochemical parameters associated with neoplastic growth. Our analyses indicate that DLC1 expression is higher than DLC2 and DLC3 in several normal tissues, and that, in tumor types arising in these tissues, it is down-regulated to a degree that is greater than or equal to the down-regulation of DLC2 and DLC3. Furthermore, we have found experimentally that the biological activity of the three DLC proteins may be similar. These analyses lead us to conclude that down-regulation of DLC1 often makes a greater contribution to the tumor phenotype than that of DLC2 or DLC3.
RESULTS
Down-regulation of DLC1, DLC2, and DLC3 in lung, liver, breast, and colorectal cancers
Using TCGA data from tumor and normal tissue samples of lung squamous cell carcinoma (LSC), lung adenocarcinoma (LAD), hepatocellular carcinoma (HCC), breast adenocarcinoma, and colorectal adenocarcinoma, we first evaluated the RNA expression (RNA-Seq Version 2) of the three DLC family members in the normal tissues adjacent to the tumors. In each of the normal tissues except the colorectum, DLC1 was more highly expressed than DLC2 and DLC3 (Figure 1A–1E). DLC1 expression was 7 times higher than DLC2 and DLC3 in lung, 3 times higher in breast, and 4 times higher in liver. Reassuringly, the respective expression of all three DLC genes was similar in the normal lung tissues from the two forms of lung cancer LSC and LAD (Figure 1A and 1B). DLC1 expression in the lung was substantially higher than in the liver and breast (Figure 1F). In the normal colorectum, DLC1 expression was substantially lower than in the other tissues (Figure 1F), but it was still about 3-fold higher than DLC3 (Figure 1E). However, the levels of DLC1 and DLC2 were similar.
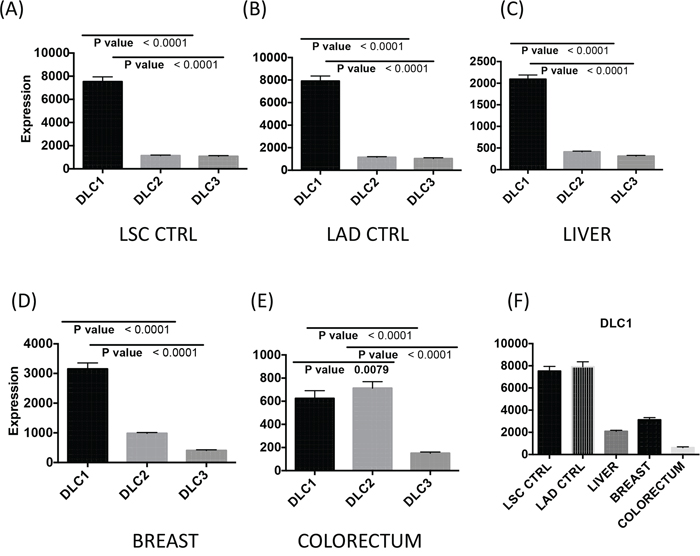
Figure 1: DLC1, DLC2 and DLC3 gene expression in control tissue adjacent to the tumors. Basal RNA expression levels of DLC1, DLC2 and DLC3 from normal tissue in lung A. and B., liver C., breast D. and colorectum E. are derived from the TCGA dataset (RNA-Seq Version 2, Level 3). The vertical axis differs for some panels. The mean and standard errors of adjacent controls from correspondent cancer have been plotted. F. DLC1 gene expression in different tissues. LSC = lung squamous cell carcinoma; LAD = lung adenocarcinoma.
We then compared the changes in expression between paired cancer and adjacent normal samples (Figure 2). In LSC and LAD, DLC1 expression was reduced 24-fold and 10-fold, respectively, while the fold reduction for DLC2 and DLC3 in both of these tumor types was less than one-half as much (Figure 2A and 2B). The magnitude of these reductions in DLC1 expression was striking, especially as its expression level in the normal tissues was highest in lung. In order to determine the percentage of patients with low DLC expression for LAD and LSC, we compared DLC values from LAD and LSC to the cutoffs determined by lung controls. We found that 46% of LAD and 96% LSC had low DLC1, 86% of LAD and 95% of LSC had low DLC2 and 72% of LSC had low DLC3 if cutoffs were defined by mean minus 2 standard deviations. One hundred percent of both LAD and LSC had low DLCs if cutoffs were defined by mean minus 1 standard deviation. In HCC, there was a 3-fold reduction in DLC1 expression, while DLC2 and DLC3 expression was not reduced, in part because there was increased expression of DLC2 and, especially, DLC3 in a substantial number of the tumors (Figure 2C). In breast cancer, the reductions were 4-fold for DLC1 and 2-fold for both DLC2 and DLC3 (Figure 2D). Analysis of breast cancer subtypes indicated that the expression of DLC1, DLC2, and DLC3 was significantly lower in triple-negative breast cancer (TNBC) than in the other subtypes (Figure S1). The reduction in DLC2 expression in triple-negative breast cancer was greater than that of DLC1 or DLC3. In colon cancer, where DLC1 expression had not predominated in the normal tissue, there was a 2-fold reduction for all three DLCs genes (Figure 2E).
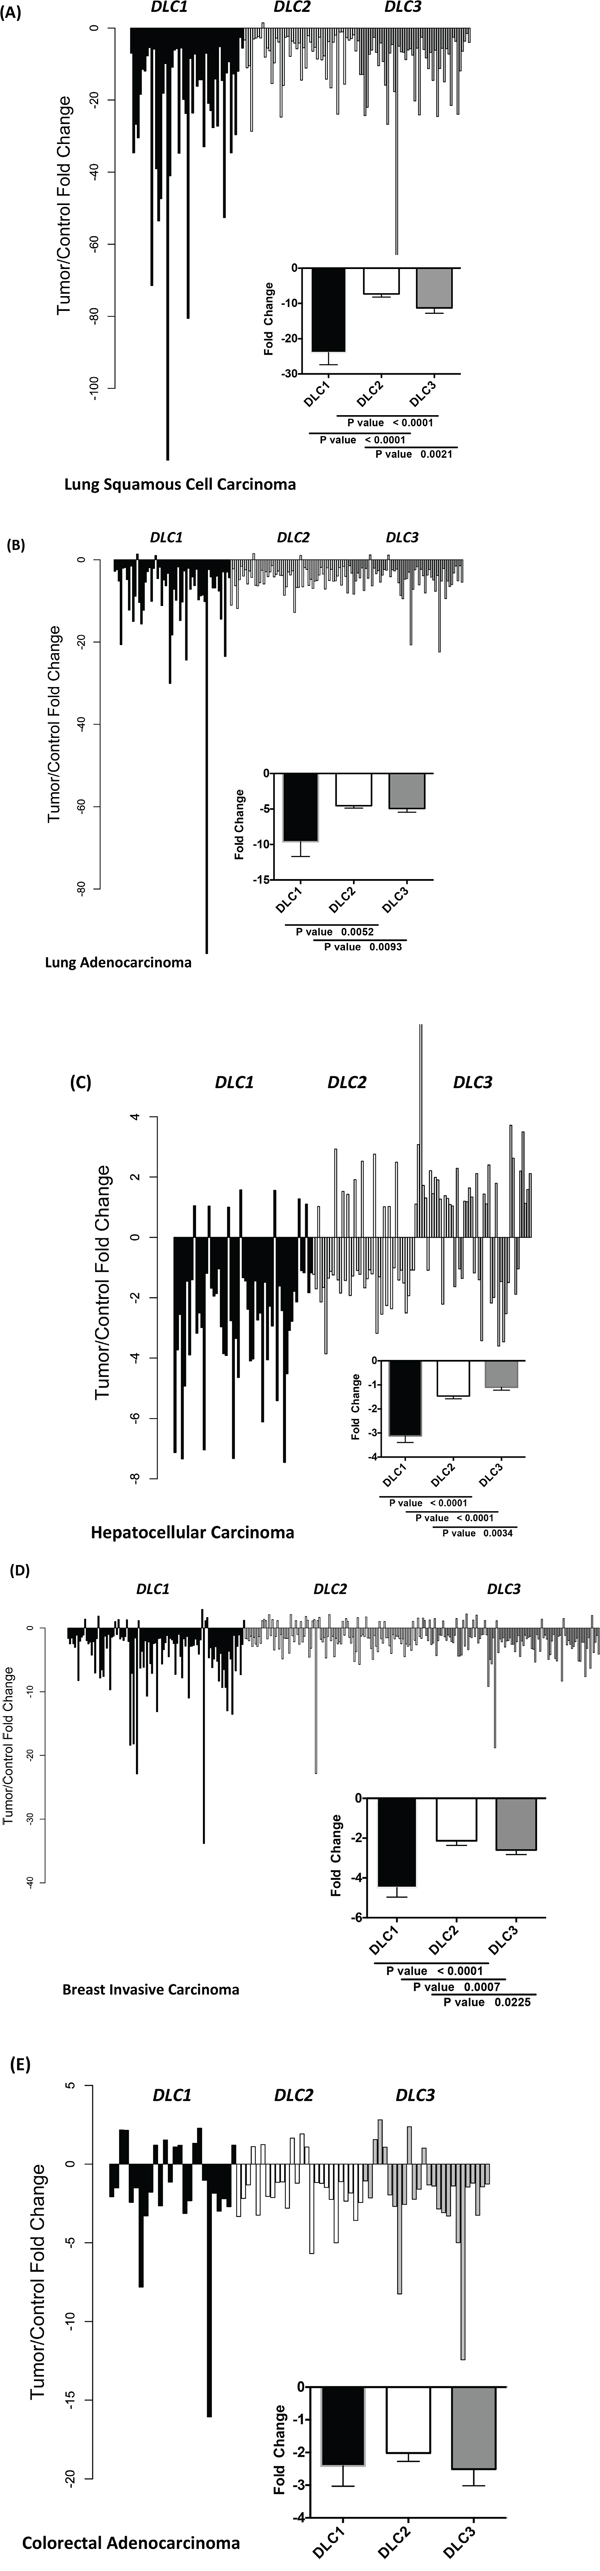
Figure 2: Fold change in DLC1, DLC2, and DLC3 expression between tumor and adjacent control tissue. The fold change of DLC1, DLC2 and DLC3 RNA-Seq Version 2 values from individual paired control to tumor of the TCGA dataset are plotted for lung squamous cell carcinoma A., lung adenocarcinoma B., hepatocellular carcinoma C., breast cancer D. and colorectal adenocarcinoma E.
In the TCGA dataset, clinical follow-up divided patients between those who did, and those who did not, develop a new tumor. In LAD, DLC1 expression, but not DLC2 and DLC3 expression, was higher in the “No New Tumor” group than in the “New Tumor” group (Figure 3A-3C). No such differences in DLC gene expression were observed in LSC and breast cancer (data not shown).
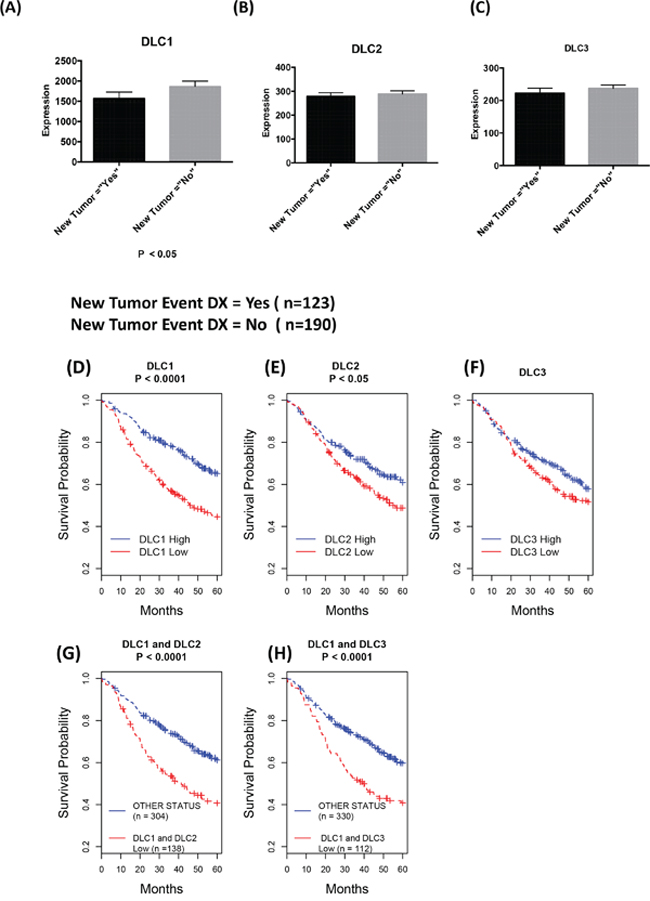
Figure 3: Down-regulation of DLCs is associated with poor prognosis. A-C. Comparison of DLC gene expression of patients with follow up status based on “new tumor event dx indicator” of TCGA lung adenocarcinoma clinical data as of October 2015. The most recent clinical patient status has been selected, and DLC gene expression (RNA-Seq Version 2) mean and standard errors of the mean are plotted against “new tumor” status. D-H. Kaplan-Meier survival analysis: Down-regulation of DLC1 and DLC2 is associated with poor prognosis. From the Director's Challenge Lung Study cohort of 442 lung adenocarcinomas. High and Low in the Figure legend represent the status of the mRNA expression level compared to the median of the expression for corresponding gene. D-F. Survival comparison between patients with low vs. high expression of the designated DLC gene. G. Survival comparison between patients whose DLC1 and DLC2 expressions are low vs. all others. H. Survival comparison between patients whose DLC1 and DLC3 expressions are low vs. all others.
To evaluate in more detail the possible relationship in LAD between prognosis and expression of the three DLC genes, we took advantage of the Director’s Challenge cohort caArray dataset of 442 LAD cases (jacob-00182) [17], whose annotated survival information is more extensive than the TCGA dataset. We have previously used this dataset to determine that low DLC1 expression is associated with a poor prognosis [22]. In addition to confirming this result (Figure 3D), we found that low DLC2 expression (Figure 3E) was also associated with an adverse outcome, although not to the same degree as DLC1 (P = 3E-06 for DLC1 vs. P = 0.015 for DLC2). Low DLC3 expression was not associated with clinical outcome (P = 0.20 for DLC3, Figure 3F). The combination of low DLC1 and low DLC2 (Figure 3G) or low DLC1 and low DLC3 (Figure 3H) was not a better predictor of outcome than that of low DLC1 by itself (P = 8E-06 for DLC1/DLC2 and P = 7E-05 for DLC1/DLC3).
Down-regulation of DLCs is associated with copy number loss and promoter methylation
DLC1 maps to the 8p21.3-22 chromosome region, which is frequently deleted in a number of human tumor types [7, 23]. In addition to deletion of DLC1, reduced expression of DLC1 in cancer has also been linked to promoter hypermethylation [12-13]. However, the relative contribution of these genetic and epigenetic changes to DLC expression has not been examined. In the TCGA HCC dataset, close to one-half (48%) of the tumors had DLC1 copy number loss, while just under one-quarter (22%) of them had copy number loss for DLC2 (Figure 4A). Expression of DLC1 and DLC2 was two-fold lower in the groups with copy number loss than in those without it. Compared with HCC, copy number loss of DLC1 was less frequent in LAD (20%) and LSC (25%) (Figure 4B and 4C), and, as expected, was not present in control tissue (Figure 4D). DLC2 copy number loss was also less frequent for LAD (9%) and LSC (16%). As with HCC, down-regulation of DLC1 and DLC2 expression was found in the groups with CNV log2 < -0.5 in LAD and LSC. No DLC3 copy number loss was seen in HCC, LAD, or LSC (data not shown).
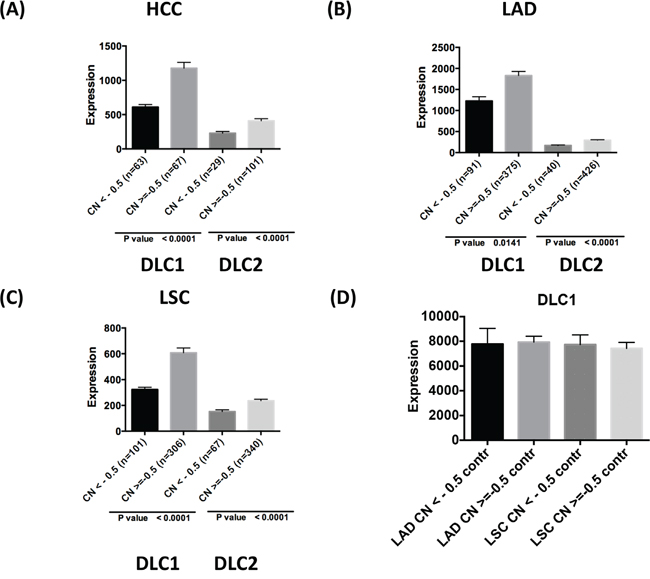
Figure 4: DLC copy number variation and gene expression in tumors. Comparison of DLC1 and DLC2 RNA-Seq values and copy number (CN) variation in TCGA HCC A., LAD B., and LSC C. The patients are grouped based on copy number loss variation (value log2 <-0.5 and log2 > = -0.5). D. DLC1 expression in adjacent control lung tissue grouped according to the copy number status of the respective LAD and LSC tumors.
Each of the three DLC family genes has a predominant transcript (9, 12, 24-25). Hypermethylation of the CpG-rich promoter region of the DLC1 variant 2 transcript, which is both the most abundant one and the one that has been studied in greatest detail, has been found in a number of cancers [12-13], but less is known about methylation of the DLC2 and DLC3 promoters (DLC promoter sequences are shown in Figure S2). In the TCGA dataset, the level of DLC1 methylation was about two-fold higher in LSC and LAD than in normal lung (Figure 5A and 5D). By contrast, there was no difference in the average level of DLC1 methylation between HCC and normal liver (Figure 5G). The level of DLC2 and DLC3 methylation in LSC was significantly higher in tumors than in normal tissue (Figure 5B and 5C). Methylation of individual CpG sites in DLC1 showed the highest levels in LSC cases, followed by LAD and HCC (Figure 5 and Figure S3). The increased DLC1 methylation was associated with lower gene expression in LSC and LAD, but not in HCC (Figure S4). For DLC2, methylation was increased in LSC (Figure 5B), but less than for DLC1 (Figure 5A). There were only modest (less than two-fold) differences in DLC2 and DLC3 methylation between the tumors and the respective normal tissue, although the increase in methylation was significant for DLC2 and for DLC3 in LSC and LAD (Figure 5B, 5C, 5E and 5F). There was actually a small, but significant, decrease in DLC3 methylation in HCC (Figure 5I). Thus, promoter methylation may make a larger contribution to low DLC1 expression in LSC and LAD than in HCC, while low DLC1 expression in HCC is more closely linked to copy number loss.
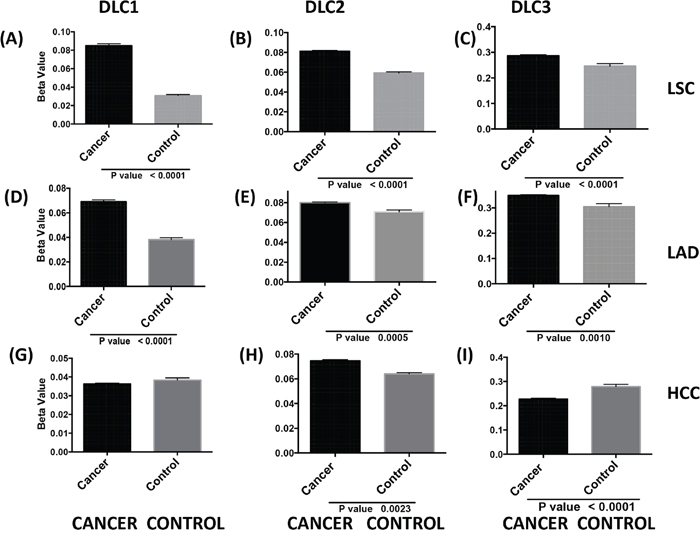
Figure 5: DLC promoter methylation and gene expression in tumors. TCGA level 3 data from JHU_USC__ HumanMethylation450 directory of each selected cancer were used for analysis. DLC means and standard errors of cancer and controls in LSC A-C., LAD D-F. and HCC G-I. were calculated using beta values from all available probes in the DLC1 variant 2 A., D., G. DLC2 alpha, variant 1 B., E., H. and DLC3 beta variant 3 C., F., I. (sequence details in Figure S2).
TP53 mutation is associated with low DLC1 expression in cancer
We evaluated whether altered expression of any of the three DLC genes in the cancers might be associated with mutations in TP53, one of the most commonly mutated genes in cancer [26]. Among 520 and 178 TCGA patients with LAD and LSC, there were 276 (53%) and 141 cases (79%), respectively, with at least one TP53 mutation (including frame shift deletions, frame shift insertions, in-frame deletions, missense mutations, nonsense mutations, and splice site mutations). DLC1 expression was lower in patients with TP53 mutations than in patients with wild TP53 (Figure 6) in LAD and LSC. Expression of DLC2 and DLC3 was also lower in patients with mutant TP53, although not to the same degree as with DLC1.
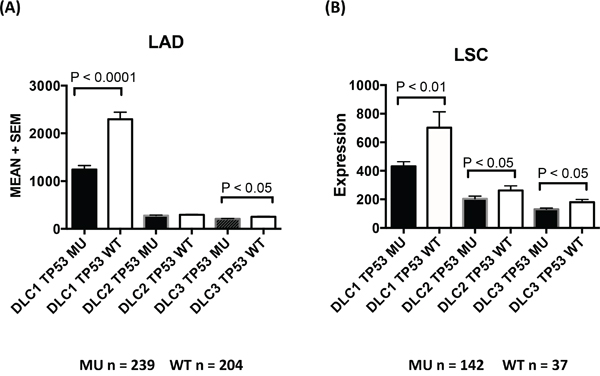
Figure 6: TP53 mutation and DLC expression in lung adenocarcinoma and lung squamous cell carcinoma. TCGA LAD A. and LSC B. datasets. DLC expression levels (mean + standard error) are plotted against groups of patients with or without TP53 mutations. MU = TP53 mutation. WT = TP53 wild type.
Further analysis of the TCGA dataset showed that DLC1 down-regulation and TP53 mutation were found more frequently in current smokers with LAD. Fifty-five percent of current smokers had low DLC1 expression and TP53 mutations, while only 29% of former smokers and 20% never smokers had this phenotype. The combination of low DLC1 and TP53 mutation in current smokers was more frequent than that of low DLC2 or DLC3 and TP53 mutation (Figure S5A). Although the Director’s Challenge Lung Study cohort dataset does not have information about p53 status, the smoking history of the patients is known. Consistent with the TCGA dataset, analysis of this cohort showed that the average expression among non-smokers (never smokers and former smokers combined) was 1.6-fold higher for DLC1 compared to current smokers (P < 0.01) (Figure S5B). There was no significant difference for expression of any DLC gene between never-smokers and former smokers.
DLC1, DLC2, and DLC3 have comparable biological activities
To determine whether the three DLC genes have comparable biological activity, we analyzed two LAD cell lines (H1299 and H358) that had been stably transfected with constructs expressing DLC1, DLC2, and DLC3. Each DLC gene encoded the same epitope tag (GFP), to be able to verify that the transfectants expressed similar levels of the respective DLC protein. The level of RhoA-GTP was reduced to a similar degree in cells expressing DLC1, DLC2, or DLC3, when compared to cells transfected with vector only (Figure 7A and 7C). In addition, compared to the control cells, the migration rate of the cells expressing the each DLC gene was slowed to a similar degree (Figure 7B and 7D), as was the anchorage-independent cell growth in soft agar (Figure 7E). The results suggest that these biochemical and biological activities are comparable between the three DLC genes when expressed in cultured cells.
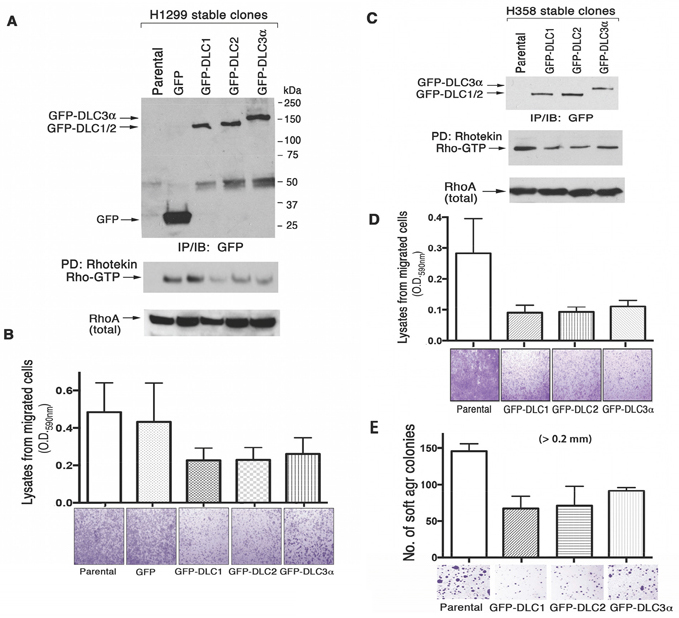
Figure 7: DLC RhoGAP and bioactivity in transfected human lung cancer cell lines. GFP-tagged DLC1, DLC2 and DLC3α constructs have been stably transfected into H1299 A. and B. and H358 C., D. and E. cells. The expression of GFP or GFP-DLCs in the established stable clones has been analyzed by IP followed by IB with anti-GFP antibody. RhoGAP activity was measured by Rhotekin pull-down assay (A and C). In the cell migration assay, the migrated H1299 and H358 transfectants in the botom chamber of 24 well inserts were stained and photographed using a light microscope. The quantitation was performed colorometrically as described in materials and methods (B and D). Equal numbers of H358 stably transfected cells were seeded in soft agar for growth and quantitation as shown to compare the effect of anchorage-independent cell growth (E).
DISCUSSION
We have used detailed information from TCGA and another cancer database, together with experimental analysis, to evaluate the relative role of the three DLC genes in five tumor types: LSC, LAD, breast cancer, HCC, and colorectal cancer. This assessment, which has been made possible by the TCGA database, has led to several main observations. First, DLC1 is more highly expressed than DLC2 and DLC3 in most of the normal tissues examined. Second, except for colorectal cancer, DLC1 is down-regulated to a greater degree in the tumors, in terms of both the magnitude of the reduction and the fold-reduction compared with DLC1 expression in the respective normal tissue, than the other two family members. Third, the reduced expression of DLC1 in LSC and LAD was frequently associated with promoter methylation, while this reduction was frequently associated with DLC1 copy number loss in HCC. Fourth, under normal growth conditions, the three DLC genes negatively regulate Rho-GTP levels and inhibit cell migration and anchorage-independent growth to a similar degree. These observations strongly suggest that the reduced DLC1 levels in tumors have a greater impact on the biological properties of the tumor types examined than do those of DLC2 or DLC3.
The three DLC genes share a similar genomic organization and are closely related evolutionarily. The DLC1 and DLC2 amino acid sequences are 58% identical, and are, respectively, 44% and 52 % identical to DLC3 (9, 12). Previous reports have suggested that DLC1 is the most widely expressed of the three DLC genes, followed by DLC2, and DLC3, which has a more limited tissue distribution [9, 27]. Here, our analysis found that all three genes are expressed in the four normal tissues examined: lung, breast, liver, and colorectum. The level of DLC1 expression varied considerably between these tissues; it was more than 10 times higher in normal lung than in normal colorectum. Despite this wide range, it was higher than DLC2 in each of the tissues except for colorectum, where expression of DLC1 and DLC2 was similar, and it was substantially higher than DLC3 in all four tissues. Taken together, these observations suggest DLC1 may be the most critical of the three genes for normal physiology, which is consistent with its requirement for fetal development [28-29], in contrast to DLC2 [30] and DLC3 [31]. However, DLC2 and DLC3 may have cell type-specific functions, such as the role of DLC2 in pancreatic physiology [32].
When the tumors were analyzed for their expression of the three DLC genes, the most striking results were seen in the lung. The mean expression of DLC1 in LSC and LAD was reduced about 24–fold and 10-fold, respectively, compared with its expression in the normal lung. Although DLC2 and DLC3 expression was also reduced in both forms of lung cancer, the fold-reduction of DLC1 in each tumor type was more than twice that of DLC2 or DLC3. Because the expression of DLC1 in the non-tumor tissue was so much higher than that of DLC2 and DLC3, the magnitude of the reduction in the number of DLC1 RNA molecules in the tumors was far larger than that of the reduction in the number of DLC2 and DLC3 RNA molecules.
Given our experimental in vitro findings that the biological activities of DLC1, DLC2, and DLC3 appear to be similar, we conclude that the biology of changes in DLC1 expression are more relevant to the lung tumors than are those in the other two family members. This conclusion is further supported by prognostic data from an LAD cohort, whose patient outcomes are more completely annotated than those of the TCGA tumors. In that cohort, the patients whose DLC1 expression was below the median had a poorer prognosis than those whose DLC2 or DLC3 expression was below the median for those genes. However, reduced expression of DLC2, but not DLC3, was associated with a poorer outcome, although not to the same degree as reduced DLC1 expression.
Reduced expression of the DLC genes in cancer has been attributed to several mechanisms. They include gene deletion [8, 12-13, 33], increased promoter methylation [12-13], histone deacetylation [34], histone methylation [35], and decreased protein stability [36]. Prior to the molecular identification of DLC1, cytogenetic analysis had indicated that chromosome 8p22, where DLC1 is located, was frequently deleted in HCC [37]. Our results indicate that copy number loss of DLC1 occurred about twice as frequently in HCC (48%) as in LSC (25%) or LAD (20%). Compared with DLC1, copy number loss of DLC2 was less common in HCC (22%), LSC (16%) and LAD (9%). DLC1 and DLC2 copy number loss percentages in the TCGA breast carcinoma dataset were 33% and 18% respectively (data not shown). No DLC3 copy number losses were found in any of the tumors examined in this study, although losses at the DLC3/STARD8 locus at Xq13 have been reported in ovarian carcinomas [38]. As expected, copy number loss of DLC1 was found to be associated with its reduced expression. Since almost one-half of the HCC cases had DLC1 copy number changes, this mechanism may be a major factor driving the reduced expression of DLC1 in this tumor type.
The less frequent DLC1 copy number losses in LSC and LAD suggest that other mechanisms contribute to the decreased DLC1 expression in these tumors. Consistent with this possibility, in LSC, the level of CpG methylation at the DLC1 promoter was increased, and this increase was associated with reduced DLC1 expression. DLC1 methylation was also increased in LAD, but to a lesser extent than in LSC. No increase in DLC1 methylation was observed in HCC. Thus, HCC tumors are more likely to present with DLC1 copy number loss than with promoter hypermethylation, while the situation is reversed in LSC and LAD. The differences in methylation of the promoter regions of DLC2 and DLC3 were less substantial than those observed with the DLC1 promoter. In addition, data from Yuan at al. [39] have shown that the DLC1 promoter is methylated in some of the NSCLC cell lines that do not express DLC1 mRNA, and can be re-activated by treatment with azacytidine.
Our results show an association of low DLC1 levels with TP53 mutations in the lung tumors, and the combination of low DLC1 expression and TP53 mutation was more prevalent in current smokers. An association between TP53 mutations and expression of the other DLC family members is not striking. Mutations in TP53 are common in smoking-related cancers [40] and occur more frequently in lung tumors from smokers [41]. Inactivation or mutation of TP53 is reported to lead to increased Rho GTPase signaling and to the acquisition of a more aggressive, invasive phenotype in tumor cells [42]. Further analysis of the links between TP53 and DLC1 expression in cancer may help to elucidate how dysregulation of the p53 and RhoA pathways might cooperate to promote oncogenesis.
We conclude that in several cancers DLC1 is the principal biologically-relevant down-regulated DLC family member, although down-regulation of DLC2 and DLC3 is also observed. This conclusion, which parallels the physiologic observation that DLC1 is essential for fetal development, while DLC2 and DLC3 are dispensable, implies that analyses of the DLC genes in cancer analyses should focus preferentially on DLC1.
MATERIALS AND METHODS
Bioinformatics analysis
The analyses reported in this study employed data from The Cancer Genome Atlas (TCGA, http://cancergenome.nih.gov) and caArray (https://array.nci.nih.gov/caarray/home.action) of National Cancer Institute (NCI), both of which are publicly available. RNA expression (RNA-Seq Version 2), somatic mutation and clinical data (October 2015 release) were downloaded directly from TCGA portal. A cohort from caArray that contains lung adenocarcinomas (jacob-00182) [17] was downloaded, and the CEL files with raw data were normalized using 3′ Expression Arrays Robust Multi-array Analysis (RMA) from the Affymetrix software Expression Console (http://www.affymetrix.com). The normalized expression values represent the probe set intensity on a log-2 scale.
Gene expression comparison (level in normal tissue vs. tumor tissue fold change), Mann-Whitney U test, Kaplan-Meier survival analysis, and Chi Square test (chisq.test) were carried out using the open source statistical tool R (version 2.14.1), Prism program (version 6.0e, GraphPad Software, Inc.), or Microsoft Excel. P value < 0.05 is considered as statistically significant.
For survival analysis and smoking-related analysis, values higher or lower than the median in each gene group were categorized, respectively, as “high” or “low.” All survival times were adjusted to months.
TCGA DLC copy number variation (CNV) data (log2 value) were derived from The cBio Cancer Genomics Portal (cBioPortal) [18-19]. The value < -0.5 was designated as copy number loss.
DLC methylation data were directly downloaded from TCGA DNA methylation level 3 data sets. TCGA uses results generated with the Illumina HumanMethylation450 BeadChip to report the methylation status of the promoter regions of the DLC1 variant 2, DLC2 alpha, variant 1, and DLC3 beta, variant 3 transcripts, which are analogous to the variant 2 transcript of DLC1. When the average beta values (estimate of methylation level using ratio of intensities between methylated and unmethylated alleles) of all detected methylation sites were calculated, the DLC promoter regions (9, 9, and 10 sites for DLC1, DLC2, and DLC3, respectively) in LSC, LAD, and HCC and their respective controls were compared.
Transfection and RhoA activation assay
The detailed methods for transfection and the RhoA activation assay were described previously [20]. Briefly, H1299 and H358 cells were stably transfected with vectors that express green fluorescent protein (GFP)-tagged human DLC1, DLC2 (gift from Dr. Michael Mowat, Manitoba Institute of Cell Biology, Canada), or DLC3 [20], as well as pEGFP (Clontech Laboratories, Inc.). Cell extracts were collected using magnesium lysis buffer (EMD Millipore) supplemented with 1 mM Na3VO4 and protease inhibitor mixture tablet (Roche Diagnostics). Equal amounts of protein lysates were used for pull-down by Rhotekin RBD agarose (EMD Millipore). The pellets were washed three times with lysis buffer, resuspended in Laemmli sample buffer, and then separated by 15% SDS/PAGE. Anti-RhoA antibody (EMD Millipore) was used for immunobloting to detect RhoGTP, and anti-GFP antibody was used to detect GFP-tagged DLCs and the GFP control. For each blot, horseradish peroxidase-conjugated anti-rabbit or anti-mouse immunoglobulin A/G (GE Healthcare) was used for the second reaction at 1:10,000 dilution. Immunocomplexes were visualized by enhanced chemiluminescence (ECL), using an ECL kit (GE Healthcare).
Cell migration assay and soft agar colony growth assay
The cell migration assay was performed using transwell inserts as described previously [21]. Briefly, equal numbers (4X10⁴) of transfected H1299 cells expressing GFP or GFP-tagged DLC1, DLC2 and DLC3 were added to the upper chamber of a 24-well plate. The cells were incubated at 37C° and permitted to migrate to the lower chamber for 16 hours. The cells on the lower surface of the filter were fixed with methanol, stained with 0.5% crystal violet, and examined in a dissecting microscope at high (20X) and low (4X) power. Each experiment was repeated three times. For quantitation, stained membranes were incubated in 1% Triton-X100 solution, and the optical density was measured with a spectrophotometer at 590nm.
For soft agar colony assays, 1 × 10⁵ cells were mixed with complete medium containing 0.4% agar (Difco) and placed over 0.6% basal agar in 60-mm dishes. Cells were grown for 3 weeks, and colonies were photographed microscopically and quantified with a colony counter after staining with 1 mg/ml Nitrotetrazolium Blue Chloride (Sigma-aldrich).
ACKNOWLEDGMENTS
The authors thank Julia Zhang of The Cancer Genome Atlas (National Cancer Institute and National Human Genome Research Institute, NIH) for her assistance.
CONFLICTS OF INTEREST
The authors declare no potential conflicts of interest
FUNDING
This work was supported by the Intramural Research Program of the Center for Cancer Research, National Cancer Institute, NIH
REFERENCES
1. Jaffe AB, Hall A. Rho GTPases: biochemistry and biology. Annu Rev Cell Dev. Biol. 2005; 21:247-269.
2. Vega FM, Ridley AJ. Rho GTPases in cancer cell biology. FEBS Lett. 2008; 582:2093-2101.
3. Gómez del Pulgar T, Benitah SA, Valerón PF, Espina C, Lacal JC. Rho GTPase expression in tumourigenesis: evidence for a significant link. Bioessays. 2005; 27:602-613.
4. Cox AD, Der CJ. Ras history: The saga continues. Small GTPases. 2010; 1:2-27.
5. Lawrence MS, Stojanov P, Mermel CH, Robinson JT, Garraway LA, Golub TR, Meyerson M, Gabriel SB, Lander ES, Getz G. Discovery and saturation analysis of cancer genes across 21 tumour types. Nature. 2014; 505:495-501.
6. Vigil D, Cherfils J, Rossman KL, Der CJ. Ras superfamily GEFs and GAPs: validated and tractable targets for cancer therapy? Nat Rev Cancer. 2010; 10:842-857.
7. Yuan BZ, Miller MJ, Keck CL, Zimonjic DB, Thorgeirsson SS, Popescu NC. Cloning, characterization, and chromosomal localization of a gene frequently deleted in human liver cancer (DLC-1) homologous to rat RhoGAP. Cancer Res. 1998; 58:2196-2199.
8. Ching YP, Wong CM, Chan SF, Leung TH, Ng DC, Jin DY, Ng IO. Deleted in liver cancer (DLC) 2 encodes a RhoGAP protein with growth suppressor function and is underexpressed in hepatocellular carcinoma. J Biol Chem. 2003; 278:10824-10830.
9. Durkin ME, Ullmannova V, Guan M, Popescu NC. Deleted in liver cancer 3 (DLC-3), a novel Rho GTPase-activating protein, is downregulated in cancer and inhibits tumor cell growth. Oncogene. 2007; 26:4580-4589.
10. Healy KD, Hodgson L, Kim TY, Shutes A, Maddileti S, Juliano RL, Hahn KM, Harden TK, Bang YJ, Der CJ. DLC-1 suppresses non-small cell lung cancer growth and invasion by RhoGAP-dependent and independent mechanisms. Mol Carcinog. 2008; 47:326-337.
11. Kawai K, Kiyota M, Seike J, Deki Y, Yagisawa H. START-GAP3/DLC3 is a GAP forRhoA and Cdc42 and is localized in focal adhesions regulating cell morphology. Biochem Biophys Res. Commun. 2007; 364:783-789.
12. Durkin ME, Yuan BZ, Zhou X, Zimonjic DB, Lowy DR, Thorgeirsson SS, Popescu NC. DLC-1: a Rho GTPase-activating protein and tumour suppressor. J Cell Mol Med. 2007; 11:1185-1207.
13. Lukasik D, Wilczek E, Wasiutynski A, Gornicka B. Deleted in liver cancer protein family in human malignancies (Review). Oncol Lett. 2011; 2:763-768.
14. Xue W, Krasnitz A, Lucito R, Sordella R, Vanaelst L, Cordon-Cardo C, Singer S, Kuehnel F, Wigler M, Powers S, Zender L, Lowe SW. DLC1 is a chromosome 8p tumor suppressor whose loss promotes hepatocellular carcinoma. Genes Dev. 2008; 22:1439-1444.
15. Qian X, Durkin ME, Wang D, Tripathi BK, Olson L, Yang XY, Vass WC, Popescu NC, Lowy DR. Inactivation of the Dlc1 gene cooperates with downregulation of 15INK4b and p16Ink4a, leading to neoplastic transformation and poor prognosis in human cancer. Cancer Res. 2012; 72:5900-5911.
16. El-Sitt S, El-Sibai M. The STAR of the DLC family. J Recept Signal Transduct Res. 2013; 33:10-13.
17. Director's Challenge Consortium for the Molecular Classification of Lung Adenocarcinoma, Shedden K, Taylor JM, Enkemann SA, Tsao MS, Yeatman TJ, Gerald WL, Eschrich S, Jurisica I, Giordano TJ, Misek DE, Chang AC, Zhu CQ, et al. Gene expression-based survival prediction in lung adenocarcinoma: a multi-site, blinded validation study. Nat Med. 2008; 14:822-827.
18. Gao J, Aksoy BA, Dogrusoz U, Dresdner G, Gross B, Sumer SO, Sun Y, Jacobsen A, Sinha R, Larsson E, Cerami E, Sander C, Schultz N. Integrative analysis of complex cancer genomics and clinical profiles using the cBioPortal. Sci Signal. 2013; 6:pl1.
19. Cerami E, Gao J, Dogrusoz U, Gross BE, Sumer SO, Aksoy BA, Jacobsen A, Byrne CJ, Heuer ML, Larsson E, Antipin Y, Reva B, Goldberg AP, et al. The cBio cancer genomics portal: an open platform for exploring multidimensional cancer genomics data. Cancer Discov. 2012; 2:401-404.
20. Qian X, Li G, Asmussen HK, Asnaghi L, Vass WC, Braverman R, Yamada KM, Popescu NC, Papageorge AG, Lowy DR. Oncogenic inhibition by a deleted in liver cancer gene requires cooperation between tensin binding and Rho-specific GTPase-activating protein activities. Proc Natl Acad Sci USA. 2007; 104:9012-2017.
21. Qian X, Li G, Vass WC, Papageorge A, Walker RC, Asnaghi L, Steinbach PJ, Tosato G, Hunter K, Lowy DR. The Tensin-3 protein, including its SH2 domain, is phosphorylated by Src and contributes to tumorigenesis and metastasis. Cancer Cell. 2009; 16:246-258.
22. Du X, Qian X, Papageorge A, Schetter AJ, Vass WC, Liu X, Braverman R, Robles AI, Lowy DR. Functional interaction of tumor suppressor DLC1 and caveolin-1 in cancer cells. Cancer Res. 2012; 72:4405-4416.
23. Birnbaum D, Adélaïde J, Popovici C, Charafe-Jauffret E, Mozziconacci MJ, Chaffanet M. Chromosome arm 8p and cancer: a fragile hypothesis. Lancet Oncol. 2003; 4:639-642.
24. Leung TH, Ching YP, Yam JW, Wong CM, Yau TO, Jin DY, Ng IO. Deleted in liver cancer 2 (DLC2) suppresses cell transformation by means of inhibition of RhoA activity. Proc Natl Acad Sci U S A. 2005; 102:15207-15212.
25. Low JS, Tao Q, Ng KM, Goh HK, Shu XS, Woo WL, Ambinder RF, Srivastava G, Shamay M, Chan AT, Popescu NC, Hsieh WS. A novel isoform of the 8p22 tumor suppressor gene DLC1 suppresses tumor growth and is frequently silenced in multiple common tumors. Oncogene. 2011; 30:1923-1935.
26. Hamroun D, Kato S, Ishioka C, Claustres M, Béroud C, Soussi T. The UMD TP53 database and website: update and revisions. Hum Mutat. 2006; 7:14-20.
27. Csépányi-Kömi R, Sáfár D, Grósz V, Tarján ZL, Ligeti E. In silico tissue-distribution of human Rho family GTPase activating proteins. Small GTPases. 2013; 4:90-101.
28. Durkin ME, Avner MR, Huh CG, Yuan BZ, Thorgeirsson SS, Popescu NC. DLC-1, a Rho GTPase-activating protein with tumor suppressor function, is essential for embryonic development. FEBS Lett. 2005; 579:1191-1196.
29. Sabbir MG, Wigle N, Loewen S, Gu Y, Buse C, Hicks GG, Mowat MR. Identificationand characterization of Dlc1 isoforms in the mouse and study of the biological function of a single gene trapped isoform. BMC Biol. 2010; 8:17.
30. Lin Y, Chen NT, Shih YP, Liao YC, Xue L, Lo SH. DLC2 modulates angiogenic responses in vascular endothelial cells by regulating cell attachment and migration. Oncogene. 2010; 29:3010-3016.
31. http://www.mousephenotype.org/data/genes/MGI:2448556
32. Petzold KM, Naumann H, Spagnoli FM. Rho signaling restriction by the RhoGAP Stard13 integrates growth and morphogenesis in the pancreas. Development. 2013; 140:126-135.
33. de Tayrac M, Etcheverry A, Aubry M, Saïkali S, Hamlat A, Quillien V, Le Treut A, Galibert MD, Mosser J. Integrative genome-wide analysis reveals a robust genomic glioblastoma signature associated with copy number driving changes in gene expression. Genes Chromosomes Cancer. 2009; 48:55-68.
34. Kim TY, Jong HS, Song SH, Dimtchev A, Jeong SJ, Lee JW, Kim TY, Kim NK, Jung M, Bang YJ. Transcriptional silencing of the DLC-1 tumor suppressor gene by epigenetic mechanism in gastric cancer cells. Oncogene. 2003; 22:3943-3951.
35. Au SL, Wong CC, Lee JM, Wong CM, Ng IO. EZH2-Mediated H3K27me3 Is Involved in Epigenetic Repression of Deleted in Liver Cancer 1 in Human Cancers. PLoS One. 2013; 8:e68226.
36. Kim TY, Jackson S, Xiong Y, Whitsett TG, Lobello JR, Weiss GJ, Tran NL, Bang YJ, Der CJ. CRL4A-FBXW5-mediated degradation of DLC1 Rho GTPase-activating protein tumor suppressor promotes non-small cell lung cancer cell growth. Proc Natl Acad Sci USA. 2013; 110:16868-16873.
37. Emi, M, Fujiwara Y, Ohata H, Tsuda H, Hirohashi S, Koike M, Koike M, Miyaki M, Monden M, Nakamura Y. Allelic loss at chromosome band 8p2l.3-p22 is associated with progression of hepatocellular carcinoma. Genes Chromosomes Cancer. 1993; 7:152-157.
38. Kamieniak MM, Muñoz-Repeto I, Rico D, Osorio A, Urioste M, García-Donas J, Hernando S, Robles-Díaz L, Ramón Y Cajal T, Cazorla A, Sáez R, García-Bueno JM, Domingo S, Borrego S, et al. DNA copy number profiling reveals extensive genomic loss in hereditary BRCA1 and BRCA2 ovarian carcinomas. Br J Cancer. 2013; 108:1732-1742.
39. Yuan BZ, Jefferson AM, Baldwin KT, Thorgeirsson SS, Popescu NC, Reynolds SH. DLC-1 operates as a tumor suppressor gene in human non-small cell lung carcinomas. Oncogene. 2004; 23:1405-1411.
40. Pfeifer GP, Denissenko MF, Olivier M, Tretyakova N, Hecht SS, Hainaut P. Tobacco smoke carcinogens, DNA damage and p53 mutations in smoking-associated cancers. Oncogene. 2002; 21:7435-7451.
41. Liu X, Lin XJ, Wang CP, Yan KK, Zhao LY, An WX, Liu XD. Association between smoking and p53 mutation in lung cancer: a meta-analysis. Clin Oncol (R Coll Radiol). 2014; 26:18-24.
42. Zhang C, Liu J, Liang Y, Wu R, Zhao Y, Hong X, Lin M, Yu H, Liu L, Levine AJ, Hu W, Feng Z. Tumour-associated mutant p53 drives the Warburg effect. Nat Commun. 2013; 4:2935.