
INTRODUCTION
Neuroblastoma (NB) is one of the most common extracranial solid tumors in infancy. These tumors occur most frequently in the adrenal medulla, but can originate anywhere along the sympathetic nervous system [1]. NB cells exhibit similar characteristics to undifferentiated cells and often metastasize to distant organs [2]. Approximately 60% of patients diagnosed with NB display a late disease stage and have very poor prognosis. Patients with high-risk NB have a five-year survival rate of less than 50%, even with aggressive therapy [3]. Several genetic alterations are commonly found in NB cells, including MYCN amplification, 1p deletion, 11q deletion, and 17q gain, and these are often associated with high-risk tumors and an unfavorable outcome [4–7]. Understanding the molecular mechanisms underlying these genetic alterations might therefore be helpful for the development of NB risk assessment and therapy.
MYCN is one of the best-known prognostic markers of NB. MYCN amplification is detected in approximately 25% of NB tumors [8]. Patients with NB tumors containing a single copy of MYCN usually have a favorable prognosis, whereas amplification and/or MYCN overexpression result in rapid disease progression and a high mortality rate [6]. MYCN belongs to the Myc family of proto-oncogenes, which have a conserved structure, including a transcriptional activation domain at the N-terminus and a basic-helix-loop-helix-zipper (bHLHZ) domain at the C-terminus. MYCN is primarily known to act as an activator by heterodimerizing with MAX to bind specific E-box DNA motifs (CANNTC). Recently, however, MYCN has also been shown to have the ability to repress the transcription of target genes through the recruitment of corepressors [9]. For example, through interaction with SP1 and MIZ1 at promoters, MYCN silences gene expression via recruitment of the histone deacetylase HDAC1 [10]. The target genes of MYCN are involved in diverse cellular functions in malignancy, including cell cycle, apoptosis, proliferation, pluripotency, differentiation, angiogenesis and immune surveillance [11].
In addition to protein-coding genes, MYCN has also been shown to bind to the promoter region of a wide range of microRNAs for regulation of their expression in NB. MicroRNAs (miRNAs) are short non-coding RNAs of 20–24 nucleotides that play important roles in many biological pathways via post-transcriptional regulation of their target mRNAs. Many studies have reported that the dysregulation of some miRNAs is associated with the pathobiology of many cancer types, including NB [12–15]. Several oncogenic miRNAs, such as the miR-17-92 cluster, are directly activated by MYCN to promote cell proliferation and inhibit apoptosis [13]. MYCN also inhibits several tumor suppressor miRNAs, such as miR-184 [12]. These findings indicate that MYCN can exert both transcriptional and post-transcriptional regulation on its targets.
It is thus clear that MYCN is the most important NB therapeutic target. However, because of the pleiotropic effects of MYCN and the difficulty in drugging transcription factors, it has been challenging to design therapeutic strategies that directly target MYCN [16]. An alternative approach is to develop drugs that inactivate MYCN partners or transcriptional targets [17]. To this end, integration of various regulatory interactions and the construction of comprehensive MYCN regulatory networks in NB are required. A few studies have used integrative omics approaches to identify the critical regulators or effector of MYCN in NB and potential therapeutic targets [18, 19]. In this study, we performed chromatin immunoprecipitation following by sequencing (ChIP-seq) and small RNA sequencing to identify MYCN binding sites and MYCN-associated miRNAs, and then used an integrative approach to dissect the MYCN regulatory networks.
RESULTS AND DISCUSSION
MYCN-regulated genes involved in diverse roles in neuroblastoma
To identify MYCN binding sites across the genome, we performed ChIP-seq using anti-MYCN and anti-IgG antibodies in a MYCN-amplified NB cell line, SK-N-BE(2)-C. After read alignment and peak calling, a total of 72,737 regions were significantly enriched. To obtain high-confidence MYCN binding sites, the enriched regions had to be overlapped with the binding sites of other transcription factors or regulators derived from the ENCODE project. Finally, 22,526 MYCN binding regions (positive peaks) were identified.
We compared the MYCN binding regions to the other studies (Supplementary Table S1) and found that 40% of MYCN binding regions identified in the other cell lines were overlapped by that we identified (Supplementary Figure S1). In addition, several known MYCN-regulated genes (NME2 [20], CRABP2 [21], LIF [22], MDM2 [23], MIR17HG [24], PRMT1 [25], MCM7 [26], MCM8 [26], ODC1 [27], BIRC5 [28], LUC7L [29], TWIST1 [30], RAB5C [31], AURKA [31], H1F0 [31], and MYBL2 [32]) were successfully detected in the ChIP-seq experiments (Supplementary Figure S2). To study the distribution of MYCN binding around promoter sequences, we aligned the peaks with the annotated transcriptional start sites (TSSs), which were provided by RefSeq. Most of the MYCN binding sites were concentrated around TSSs, within –1 kb to +1 kb (Figure 1A), consistent with previous studies on MYCN [29, 31, 33]. Additionally, some of the MYCN binding sites were verified using ChIP-qPCR (Figure 1B). Together, these results confirm the validity of our ChIP-seq experiments.
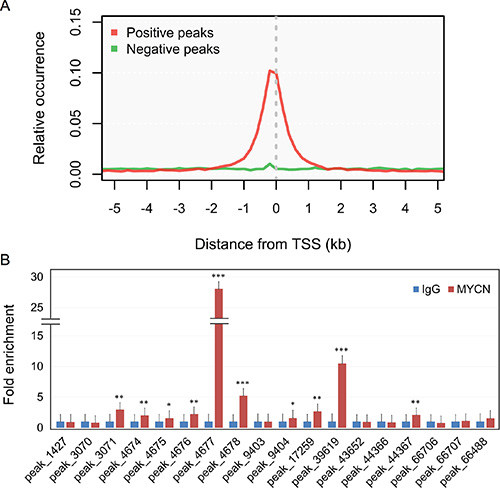
Figure 1: Distribution and validation of MYCN binding sites. (A) Relative occurrence of MYCN binding peaks per 200-bp bin corresponding to the 5-kb region flanking all annotated TSSs. Positive and negative peaks denote the binding regions with and without other regulatory bindings, respectively, based on the ChIP-seq experiments of the ENCODE project. (B) ChIP-qPCR validation of MYCN binding to genomic regions associated with the promoters of miRNAs or miRNA-hosted genes identified in the ChIP-seq experiment. Ten out of 18 selected sites could be validated by a single gene. Error bars represent SD; n = 3; two-tailed Student t-test: *p < 0.05, **p < 0.01, ***p < 0.001.
Since the exact promoter region for each gene was unclear, we used a broad window to determine the MYCN-bound genes. According to the known MYCN-regulated genes (Supplementary Figure S2), if an MYCN binding site fell within −10 kb or +2 kb of a TSS, it was defined as an MYCN-bound gene. A total of 8,760 MYCN-bound genes were identified. To clarify the regulation of the MYCN-bound genes, we used the NB gene expression data to infer gene regulation of MYCN. We calculated the Spearman correlation coefficient between MYCN and other genes, and selected the genes that were strongly positively or negatively correlated with MYCN, i.e. |Spearman correlation coefficient| ≥ 0.3 for both profiling methods. A total of 700 MYCN-positively correlated genes and 1424 MYCN-negatively correlated genes were identified (Supplementary Table S2). Merging the MYCN-bound genes and the MYCN-correlated genes, we obtained 874 direct transcriptional MYCN targets, hereafter termed MYCN-regulated genes (Figure 2A). Based on the direction of the regulation, these genes were classified into 339 MYCN-activated genes and 535 MYCN-repressed genes (Supplementary Table S3). Some of these MYCN-regulated genes are also detected by the other studies (Supplementary Figure S3).
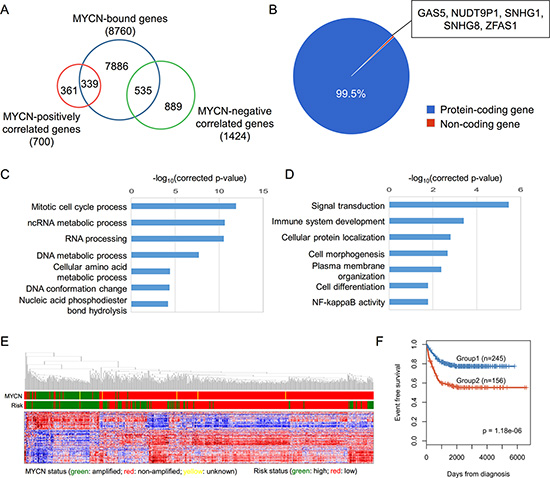
Figure 2: Systematic analysis of MYCN-regulated genes. (A) Identification of MYCN-regulated genes based on the overlap of MYCN-bound genes and MYCN-correlated genes. (B) Pie chart depicting the percentage of different classes of MYCN-regulated genes. (C, D) GO analysis of MYCN-activated (C) and MYCN-repressed (D) genes. (E) A hierarchical clustering graph representing the association between the expression of MYCN-regulated genes and MYCN, as well as risk status. Data from SEQC RNA-seq are represented as a Pearson correlation metric with average linkage. (F) Kaplan-Meier survival curves of MYCN-non-amplified NB patient groups defined by k-means clustering of expression of 874 MYCN-regulated genes. The graph depicts the p-value as obtained from the Log-rank test. Numbers in parentheses are the number of patients in each group.
The majority of the MYCN-regulated genes were protein-coding genes, but there were five non-coding genes: NUDT9P1, GAS5, SNHG1, SNHG8, and ZFAS1 (Figure 2B). Interestingly, expression of NUDT9P1 and SNHG1 was associated with the prognosis of MYCN-non-amplified NB patients (Supplementary Figure S4). Additionally, GAS5 and ZFAS1 have been identified as oncogenes or tumor suppressor genes in other cancer types [34, 35]. These MYCN-driven non-coding genes might also play critical roles in NB carcinogenesis.
To investigate the principal pathways in which the MYCN-regulated genes are involved, we performed a GO enrichment analysis using a Cytoscape plugin, ClueGO [36]. The MYCN-activated genes were enriched in the regulation of the cell cycle and RNA processing, and the MYCN-repressed genes were significantly related to the processes of signal transduction, cell morphogenesis and cell differentiation (Figure 2C and 2D). These data reveal that MYCN has pleiotropic roles in NB.
MYCN-regulated genes have prognostic value in NB patients with MYCN-non-amplification
An unsupervised clustering analysis of the MYCN-regulated genes indicated that the expression signatures of MYCN-regulated genes were strongly associated with MYCN status and NB risk type (Figure 2E). Although MYCN amplification is well known to be a poor prognostic marker in NB, we wondered whether these signatures could be used to identify subtypes of MYCN-non-amplified NB patients. We performed robust k-means clustering (k = 2) over the MYCN-regulated genes to separate MYCN-non-amplified patients into two groups and Kaplan-Meier analysis to compare the survival rate. Kaplan-Meier curves revealed that the event-free survival rates differed significantly between the two groups (Log-rank test, p = 1.18E−6; Figure 2F). This suggests that MYCN is involved in tumorigenesis of MYCN-non-amplified NB.
The complexity of MYCN regulatory networks via regulating other transcription factors
Notably, only ~41% of the MYCN-correlated genes were bound by MYCN. This suggests that the remaining MYCN-correlated genes were regulated by other TFs driven by MYCN. To clarify these relationships, we obtained 1,484 TFs or proteins containing DNA binding domains from UniProt, and found that a significant proportion of the MYCN-regulated genes coded for TFs or proteins with a DNA binding domain (107 out of 874, p < 0.001, hypergeometric test). Furthermore, we examined the correlation between the expression of MYCN-regulated TFs and MYCN-correlated genes. If the MYCN-correlated genes were also regulated by MYCN-regulated TFs, their expression would be strongly correlated with that of the TFs. We computed the Spearman correlation coefficients between the MYCN-correlated genes and the TFs as a measure of their expression correlation. In total, 107 MYCN-regulated TFs tended to have significantly higher correlations with MYCN-correlated genes than with non-MYCN-correlated genes (Supplementary Figure S5). Based on the same criterion as before (|Spearman correlation coefficient| ≥ 0.3 for both profiling methods) to identify the correlations, each MYCN-correlated gene was coexpressed with at least one MYCN-regulated TF (Supplementary Table S2). This indicates that the MYCN-correlated genes without MYCN-bound signals were regulated indirectly by MYCN.
Association of MYCN binding sites with gene regulation
We then investigated whether the MYCN binding sites could reveal the role of MYCN in the genes it regulates. First, we re-examined the distribution of MYCN binding relative to genes and found that the MYCN binding sites were significantly enriched on the TSSs of MYCN-activated genes, relative to those of MYCN-repressed genes (p < 0.001, KS test; Figure 3A). This suggests that MYCN binds preferentially to up-regulated genes [33]. Next, we used the MYCN binding sequences to further address the sequence specificity of MYCN regulation. We examined all possible variants of the generic E-box motif (CANNTG). Significance was assessed using the p-value derived from Fisher’s exact test. As illustrated in Figure 3B, we found that MYCN exhibited significant selection of the CACGTG (p = 4.6E–7) and CACGCG (p = 0.038) motifs in the promoters of MYCN-activated genes. However, none of the motifs were enriched in the promoters of MYCN-repressed genes. In c-MYC, the top two high-affinity binding motifs are CACGTG and CACGCG [37], identical to the enriched motifs in the MYCN-activated promoters. This indicates that MYCN behaves principally as an activator, while repressing its target genes by interacting or cooperating with other regulators.
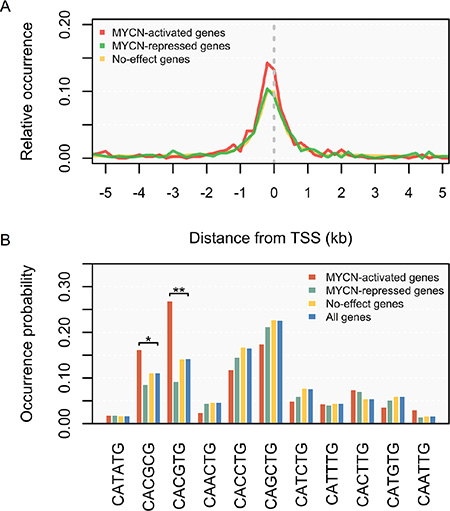
Figure 3: Distribution of MYCN binding and binding E-box sequences according to the direction of regulation by MYCN. (A) Distance distribution of MYCN binding sites relative to transcription start sites (TSSs). Relative occurrence of MYCN binding peaks per 200-bp bin corresponding to the 5-kb region flanking the TSSs of MYCN-activated genes (red), MYCN-repressed genes (green), and no-effect genes (yellow). (B) Usage of E-box sequences by MYCN. Wilcoxon signed-rank test: *p < 0.05, **p < 0.01.
Gene regulation by MYCN is coordinated with other regulators
MYCN might regulate gene expression by interacting or cooperating with other regulators. To understand the MYCN regulatory network in NB, it is necessary to identify MYCN’s co-regulators. We proposed a computational method to infer potential MYCN co-regulators (Figure 4A). The main concept of this method is that the presence or absence of a co-regulator might alter the correlation between MYCN and its regulated genes. Using a p-value threshold of 0.05 and a consistent correlation pattern according to both types of gene expression data, we identified 32 potential MYCN co-regulators: 15 positive regulators and 17 negative regulators (Figure 4B). The distributions of the correlation differences of all inferred MYCN co-regulators are shown in Supplementary Figure S6.
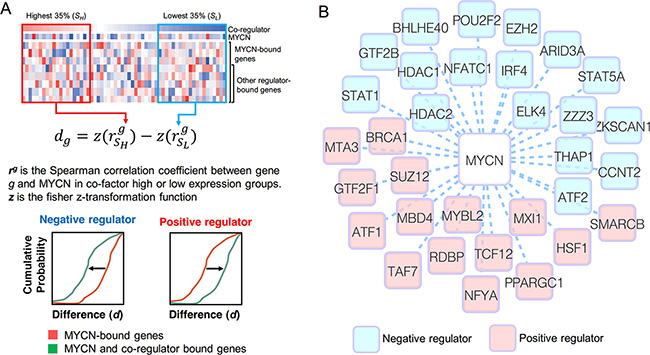
Figure 4: Inference of MYCN co-regulators. (A) The schematic illustration of the method we used to infer MYCN co-regulators. See text for full details. (B) MYCN and its co-regulators illustrated as a graph. The blue and red nodes denote the negative and positive regulators, respectively.
Several MYCN co-regulators have been reported previously. For example, MYCN can repress genes through recruitment of HDAC1 and HDAC2 [39, 40], which were predicted as negative regulators in our analysis. EZH2, inferred as a negative MYCN co-regulator, has been demonstrated to physically interact with MYCN to repress tumor suppressor genes [41]. Another interesting case is MXI1. MXI1 binds MAX and E-box motifs such as c-MYC, but functions as a transcriptional repressor [42, 43]. Therefore, it is hypothesized that MXI1 antagonizes MYCN activity, as it does for c-MYC [44, 45]. In our analysis, however, MXI1 was identified as a positive regulator in MYCN regulatory networks. Although some studies have demonstrated that overexpression of MXI1 inhibits MYCN-dependent cell proliferation and activates apoptosis via a pathway independent of MYCN in NB cells [45, 46], there is no evidence that MXI1 directly represses MYCN-regulated genes. In addition, one report showed that MYCN activated MXI1 expression [47]. Overall, these findings suggest that although MXI1 might compete with MYCN for binding sites, the effect of MYCN might be greater than that of MXI1. Consequently, our analysis revealed MXI1 as an activator.
Some regulators might be indirectly coordinated with the MYCN regulatory network. ATF1, referred to as a positive regulator, has been demonstrated to increase expression of MYCN in spermatogonial stem cells [48] and gingival fibroblasts [49]. Another example is STAT1, which was identified as a negative regulator in our analysis. It is known that the c-MYC promoter region contains STAT1 binding sites, and that STAT1 increases and maintains the basal expression of MYC during tumorigenesis [50, 51]. We examined the ENCODE ChIP-seq dataset in the UCSC genome browser, but found no STAT1 binding signal in the MYCN promoter region. Additionally, many studies observed that MYCN and c-MYC may regulate each other’s expression levels [20, 52, 53]. Therefore, we speculated that STAT1 might negatively regulate the MYCN regulatory network by inducing MYC.
Identification of MYCN-regulated microRNAs
To identify MYCN-regulated miRNAs, we first carried out a small RNA-seq analysis of MYCN-knockdown SK-N-BE(2)-C cells. Two independent MYCN knockdown experiments were performed, and each was analyzed on a separate small RNA-seq. To identify differentially expressed miRNAs, the expression profiles of SK-N-BE(2)-C cells transfected with siRNA against MYCN (low MYCN) were compared with cells treated with a non-targeting control (high MYCN). We identified 45 differentially expressed miRNAs corresponding to 49 loci: 26 up-regulated and 19 down-regulated miRNAs (Table 1). Next, we examined whether these miRNAs were directly regulated by MYCN. Because the TSSs of the miRNAs were unclear, we used predicted TSSs from miRStart [54] and PROmiRNA [55]. Therefore, the promoter of a miRNA was defined as the genomic region from 10 kb upstream of the predicted TSS to the start site of the miRNA precursor, and if an MYCN binding site fell in the promoter region of a miRNA, this miRNA was considered as MYCN-regulated miRNA. Additionally, if the host gene of a miRNA was bound by MYCN, this miRNA was also considered as a MYCN-regulated miRNA. Based on these criteria, we identified 28 out of 49 miRNA as possible direct transcription targets of MYCN. These 28 miRNA loci contained 12 MYCN-activated miRNAs and 12 MYCN-repressed miRNAs (Table 2).
Table 1: Differentially expressed miRNAs of MYCN knockdown
miRNA |
Stem-loop sequence |
Average normalized read count of siMYCN |
Average normalized read count of control |
log2 fold-change (siMYCN/control) |
Probability |
|---|---|---|---|---|---|
miR-124-3p |
mir-124-1 mir-124-2 mir-124-3 |
314.8 |
28.0 |
3.49 |
0.97 |
miR-410-3p |
mir-410 |
149.8 |
7.9 |
4.24 |
0.96 |
miR-1307-3p |
mir-1307 |
73.4 |
569.2 |
-2.95 |
0.96 |
miR-33a-5p |
mir-33a |
42.3 |
4.7 |
3.18 |
0.93 |
miR-1307-5p |
mir-1307 |
18.5 |
2.1 |
3.16 |
0.90 |
miR-27b-3p |
mir-27b |
589.0 |
142.1 |
2.05 |
0.90 |
miR-1268a |
mir-1268a |
80.2 |
16.0 |
2.32 |
0.89 |
miR-27a-3p |
mir-27a |
68.2 |
14.5 |
2.23 |
0.88 |
mir-873 |
mir-873 |
66.4 |
14.1 |
2.23 |
0.88 |
miR-92a-1-5p |
mir-92a-1 |
108.4 |
377.0 |
-1.80 |
0.87 |
miR-331-3p |
mir-331 |
32.4 |
7.1 |
2.19 |
0.85 |
miR-1268b |
mir-1268b |
89.8 |
25.6 |
1.81 |
0.85 |
miR-130a-3p |
mir-130a |
78.4 |
21.5 |
1.87 |
0.85 |
miR-377-3p |
mir-377 |
18.8 |
4.1 |
2.19 |
0.84 |
miR-221-5p |
mir-221 |
3.7 |
16.9 |
-2.19 |
0.83 |
miR-423-5p |
mir-423 |
2111.4 |
5697.1 |
-1.43 |
0.81 |
miR-181d-5p |
mir-181d |
167.7 |
505.2 |
-1.59 |
0.81 |
miR-345-5p |
mir-345 |
10.6 |
2.7 |
1.96 |
0.81 |
miR-887-3p |
mir-887 |
3.6 |
12.2 |
-1.77 |
0.80 |
mir-92b |
miR-92b-5p |
30.7 |
90.9 |
-1.56 |
0.79 |
miR-487b-3p |
mir-487b |
249.7 |
96.9 |
1.37 |
0.78 |
miR-181b-5p |
mir-181b-1 mir-181b-2 |
862.6 |
2181.6 |
-1.34 |
0.75 |
miR-296-5p |
mir-296 |
11.5 |
3.8 |
1.59 |
0.72 |
miR-496 |
mir-496 |
10.3 |
3.5 |
1.54 |
0.72 |
miR-320a |
mir-320a |
11660.9 |
24018.5 |
-1.04 |
0.70 |
miR-323a-3p |
mir-323a |
1147.6 |
537.4 |
1.09 |
0.70 |
miR-7-5p |
mir-7-1 mir-7-2 mir-7-3 |
38.4 |
91.5 |
-1.25 |
0.70 |
miR-505-5p |
mir-505 |
16.3 |
39.2 |
-1.27 |
0.67 |
miR-93-5p |
mir-93 |
714.4 |
361.2 |
0.98 |
0.67 |
miR-221-3p |
mir-221 |
131.1 |
257.8 |
-0.98 |
0.66 |
miR-181a-5p |
mir-181a-1 mir-181a-2 |
3045.0 |
5580.8 |
-0.87 |
0.65 |
miR-2110 |
mir-2110 |
4.0 |
10.1 |
-1.34 |
0.65 |
miR-760 |
mir-760 |
12.8 |
28.5 |
-1.15 |
0.64 |
miR-377-5p |
mir-377 |
59.8 |
29.6 |
1.02 |
0.64 |
miR-363-3p |
mir-363 |
13.2 |
5.4 |
1.29 |
0.64 |
miR-412-5p |
mir-412 |
4.8 |
11.2 |
-1.23 |
0.63 |
miR-24-3p |
mir-24-1 mir-24-2 |
959.0 |
547.1 |
0.81 |
0.63 |
miR-330-3p |
mir-330 |
58.2 |
106.3 |
-0.87 |
0.62 |
miR-1301-3p |
mir-1301 |
106.8 |
185.2 |
-0.79 |
0.62 |
miR-382-5p |
mir-382 |
266.3 |
157.3 |
0.76 |
0.61 |
miR-222-3p |
mir-222 |
578.5 |
959.9 |
-0.73 |
0.61 |
miR-323b-3p |
mir-323b |
10.1 |
4.7 |
1.09 |
0.61 |
miR-25-3p |
mir-25 |
1434.6 |
875.3 |
0.71 |
0.61 |
miR-376c-3p |
mir-376c |
70.1 |
39.8 |
0.82 |
0.60 |
miR-361-5p |
mir-361 |
16.6 |
8.4 |
0.99 |
0.60 |
The list is sorted by “probability”. The probability derived from NOISeq indicates the “probability of differential expression”. The raw read counts were normalized by upper-quartile method.
Table 2: List of MYCN-regulated microRNAs
miRNA |
Stem-loop sequence |
Regulation of MYCN& |
Number of target genes |
3-node motif |
4-node motif |
|---|---|---|---|---|---|
miR-124-3p |
mir-124-1 mir-124-3 |
R |
2079 |
138* |
296 |
miR-33a-5p |
mir-33a |
R |
1212 |
51 |
214* |
miR-1307-5p |
mir-1307 |
R |
0 |
0 |
0 |
miR-1268a |
mir-1268a |
R |
31 |
1 |
1 |
miR-27a-3p |
mir-27a |
R |
2264 |
115 |
303 |
miR-27b-3p |
mir-27b |
R |
2307 |
115 |
308 |
miR-345-5p |
mir-345 |
R |
72 |
10* |
7 |
miR-1268b |
mir-1268b |
R |
8 |
0 |
0 |
miR-296-5p |
mir-296 |
R |
169 |
16* |
31 |
miR-93-5p |
mir-93 |
R |
1916 |
130* |
352* |
miR-24-3p |
mir-24-1 mir-24-2 |
R |
1557 |
94* |
365* |
miR-25-3p |
mir-25 |
R |
1247 |
62 |
188 |
miR-181a-5p |
mir-181a-1 mir-181a-2 |
A |
1321 |
76* |
307* |
miR-330-3p |
mir-330 |
A |
689 |
45* |
94 |
miR-320a |
mir-320a |
A |
1204 |
74* |
292* |
miR-760 |
mir-760 |
A |
250 |
14 |
22 |
miR-7-5p |
mir-7-1 mir-7-2 |
A |
1909 |
89 |
274 |
miR-181b-5p |
hsa-mir-181b-1 hsa-mir-181b-2 |
A |
1348 |
79* |
316* |
miR-2110 |
mir-2110 |
A |
213 |
17* |
30 |
miR-92b-5p |
mir-92b |
A |
4 |
0 |
1 |
miR-181d-5p |
mir-181d |
A |
1257 |
73* |
286* |
miR-887-3p |
mir-887 |
A |
8 |
0 |
2 |
miR-92a-1-5p |
mir-92a-1 |
A |
49 |
2 |
16 |
miR-1307-3p |
mir-1307 |
A |
2 |
0 |
0 |
*denotes p-value < 0.05. &R: repression; A: activation.
Several pairs of miRNAs shared a common gene promoter: mir-27a and mir-24-2; mir-27b and mir-24-1; mir-25 and mir-93; mir-181a-1 and mir-181b-1; and mir-181a-2 and mir-181b-2. In addition, miRNAs in the same pair were regulated in the same direction. Interestingly, mir-1307 was differentially expressed under MYCN knockdown, but showed reversed regulation in the 5p/3p species. Although the reverse direction of 5p/3p coexpression has been reported in several studies [56, 57], the mechanism and biological significance of preferred arm selection remains unknown.
To obtain the miRNA-regulated genes, we compiled one experimentally validated and 11 predicted miRNA target databases and assigned a confidence score to each miRNA-target gene pair based on the number of supported predictions. With respect to the distribution of the confidence scores, there was a substantial drop at score 0.3 (Supplementary Figure S7). Therefore, in addition to the experimentally validated miRNA-target interactions, only the miRNA-target interactions, supported by at least four databases (i.e. confidence score > 0.3), were considered for further analysis. Each MYCN-regulated miRNA had an average of 918 targets (Table 2).
Interplay between MYCN and microRNA regulatory networks
Since transcriptional regulation of TFs is tightly coupled with the post-transcriptional regulation of miRNAs, we investigated the coordination between MYCN and its regulated miRNAs by utilizing three- and four-node feed-forward loops (FFLs; Figure 5A), which are frequently observed network motifs in various regulatory networks [58–60]. To identify the three-node motifs, we assessed the significant common targets of miRNA and MYCN by using the hypergeometric test. For the four-node motifs, we assessed whether MYCN-regulated genes were more than representatively physically connected with miRNA targets, using the permutation test. Here, the miRNA targets should also be MYCN-correlated genes.
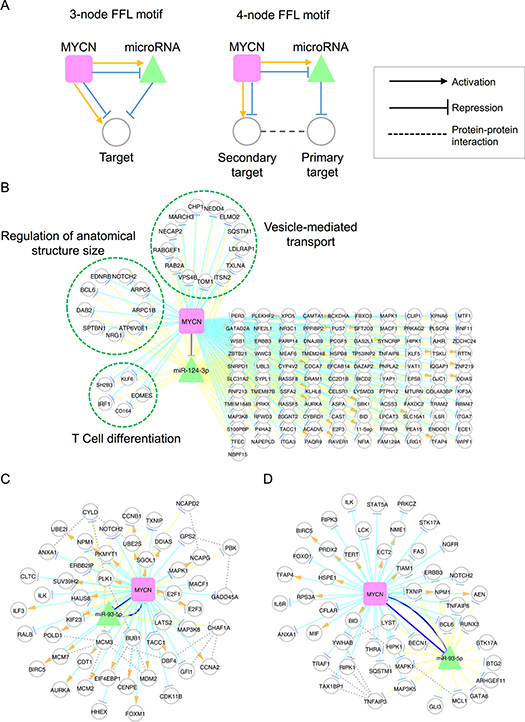
Figure 5: MYCN and microRNA co-regulatory motifs. (A) Schematic illustration of three- and four-node feed-forward loop (FFL) motifs. (B) The co-regulatory network of MYCN and miR-124-3p. Genes involved in the same function are grouped in a dashed circle. (C–D) The co-regulatory networks of MYCN and miR-93-5p based on the following enriched functions: cell cycle (C); and cell death (D).
Using a p-value of 0.05 as a threshold, 11 and 7 miRNAs formed three- and four-node motifs with MYCN, respectively (Table 2). Six miRNAs significantly formed both three- and four-node motifs with MYCN: miR-93-5p, miR-24-3p, miR-181a-5p, miR-320a, miR-181b-5p, and miR-181d-5p. Among these, expression of miR-181a-5p, miR-181b-5p, and miR-320a has been reported to be associated with MYCN status and unfavorable NB [12, 13, 61].
Our previous study demonstrated that the knockdown of miR-124-3p promotes MYCN-non-amplified NB cell differentiation, cell cycle arrest and apoptosis [62]. Therefore, we were interested in the coordination between miR-124-3p and MYCN. Because miR-124-3p only significantly forms three-node motifs with MYCN, we focused on the common targets of miR-124-3p and MYCN. There were 138 such common targets, of which 26 and 112 were activated and repressed by MYCN, respectively (Figure 5B). GO enrichment analysis revealed that miR-124-3p and MYCN co-regulated genes were involved in vesicle-mediated transport, regulation of anatomical structure size, and T cell differentiation, consistent with miR-124-3p-induced phenotypes [62, 63]. Interestingly, the regulation of genes in the same functional categories was coherent, i.e. they were all repressed by MYCN.
miR-93-5p has been documented to play a role as an oncogenic miRNA in many tumor types [64–66], but has not been investigated in NB. miR-93-5p is hosted in MCM7, which is regulated by MYCN, and is also predicted to target MYCN (confidence score: 1.0). Our analysis revealed many genes that were co-regulated by miR-93-5p and MYCN. The collection of miR-93-5p and MYCN co-mediated three- and four-node motifs comprised 369 genes and 770 interactions. To dissect this co-regulatory network, we performed GO enrichment analysis and identified function-specific sub-networks. The GO enrichment analysis revealed that the majority of miR-93-5p and MYCN co-regulated genes were involved in the cell cycle and cell death processes (Figure 5C and 5D). One interesting FFL in the cell-cycle network is the MYCN/E2F1/miR-93-5p circuit. E2F1 plays a critical role in the control of cell cycle progression in many cancer types and is the known target of miR-93-5p [67]. In this FFL, MYCN activates E2F1 but represses miR-93-5p to maintain E2F1 at a high expression level. Another interesting motif is MYCN/MCM2-7/MCM3/miR-93-5p. MCM2, MCM3, and MCM7 are the members of the minichromosome maintenance (MCM) complex, and are essential in the initiation of DNA replication during the cell cycle [68]. In this circuit, MYCN activates MCM2 and MCM7 expression and inhibits miR-93-5p expression to avoid the degradation of MCM3, which forms the MCM complex with MCM2 and MCM7. These interactions might be used to ensure that the NB cell cycle functions normally. Similarly, the motif of MYCN/BID/MCL1/miR-93-5p might be an important circuit for the inhibition of apoptosis because MCL1 interacts with BID to inhibit the induction of cytochrome c release [69]. Together, these findings suggest that miR-93-5p is a useful target for inhibiting the MYCN-induced pathway.
Integrative regulatory networks reveal potential therapeutic targets in NB
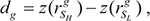
Finally, we examined the number of MYCN-regulated miRNAs targeting each MYCN-regulated gene. If the MYCN-regulated genes are critical in NB tumorigenesis, they might be targeted by a significant number of MYCN-regulated miRNAs to maintain their expression level. To identify this type of MYCN-regulated genes, we applied the hypergeometric test with Benjamini-Hochberg false discovery rate (FDR) correction. A total of 116 out of 874 MYCN-regulated genes were significantly targeted by MYCN-regulated miRNAs (adjusted p-value < 0.05; Supplementary Table S3). Interestingly, a large proportion of these genes (81%, 94/116) were repressed by MYCN. Moreover, among these enriched targets of MYCN-regulated miRNAs, some of them, such as KLF6 [70], RASSF8 [71], TGFBR3 [72], ARNTL [73], NDRG4 [74], PHTF1 [75], HIPK1 [76], PTGER4 [77], HECA [78], and EOMES [79], are known as tumor suppressor genes and are suggested as therapeutic targets in other cancer types. This implies that MYCN and MYCN-regulated miRNAs act together to down-regulate tumor suppressor genes.
The identification of these enriched targets of MYCN-regulated miRNAs might benefit the development of NB therapy (Figure 6). As described previously, several of the targets are tumor suppressor genes that have been reported for other cancer types, and some of them might also be tumor suppressor candidates in NB. For example, calmodulin binding transcription activator 1 (CAMTA1) is located on chromosome 1p, which is often deleted in NB [80], and overexpression of CAMTA1 suppresses cell growth and induces neurite-like processes and markers of neuronal differentiation in NB cells [81]. In our MYCN regulatory network, CAMTA1 was repressed by MYCN and also targeted by several MYCN-activated miRNAs, including miR-181a-5p, miR-181b-5p, and miR-181d-5p. Because the deletion of 1p and MYCN amplification generally co-occurs in NB patients [4], this reveals the importance of CAMTA1 in NB. Some of the enriched targets might play a role in maintaining the stability of MYCN regulatory networks. Synaptotagmin binding, cytoplasmic RNA interacting protein (SYNCRIP) and insulin-like growth factor-2 mRNA-binding protein 3 (IGF2BP3) are both RNA binding proteins that are activated by MYCN and have opposing functions in controlling neuronal fates [82]. SYNCRIP has been reported to be essential in ensuring the stabilization of c-MYC mRNA [83]. Similarly, although there is no direct evidence that IGF2BP3 interacts with MYCN or c-MYC, IGF2BP1, a member of the IGF2BP family, can stabilize c-MYC mRNA and elevate the protein expression of c-MYC [84]. Although it is unclear whether SYNCRIP and IGF2BP3 also play a role in stabilizing MYCN mRNA, we speculate that they might stabilize MYCN mRNA or other genes underlying MYCN regulatory networks. To elucidate the suitability of these potential therapeutic targets of NB, advanced experiments are required.
Figure 6: Potential therapeutic targets of NB with respect to regulation by MYCN. A group of genes repressed by MYCN and MYCN-regulated microRNAs has been reported as tumor suppressor candidates in NB and other cancer types. The RNA binding proteins SYNCRIP and IGF2BP3 are up-regulated by MYCN and might bind to MYCN or MYCN-regulated genes to maintain their mRNA stability. Orange and green nodes represent the MYCN-activated and -repressed genes, respectively.
MATERIALS AND METHODS
Cell culture
SK-N-BE(2)-C cells were obtained from ATCC (American Type Culture Collection, Manassas, VA). Cells were grown in DMEM/F12 (Gibco Laboratories, Grand Island, NY) supplemented with 10% fetal bovine serum (Gibco Laboratories) under 37°C and 5% CO2 and routinely passaged when 80–90% confluent. All cells were free of mycoplasma, as determined by a PCR-based mycoplasma detection method (MBI Fermentas, Vilnius, Lithuania).
Chromatin immunoprecipitation (ChIP)-sequencing and analysis
The ChIP assay was performed using EZ-Magna ChIP A (Upstate-Millipore, Billerica, MA, USA). Cells were cross-linked in 1% formaldehyde (Sigma-Aldrich, St Louis, MO, USA) for 30 min. Nuclear lysates were extracted and the chromatin fraction was sheared to 200–500-bp fragments using an ultrasonic probe (Labsonic M, Sartorius, Tagelswangen, Switzerland). Immunoprecipitation was performed overnight at 4°C using 1 μg of anti-MYCN antibody (Abcam, Cambridge, UK) or 1 μg of anti-mouse IgG1κ antibody (Abcam) as a control. After washing to remove nonspecific DNA binding, the protein/DNA complexes were eluted and reverse cross-linked to free DNA fragments as described in the manual. Purified fragmented DNA was subjected to ChIP-seq analysis to identify the MYCN binding regions.
DNA fragments (150–400 bp long) were gel–purified, and the adaptors were ligated to both ends of fragments. The PCR-amplified DNA libraries were quantified on an Agilent 2100 Bioanalyzer (Agilent Technologies, Palo Alto, CA, USA) and diluted for cluster generation. The ChIP-seq libraries were assayed by single-end sequencing on an Illumina HiSeq sequencing platform at the Beijing Genomics Institute (BGI).
The 49-nt reads were aligned to the human genome GRCh37 using Bowtie 2 [85]. Only those reads that mapped uniquely to the genome were retained for binding-peak identification. The Model-based Analysis of ChIP-seq (MACS version 1.4.2) algorithm [86] was used to identify the enriched regions with a p-value cutoff of 0.001 and modified parameters (bw = 500).
ChIP-qPCR
To validate the ChIP-seq results, candidate MYCN binding sequences near the transcription start site of the miRNA or miRNA-hosted gene were selected. After ChIP, the purified DNA fragments from the MYCN antibody and isotype control IgG were quantitatively amplified using iQ SYBR Green Supermix (Bio-Rad Laboratories) with a Bio-Rad CFX-96 thermocycler (Bio-Rad Laboratories), using the following PCR protocol: 2 min at 95°C, 40 cycles of 10 s at 95°C, and 30 s at 55°C. Specific primers for each amplicon are listed in Supplementary Table S4. Fold enrichment of a given antibody k (FEk) was calculated using the following equation:
where Ctk is the readout threshold value (Ct) of the selected amplicon immunoprecipitated from antibody k, and Cti is that of the IgG control antibody.
Transcriptome of neuroblastoma
NB patient gene expression data were obtained from the Sequencing Quality Control (SEQC) project (GSE47792). This project generated gene expression profiles from 498 primary NB patients using RNA-seq (GSE62564) and microarray (GSE49710). Both types of expression data were used as independent datasets.
Survival analysis
K-means clustering was used to stratify the MYCN-non-amplified patients into two distinct groups according to their gene expression of 874 MYCN-regulated genes. To obtain robust groups, we performed 1000 time K-means with different initial centers and determined the conserved group of each sample. Kaplan-Meier survival analysis was used to compare the survival rate between groups that emerged from this k-means clustering. All analyses were performed with R software.
Transcriptional factor binding sites
Transcriptional factor binding sites (TFBSs) were identified from the data based on the ChIP-seq experiments for 161 transcription factors across 91 cell types using the ENCODE project. We downloaded TFBSs, via the Table Browser of the UCSC Genome Bioinformatics website (http://genome.ucsc.edu/), from the “Txn Factor ChIP” track (table name is wgEncodeRegTfbsClusteredV3).
Inference of co-regulators of MYCN
The method inspired by the modulator inference by network dynamics (MINDy) algorithm [38] was proposed to infer potential MYCN co-regulators. As illustrated in Figure 4A, for a given regulator, the samples were classified into two subsets, SH and SL, based on the expression value of the regulator. Here, we used 35% as a threshold value to separate the high and low regulator expression samples. For a given MYCN-bound gene g, we calculated its expression correlation with MYCN in subset SH and SL, i.e.  and
and  , respectively. We used the Spearman correlation coefficient to measure the expression correlation. The correlation difference of gene g between SH and SL was calculated using the following formula:
where z is the Fisher z-transformation function defined as:
where N is the sample size. Finally, we determined whether the correlation difference distribution of genes bound by both MYCN and the regulator was significantly greater or less than that of MYCN-bound genes, using the Kolmogorov-Smirnov (KS) test. If the p-value was less than 0.05, this regulator was considered as a co-regulator of MYCN. Based on the distribution of correlation differences, the co-factors were classified into positive and negative regulators. The NB gene expression data generated by RNA-seq and microarray from the SEQC project and the ChIP-seq data for 161 regulators from the ENCODE project were used in this analysis.
siRNA transfection
Cells (4 × 10⁵) were plated into 6-well plates and transiently transfected with 150 pmol double-stranded RNA (dsRNA) oligonucleotides against MYCN (Dharmacon, Lafayette, CO, USA; SMARTpool, J-003913-16, 5′-CGA GCUGGGUCACGGAGAU-3′; 5′-GAACCCAGACCUC GAGUUU-3′; 5′- GGACAGUGAGCGUCGCAGA-3′; 5′-CCUCCAUGACAGCGCUAAA-3′). Double-stranded oligonucleotide was diluted into 250 μl of serum-free DMEM, mixed with 250 μl serum-free DMEM containing 7.5 μl of Lipofectamine 2000 reagent (Invitrogen, Carlsbad, CA, USA), and incubated for 20 min at room temperature, before being added to the cells growing in 1.5 ml of complete medium. After 48 h of transfection, cells were harvested using 1 ml TRIzol reagent, and RNA was extracted using TRIzol reagent (Invitrogen) as indicated in the manufacturer’s protocol.
Small RNA sequencing and analysis
RNA concentration and purity were determined photometrically using a NanoDrop ND-1000 Spectrophotometer (NanoDrop Technologies Inc, Rockland, DE); absorbance was measured at 260 nm and the A260/A280 ratio was calculated. RNA integrity was evaluated using the Agilent 2100 Bioanalyzer (Agilent Technologies, Palo Alto, CA, USA). Total RNA (20 μg) was used for library construction following the protocol supplied with the Small RNA Sample Prep Kit (Illumina, San Diego, CA, USA), and Solexa sequencing was performed by the Beijing Genomics Institute (BGI) according to the manufacturer’s instructions.
The raw reads were trimmed for an adaptor sequence using cutdapt [87], and reads shorter than 17 bases after trimming were discarded. We aligned reads to known human miRNA precursors (miRBase release 20) and counted the aligned reads for quantitative miRNA expression using the miRExpress analysis pipeline [88]. The -t parameter (alignment identity between query and reference sequences) for miRExpress was set to 0.9. The raw read counts were normalized by upper-quartile normalization. Differentially expressed miRNAs were identified using the NOISeq package from Bioconductor [89]. NOISeq differential expression statistics were calculated by comparing the M (the log2-ratio of two conditions) and D (the differences between two conditions) values against the noise distribution to obtain the “probability of differential expression”. We defined the MYCN-associated miRNAs as those with probability ≥ 0.6 and an average read count across two conditions of ≥ 100.
Integration of miRNA-target relationships
We compiled 12 experimentally validated and predicted miRNA-target databases: miRTarBase [90], miRanda [91], TargetScan [92], picTar [93], PITA [94], miRDB [95], TargetMiner [96], DIANA-microT [97], RNA22 [98], CoMeTa [99], miRcode [100], and miRMap [101]. The miRNA names were mapped to miRBase (release 20), and the identifier for each target gene was mapped to Entrez Gene ID. After removal of redundancies, we obtained 8,226,628 miRNA-target relationships, between 2,037 miRNAs and 18,554 target genes. We then assigned a confidence score to each miRNA-target relationship based on the following rules: (1) if the relationship was curated in miRTarBase, which manually collects experimentally validated microRNA-target interactions from the literature, the confidence score was one; (2) if the relationship was not curated in miRTarBase but was supported by n prediction databases, the confidence score was n/10. If n > 10, the confidence score was nevertheless one. To restrict our analysis to high-confidence miRNA-target relationships, we considered only those with confidence scores ≥ 0.4.
Assessment of MYCN-mediated microRNA feed-forward loop motifs
We considered two types of MYCN-mediated microRNA FFL motifs. The first was a three-node FFL motif comprising MYCN, a microRNA, and a common target gene. The second was a four-node FFL motif consisting of MYCN, a microRNA, a microRNA-target gene (primary target), and an MYCN-regulated gene (secondary target) that interacts with a primary target. Although the primary target is not directly regulated by MYCN, its expression might be associated with MYCN. Here, we specified that the primary target of the four-node motif had to be the MYCN-correlated gene.
For the three-node FFL motif, we applied the hypergeometric test to determine whether MYCN and the microRNA regulated a significant number of common genes. For the four-node FFL motifs, we performed the permutation test. The protein-protein interactions (PPIs) were collected from public databases and high-throughput experiments. For each microRNA, the number of PPIs connecting the primary and secondary targets was determined. Next, a random procedure was carried out by randomly drawing a set with the same number of primary targets as the set of MYCN-correlated genes, excluding the MYCN-regulated genes, and counting the number of PPIs connecting the random set and the secondary target. After running this procedure 1000 times, the empirical p-value was calculated as the proportion of random procedures for which the PPI number was larger than the observed value.
Data availability
The raw reads from ChIP-seq and small RAN-seq generated in this study have been deposited at the Gene Expression Omnibus (GEO) under accession numbers GSE72640 and GSE72721.
CONCLUSIONS
Through integration of heterogeneous regulatory data, this study reveals the complexity of the role of MYCN as a driving oncogene for neuroblastoma. We identified the potential regulators involved in the MYCN regulatory networks at various molecular levels, including DNA, mRNA, and miRNA. These valuable resources allow us to improve our understanding of MYCN regulation in neuroblastoma and help to develop diagnostic tools and effective therapeutic strategies for this cancer. Further dissection of the downstream effects of MYCN and identification of pivotal regulators are required to reach these goals. In particular, identifying the best target for inhibiting MYCN-driven tumorigenesis remains a challenge and requires further experimental verification.
ACKNOWLEDGMENTS AND FUNDING
We thank Dr. James Winkler from University of Colorado-Boulder for proofreading the manuscript. This work was supported by the National Taiwan University Cutting-Edge Steering Research Project (NTU-CESRP-104R7602C3), Ministry of Science and Technology (NSC 102-2628-B-002-041-MY3, MOST 103-2320-B-010-031-MY3 and MOST 104-2628-E-010-001-MY3), 2015 Collaboration Research Project between NTU Hospital and NTU Colleges (104-UN032) and 2016 Translational Medicine Piloted Model Cooperation Projects of National Taiwan University Medical Campus and College of Life Science (104F021 and 105R3701).
CONFLICTS OF INTEREST
The authors declare no competing financial interests.
Authors’ contributions
H.-C. H. and H.-F. J conceived, designed, and supervised the study. H.-Y. C. and J.-Y. C. performed cell culture, siRNA transfection, ChIP and ChIP-qPCR. C.-L. H. performed NGS and bioinformatics analyses. W.-M. H. provides the knowledge about NB. C.-L. H., H.-Y. C., H.-C. H., and H.-F. J. interpreted the data and wrote the manuscript. All authors read and approved the final manuscript.
REFERENCES
1. Maris JM. Recent advances in neuroblastoma. N Engl J Med. 2010; 362:2202–2211.
2. Maris JM, Matthay KK. Molecular biology of neuroblastoma. J Clin Oncol. 1999; 17:2264–2279.
3. Park JR, Bagatell R, London WB, Maris JM, Cohn SL, Mattay KK, Hogarty M, Committee COGN. Children’s Oncology Group’s 2013 blueprint for research: neuroblastoma. Pediatr Blood Cancer. 2013; 60:985–993.
4. Bown N, Cotterill S, Lastowska M, O’Neill S, Pearson AD, Plantaz D, Meddeb M, Danglot G, Brinkschmidt C, Christiansen H, Laureys G, Speleman F, Nicholson J, et al. Gain of chromosome arm 17q and adverse outcome in patients with neuroblastoma. N Engl J Med. 1999; 340:1954–1961.
5. Attiyeh EF, London WB, Mosse YP, Wang Q, Winter C, Khazi D, McGrady PW, Seeger RC, Look AT, Shimada H, Brodeur GM, Cohn SL, Matthay KK, et al. Chromosome 1p and 11q deletions and outcome in neuroblastoma. N Engl J Med. 2005; 353:2243–2253.
6. Seeger RC, Brodeur GM, Sather H, Dalton A, Siegel SE, Wong KY, Hammond D. Association of multiple copies of the N-myc oncogene with rapid progression of neuroblastomas. N Engl J Med. 1985; 313:1111–1116.
7. Caron H, van Sluis P, de Kraker J, Bokkerink J, Egeler M, Laureys G, Slater R, Westerveld A, Voute PA, Versteeg R. Allelic loss of chromosome 1p as a predictor of unfavorable outcome in patients with neuroblastoma. N Engl J Med. 1996; 334:225–230.
8. Ambros PF, Ambros IM, Brodeur GM, Haber M, Khan J, Nakagawara A, Schleiermacher G, Speleman F, Spitz R, London WB, Cohn SL, Pearson AD, Maris JM. International consensus for neuroblastoma molecular diagnostics: report from the International Neuroblastoma Risk Group (INRG) Biology Committee. Br J Cancer. 2009; 100:1471–1482.
9. Gherardi S, Valli E, Erriquez D, Perini G. MYCN-mediated transcriptional repression in neuroblastoma: the other side of the coin. Front Oncol. 2013; 3:42.
10. Iraci N, Diolaiti D, Papa A, Porro A, Valli E, Gherardi S, Herold S, Eilers M, Bernardoni R, Della Valle G, Perini G. A SP1/MIZ1/MYCN repression complex recruits HDAC1 at the TRKA and p75NTR promoters and affects neuroblastoma malignancy by inhibiting the cell response to NGF. Cancer Res. 2011; 71:404–412.
11. Huang M, Weiss WA. Neuroblastoma and MYCN. Cold Spring Harb Perspect Med. 2013; 3:a014415.
12. Chen Y, Stallings RL. Differential patterns of microRNA expression in neuroblastoma are correlated with prognosis, differentiation, and apoptosis. Cancer Res. 2007; 67:976–983.
13. Schulte JH, Horn S, Otto T, Samans B, Heukamp LC, Eilers UC, Krause M, Astrahantseff K, Klein-Hitpass L, Buettner R, Schramm A, Christiansen H, Eilers M, et al. MYCN regulates oncogenic microRNAs in neuroblastoma. Int J Cancer. 2008; 122:699–704.
14. Fontana L, Fiori ME, Albini S, Cifaldi L, Giovinazzi S, Forloni M, Boldrini R, Donfrancesco A, Federici V, Giacomini P, Peschle C, Fruci D. Antagomir-17–5p abolishes the growth of therapy-resistant neuroblastoma through p21 and BIM. PLoS One. 2008; 3:e2236.
15. Beckers A, Van Peer G, Carter DR, Mets E, Althoff K, Cheung BB, Schulte JH, Mestdagh P, Vandesompele J, Marshall GM, De Preter K, Speleman F. MYCN-targeting miRNAs are predominantly downregulated during MYCNdriven neuroblastoma tumor formation. Oncotarget. 2015; 6:5204–5216. doi: 10.18632/oncotarget.2477.
16. Schnepp RW, Maris JM. Targeting MYCN: a good BET for improving neuroblastoma therapy? Cancer Discov. 2013; 3:255–257.
17. Bell E, Chen L, Liu T, Marshall GM, Lunec J, Tweddle DA. MYCN oncoprotein targets and their therapeutic potential. Cancer Lett. 2010; 293:144–157.
18. Duffy DJ, Krstic A, Halasz M, Schwarzl T, Fey D, Iljin K, Mehta JP, Killick K, Whilde J, Turriziani B, Haapa-Paananen S, Fey V, Fischer M, et al. Integrative omics reveals MYCN as a global suppressor of cellular signalling and enables network-based therapeutic target discovery in neuroblastoma. Oncotarget. 2015; 6:43182–43201. doi: 10.18632/oncotarget.6568.
19. Gangoda L, Keerthikumar S, Fonseka P, Edgington LE, Ang CS, Ozcitti C, Bogyo M, Parker BS, Mathivanan S. Inhibition of cathepsin proteases attenuates migration and sensitizes aggressive N-Myc amplified human neuroblastoma cells to doxorubicin. Oncotarget. 2015; 6:11175–11190. doi: 10.18632/oncotarget.3579.
20. Westermann F, Muth D, Benner A, Bauer T, Henrich KO, Oberthuer A, Brors B, Beissbarth T, Vandesompele J, Pattyn F, Hero B, Konig R, Fischer M, et al. Distinct transcriptional MYCN/c-MYC activities are associated with spontaneous regression or malignant progression in neuroblastomas. Genome Biol. 2008; 9:R150.
21. Gupta A, Williams BR, Hanash SM, Rawwas J. Cellular retinoic acid-binding protein II is a direct transcriptional target of MycN in neuroblastoma. Cancer Res. 2006; 66:8100–8108.
22. Cotterman R, Knoepfler PS. N-Myc regulates expression of pluripotency genes in neuroblastoma including lif, klf2, klf4, and lin28b. PLoS One. 2009; 4:e5799.
23. Slack A, Chen Z, Tonelli R, Pule M, Hunt L, Pession A, Shohet JM. The p53 regulatory gene MDM2 is a direct transcriptional target of MYCN in neuroblastoma. Proc Natl Acad Sci U S A. 2005; 102:731–736.
24. Wei JS, Johansson P, Chen QR, Song YK, Durinck S, Wen X, Cheuk AT, Smith MA, Houghton P, Morton C, Khan J. microRNA profiling identifies cancer-specific and prognostic signatures in pediatric malignancies. Clin Cancer Res. 2009; 15:5560–5568.
25. Norris MD, Bordow SB, Haber PS, Marshall GM, Kavallaris M, Madafiglio J, Cohn SL, Salwen H, Schmidt ML, Hipfner DR, Cole SP, Deeley RG, Haber M. Evidence that the MYCN oncogene regulates MRP gene expression in neuroblastoma. Eur J Cancer. 1997; 33:1911–1916.
26. Koppen A, Ait-Aissa R, Koster J, van Sluis PG, Ora I, Caron HN, Volckmann R, Versteeg R, Valentijn LJ. Direct regulation of the minichromosome maintenance complex by MYCN in neuroblastoma. Eur J Cancer. 2007; 43:2413–2422.
27. Brodeur GM. Neuroblastoma: biological insights into a clinical enigma. Nat Rev Cancer. 2003; 3:203–216.
28. Eckerle I, Muth D, Batzler J, Henrich KO, Lutz W, Fischer M, Witt O, Schwab M, Westermann F. Regulation of BIRC5 and its isoform BIRC5–2B in neuroblastoma. Cancer Lett. 2009; 285:99–107.
29. Cotterman R, Jin VX, Krig SR, Lemen JM, Wey A, Farnham PJ, Knoepfler PS. N-Myc regulates a widespread euchromatic program in the human genome partially independent of its role as a classical transcription factor. Cancer Res. 2008; 68:9654–9662.
30. Selmi A, de Saint-Jean M, Jallas AC, Garin E, Hogarty MD, Benard J, Puisieux A, Marabelle A, Valsesia-Wittmann S. TWIST1 is a direct transcriptional target of MYCN and MYC in neuroblastoma. Cancer Lett. 2015; 357:412–418.
31. Murphy DM, Buckley PG, Bryan K, Das S, Alcock L, Foley NH, Prenter S, Bray I, Watters KM, Higgins D, Stallings RL. Global MYCN transcription factor binding analysis in neuroblastoma reveals association with distinct E-box motifs and regions of DNA hypermethylation. PLoS One. 2009; 4:e8154.
32. Gualdrini F, Corvetta D, Cantilena S, Chayka O, Tanno B, Raschella G, Sala A. Addiction of MYCN amplified tumours to B-MYB underscores a reciprocal regulatory loop. Oncotarget. 2010; 1:278–288. doi: 10.18632/oncotarget.138.
33. Valentijn LJ, Koster J, Haneveld F, Aissa RA, van Sluis P, Broekmans ME, Molenaar JJ, van Nes J, Versteeg R. Functional MYCN signature predicts outcome of neuroblastoma irrespective of MYCN amplification. Proc Natl Acad Sci U S A. 2012; 109:19190–19195.
34. Pickard MR, Williams GT. Molecular and Cellular Mechanisms of Action of Tumour Suppressor GAS5 LncRNA. Genes (Basel). 2015; 6:484–499.
35. Li T, Xie J, Shen C, Cheng D, Shi Y, Wu Z, Deng X, Chen H, Shen B, Peng C, Li H, Zhan Q, Zhu Z. Amplification of long noncoding RNA ZFAS1 pomotes metastasis in hepatocellular carcinoma. Cancer Res. 2015.
36. Bindea G, Mlecnik B, Hackl H, Charoentong P, Tosolini M, Kirilovsky A, Fridman WH, Pages F, Trajanoski Z, Galon J. ClueGO: a Cytoscape plug-in to decipher functionally grouped gene ontology and pathway annotation networks. Bioinformatics. 2009; 25:1091–1093.
37. Perna D, Faga G, Verrecchia A, Gorski MM, Barozzi I, Narang V, Khng J, Lim KC, Sung WK, Sanges R, Stupka E, Oskarsson T, Trumpp A, et al. Genome-wide mapping of Myc binding and gene regulation in serum-stimulated fibroblasts. Oncogene. 2012; 31:1695–1709.
38. Wang K, Saito M, Bisikirska BC, Alvarez MJ, Lim WK, Rajbhandari P, Shen Q, Nemenman I, Basso K, Margolin AA, Klein U, Dalla-Favera R, Califano A. Genome-wide identification of post-translational modulators of transcription factor activity in human B cells. Nat Biotechnol. 2009; 27:829–839.
39. Liu T, Tee AE, Porro A, Smith SA, Dwarte T, Liu PY, Iraci N, Sekyere E, Haber M, Norris MD, Diolaiti D, Della Valle G, Perini G, et al. Activation of tissue transglutaminase transcription by histone deacetylase inhibition as a therapeutic approach for Myc oncogenesis. Proc Natl Acad Sci U S A. 2007; 104:18682–18687.
40. Lodrini M, Oehme I, Schroeder C, Milde T, Schier MC, Kopp-Schneider A, Schulte JH, Fischer M, De Preter K, Pattyn F, Castoldi M, Muckenthaler MU, Kulozik AE, et al. MYCN, HDAC2 cooperate to repress miR-183 signaling in neuroblastoma. Nucleic Acids Res. 2013; 41:6018–6033.
41. Corvetta D, Chayka O, Gherardi S, D’Acunto CW, Cantilena S, Valli E, Piotrowska I, Perini G, Sala A. Physical interaction between MYCN oncogene and polycomb repressive complex 2 (PRC2) in neuroblastoma: functional and therapeutic implications. J Biol Chem. 2013; 288:8332–8341.
42. Zervos AS, Gyuris J, Brent R. Mxi1, a protein that specifically interacts with Max to bind Myc-Max recognition sites. Cell. 1993; 72:223–232.
43. Schreiber-Agus N, Chin L, Chen K, Torres R, Rao G, Guida P, Skoultchi AI, DePinho RA. An amino-terminal domain of Mxi1 mediates anti-Myc oncogenic activity and interacts with a homolog of the yeast transcriptional repressor SIN3. Cell. 1995; 80:777–786.
44. Horvilleur E, Bauer M, Goldschneider D, Mergui X, de la Motte A, Benard J, Douc-Rasy S, Cappellen D. p73alpha isoforms drive opposite transcriptional and post-transcriptional regulation of MYCN expression in neuroblastoma cells. Nucleic Acids Res. 2008; 36:4222–4232.
45. Armstrong MB, Mody RJ, Ellis DC, Hill AB, Erichsen DA, Wechsler DS. N-Myc differentially regulates expression of MXI1 isoforms in neuroblastoma. Neoplasia. 2013; 15:1363–1370.
46. Erichsen DA, Armstrong MB, Wechsler DS. Mxi1 and mxi1–0 antagonize N-myc function and independently mediate apoptosis in neuroblastoma. Transl Oncol. 2015; 8:65–74.
47. Kim MK, Carroll WL. Autoregulation of the N-myc gene is operative in neuroblastoma and involves histone deacetylase 2. Cancer. 2004; 101:2106–2115.
48. Braydich-Stolle L, Kostereva N, Dym M, Hofmann MC. Role of Src family kinases and N-Myc in spermatogonial stem cell proliferation. Dev Biol. 2007; 304:34–45.
49. Chan CP, Chang MC, Wang YJ, Chen LI, Tsai YL, Lee JJ, Jia HW, Jeng JH. Thrombin activates Ras-CREB/ATF-1 signaling and stimulates c-fos, c-jun, and c-myc expression in human gingival fibroblasts. J Periodontol. 2008; 79:1248–1254.
50. Kharma B, Baba T, Matsumura N, Kang HS, Hamanishi J, Murakami R, McConechy MM, Leung S, Yamaguchi K, Hosoe Y, Yoshioka Y, Murphy SK, Mandai M, et al. STAT1 drives tumor progression in serous papillary endometrial cancer. Cancer Res. 2014; 74:6519–6530.
51. Adach-Kilon A, Swiatek-Machado K, Kaminska B, Dabrowski M. Signal transducer and activator of transcription 1 (Stat1) maintains basal mRNA expression of pro-survival stat3-target genes in glioma C6 cells. J Cell Biochem. 2011; 112:3685–3694.
52. Huang R, Cheung NK, Vider J, Cheung IY, Gerald WL, Tickoo SK, Holland EC, Blasberg RG. MYCN and MYC regulate tumor proliferation and tumorigenesis directly through BMI1 in human neuroblastomas. FASEB J. 2011; 25:4138–4149.
53. Helland A, Anglesio MS, George J, Cowin PA, Johnstone CN, House CM, Sheppard KE, Etemadmoghadam D, Melnyk N, Rustgi AK, Phillips WA, Johnsen H, Holm R, et al. Deregulation of MYCN, LIN28B and LET7 in a molecular subtype of aggressive high-grade serous ovarian cancers. PLoS One. 2011; 6:e18064.
54. Chien CH, Sun YM, Chang WC, Chiang-Hsieh PY, Lee TY, Tsai WC, Horng JT, Tsou AP, Huang HD. Identifying transcriptional start sites of human microRNAs based on high-throughput sequencing data. Nucleic Acids Res. 2011; 39:9345–9356.
55. Marsico A, Huska MR, Lasserre J, Hu H, Vucicevic D, Musahl A, Orom U, Vingron M. PROmiRNA: a new miRNA promoter recognition method uncovers the complex regulation of intronic miRNAs. Genome Biol. 2013; 14:R84.
56. Choo KB, Soon YL, Nguyen PN, Hiew MS, Huang CJ. MicroRNA-5p and -3p co-expression and cross-targeting in colon cancer cells. J Biomed Sci. 2014; 21:95.
57. Huang CJ, Nguyen PN, Choo KB, Sugii S, Wee K, Cheong SK, Kamarul T. Frequent co-expression of miRNA-5p and -3p species and cross-targeting in induced pluripotent stem cells. Int J Med Sci. 2014; 11:824–833.
58. Re A, Cora D, Taverna D, Caselle M. Genome-wide survey of microRNA-transcription factor feed-forward regulatory circuits in human. Mol Biosyst. 2009; 5:854–867.
59. Shalgi R, Lieber D, Oren M, Pilpel Y. Global and local architecture of the mammalian microRNA-transcription factor regulatory network. PLoS Comput Biol. 2007; 3:e131.
60. Tsang J, Zhu J, van Oudenaarden A. MicroRNA-mediated feedback and feedforward loops are recurrent network motifs in mammals. Mol Cell. 2007; 26:753–767.
61. Schulte JH, Marschall T, Martin M, Rosenstiel P, Mestdagh P, Schlierf S, Thor T, Vandesompele J, Eggert A, Schreiber S, Rahmann S, Schramm A. Deep sequencing reveals differential expression of microRNAs in favorable versus unfavorable neuroblastoma. Nucleic Acids Res. 2010; 38:5919–5928.
62. Huang TC, Chang HY, Chen CY, Wu PY, Lee H, Liao YF, Hsu WM, Huang HC, Juan HF. Silencing of miR-124 induces neuroblastoma SK-N-SH cell differentiation, cell cycle arrest and apoptosis through promoting AHR. FEBS Lett. 2011; 585:3582–3586.
63. Zhao Z, Ma X, Hsiao TH, Lin G, Kosti A, Yu X, Suresh U, Chen Y, Tomlinson GE, Pertsemlidis A, Du L. A high-content morphological screen identifies novel microRNAs that regulate neuroblastoma cell differentiation. Oncotarget. 2014; 5:2499–2512. doi: 10.18632/oncotarget.1703.
64. Qu MH, Han C, Srivastava AK, Cui T, Zou N, Gao ZQ, Wang QE. miR-93 promotes TGF-beta-induced epithelial-to-mesenchymal transition through downregulation of NEDD4L in lung cancer cells. Tumour Biol. 2015.
65. Kawano M, Tanaka K, Itonaga I, Ikeda S, Iwasaki T, Tsumura H. microRNA-93 promotes cell proliferation via targeting of PTEN in Osteosarcoma cells. J Exp Clin Cancer Res. 2015; 34:76.
66. Xiao X, Zhou L, Cao P, Gong H, Zhang Y. MicroRNA-93 regulates cyclin G2 expression and plays an oncogenic role in laryngeal squamous cell carcinoma. Int J Oncol. 2015; 46:161–174.
67. Emmrich S, Putzer BM. Checks and balances: E2F-microRNA crosstalk in cancer control. Cell Cycle. 2010; 9:2555–2567.
68. Lei M. The MCM complex: its role in DNA replication and implications for cancer therapy. Curr Cancer Drug Targets. 2005; 5:365–380.
69. Clohessy JG, Zhuang J, de Boer J, Gil-Gomez G, Brady HJ. Mcl-1 interacts with truncated Bid and inhibits its induction of cytochrome c release and its role in receptor-mediated apoptosis. J Biol Chem. 2006; 281:5750–5759.
70. Sangodkar J, Shi J, DiFeo A, Schwartz R, Bromberg R, Choudhri A, McClinch K, Hatami R, Scheer E, Kremer-Tal S, Martignetti JA, Hui A, Leung WK, et al. Functional role of the KLF6 tumour suppressor gene in gastric cancer. Eur J Cancer. 2009; 45:666–676.
71. Lock FE, Underhill-Day N, Dunwell T, Matallanas D, Cooper W, Hesson L, Recino A, Ward A, Pavlova T, Zabarovsky E, Grant MM, Maher ER, Chalmers AD, et al. The RASSF8 candidate tumor suppressor inhibits cell growth and regulates the Wnt and NF-kappaB signaling pathways. Oncogene. 2010; 29:4307–4316.
72. Turley RS, Finger EC, Hempel N, How T, Fields TA, Blobe GC. The type III transforming growth factor-beta receptor as a novel tumor suppressor gene in prostate cancer. Cancer Res. 2007; 67:1090–1098.
73. Yeh CM, Shay J, Zeng TC, Chou JL, Huang TH, Lai HC, Chan MW. Epigenetic silencing of ARNTL, a circadian gene and potential tumor suppressor in ovarian cancer. Int J Oncol. 2014; 45:2101–2107.
74. Chu D, Zhang Z, Zhou Y, Li Y, Zhu S, Zhang J, Zhao Q, Ji G, Wang W, Zheng J. NDRG4, a novel candidate tumor suppressor, is a predictor of overall survival of colorectal cancer patients. Oncotarget. 2015; 6:7584–7596. doi: 10.18632/oncotarget.3170.
75. Huang X, Geng S, Weng J, Lu Z, Zeng L, Li M, Deng C, Wu X, Li Y, Du X. Analysis of the expression of PHTF1 and related genes in acute lymphoblastic leukemia. Cancer Cell Int. 2015; 15:93.
76. Rey C, Soubeyran I, Mahouche I, Pedeboscq S, Bessede A, Ichas F, De Giorgi F, Lartigue L. HIPK1 drives p53 activation to limit colorectal cancer cell growth. Cell Cycle. 2013; 12:1879–1891.
77. Murn J, Alibert O, Wu N, Tendil S, Gidrol X. Prostaglandin E2 regulates B cell proliferation through a candidate tumor suppressor, Ptger4. J Exp Med. 2008; 205:3091–3103.
78. Wang J, Gong L, Zhu SJ, Zhu Q, Yao L, Han XJ, Zhang JR, Li YH, Zhang W. The Human Homolog of Drosophila Headcase Acts as a Tumor Suppressor through Its Blocking Effect on the Cell Cycle in Hepatocellular Carcinoma. PLoS One. 2015; 10:e0137579.
79. Gao F, Xia Y, Wang J, Lin Z, Ou Y, Liu X, Liu W, Zhou B, Luo H, Zhou B, Wen B, Zhang X, Huang J. Integrated analyses of DNA methylation and hydroxymethylation reveal tumor suppressive roles of ECM1, ATF5, and EOMES in human hepatocellular carcinoma. Genome Biol. 2014; 15:533.
80. Maris JM, Weiss MJ, Guo C, Gerbing RB, Stram DO, White PS, Hogarty MD, Sulman EP, Thompson PM, Lukens JN, Matthay KK, Seeger RC, Brodeur GM. Loss of heterozygosity at 1p36 independently predicts for disease progression but not decreased overall survival probability in neuroblastoma patients: a Children’s Cancer Group study. J Clin Oncol. 2000; 18:1888–1899.
81. Henrich KO, Bauer T, Schulte J, Ehemann V, Deubzer H, Gogolin S, Muth D, Fischer M, Benner A, Konig R, Schwab M, Westermann F. CAMTA1, a 1p36 tumor suppressor candidate, inhibits growth and activates differentiation programs in neuroblastoma cells. Cancer Res. 2011; 71:3142–3151.
82. Liu Z, Yang CP, Sugino K, Fu CC, Liu LY, Yao X, Lee LP, Lee T. Opposing intrinsic temporal gradients guide neural stem cell production of varied neuronal fates. Science. 2015; 350:317–320.
83. Weidensdorfer D, Stohr N, Baude A, Lederer M, Kohn M, Schierhorn A, Buchmeier S, Wahle E, Huttelmaier S. Control of c-myc mRNA stability by IGF2BP1-associated cytoplasmic RNPs. RNA. 2009; 15:104–115.
84. Bell JL, Wachter K, Muhleck B, Pazaitis N, Kohn M, Lederer M, Huttelmaier S. Insulin-like growth factor 2 mRNA-binding proteins (IGF2BPs): post-transcriptional drivers of cancer progression? Cell Mol Life Sci. 2013; 70:2657–2675.
85. Langmead B, Salzberg SL. Fast gapped-read alignment with Bowtie 2. Nat Methods. 2012; 9:357–359.
86. Zhang Y, Liu T, Meyer CA, Eeckhoute J, Johnson DS, Bernstein BE, Nusbaum C, Myers RM, Brown M, Li W, Liu XS. Model-based analysis of ChIP-Seq (MACS). Genome Biol. 2008; 9:R137.
87. Martin M. Cutadapt removes adapter sequences from high-throughput sequencing reads. EMBnetjournal. 2011; 17.
88. Wang WC, Lin FM, Chang WC, Lin KY, Huang HD, Lin NS. miRExpress: analyzing high-throughput sequencing data for profiling microRNA expression. BMC Bioinformatics. 2009; 10:328.
89. Tarazona S, Garcia-Alcalde F, Dopazo J, Ferrer A, Conesa A. Differential expression in RNA-seq: a matter of depth. Genome Res. 2011; 21:2213–2223.
90. Hsu SD, Tseng YT, Shrestha S, Lin YL, Khaleel A, Chou CH, Chu CF, Huang HY, Lin CM, Ho SY, Jian TY, Lin FM, Chang TH, et al. miRTarBase update 2014: an information resource for experimentally validated miRNA-target interactions. Nucleic Acids Res. 2014; 42:D78–85.
91. John B, Enright AJ, Aravin A, Tuschl T, Sander C, Marks DS. Human MicroRNA targets. PLoS Biol. 2004; 2:e363.
92. Lewis BP, Burge CB, Bartel DP. Conserved seed pairing, often flanked by adenosines, indicates that thousands of human genes are microRNA targets. Cell. 2005; 120:15–20.
93. Krek A, Grun D, Poy MN, Wolf R, Rosenberg L, Epstein EJ, MacMenamin P, da Piedade I, Gunsalus KC, Stoffel M, Rajewsky N. Combinatorial microRNA target predictions. Nat Genet. 2005; 37:495–500.
94. Kertesz M, Iovino N, Unnerstall U, Gaul U, Segal E. The role of site accessibility in microRNA target recognition. Nat Genet. 2007; 39:1278–1284.
95. Wang X. miRDB: a microRNA target prediction and functional annotation database with a wiki interface. RNA. 2008; 14:1012–1017.
96. Bandyopadhyay S, Mitra R. TargetMiner: microRNA target prediction with systematic identification of tissue-specific negative examples. Bioinformatics. 2009; 25:2625–2631.
97. Maragkakis M, Reczko M, Simossis VA, Alexiou P, Papadopoulos GL, Dalamagas T, Giannopoulos G, Goumas G, Koukis E, Kourtis K, Vergoulis T, Koziris N, Sellis T, et al. DIANA-microT web server: elucidating microRNA functions through target prediction. Nucleic Acids Res. 2009; 37(Web Server issue):W273–276.
98. Loher P, Rigoutsos I. Interactive exploration of RNA22 microRNA target predictions. Bioinformatics. 2012; 28:3322–3323.
99. Gennarino VA, D’Angelo G, Dharmalingam G, Fernandez S, Russolillo G, Sanges R, Mutarelli M, Belcastro V, Ballabio A, Verde P, Sardiello M, Banfi S. Identification of microRNA-regulated gene networks by expression analysis of target genes. Genome Res. 2012; 22:1163–1172.
100. Jeggari A, Marks DS, Larsson E. miRcode: a map of putative microRNA target sites in the long non-coding transcriptome. Bioinformatics. 2012; 28:2062–2063.
101. Vejnar CE, Blum M, Zdobnov EM. miRmap web: Comprehensive microRNA target prediction online. Nucleic Acids Res. 2013; 41:W165–168.