
INTRODUCTION
Thyroid cancer (TC) is the most common endocrine malignancy [1], which is classified into four main histology groups: papillary thyroid cancer (PTC), follicular thyroid cancer (FTC), medullary thyroid cancer (MTC), and undifferentiated or anaplastic thyroid carcinomas [2, 3]. Mostly, TC presents clinically as a solitary nodule or as a dominant nodule within a multinodular thyroid gland [4]. Although the vast majority of thyroid nodules detected by ultrasonography are reported to be benign [5, 6], 5% ~ 15% of clinically apparent thyroid nodules are malignant [7]. Therefore, identification malignancy in patients with thyroid nodules could be a great challenge to clinicians.
Thyroid stimulating hormone (TSH) is a glycoprotein, which stimulates secretion of thyroid hormones, maintenance of thyroid-specific gene expression, and gland growth [8, 9]. Suppression of serum TSH concentrations by administering exogenous thyroxine is a mainstay in clinical management to TC, with good evidence of mortality benefit in high-risk patients [10]. Recently, several studies have suggested that a higher serum concentration of TSH is associated with thyroid malignancy in patients with thyroid nodules [11–13]. Despite the biological plausibility of TSH as a risk factor of TC, existing results remain inconclusive and inconsistent. The lack of concordance reflects limitation in these studies, such as ethnic difference, phenotypic heterogeneity, limited statistical power and bias in the study design. We therefore performed a meta-analysis on clinical studies to develop an understanding of the relationship between serum TSH level and TC.
RESULTS
Characteristics of the included studies
Our primary search generated 8,918 citations. After duplicates were removed 5484 citations remained for title and abstract screening. Results from the literature search and study selection process were shown in Figure 1. Finally, 56 studies [11, 14–65] and 3 unpublished data with 70230 subjects in total, including 20227 cases of thyroid cancer were included in the meta-analysis; most were retrospective cross-sectional studies. Characteristics of these studies summarized in Supplementary Table 1.
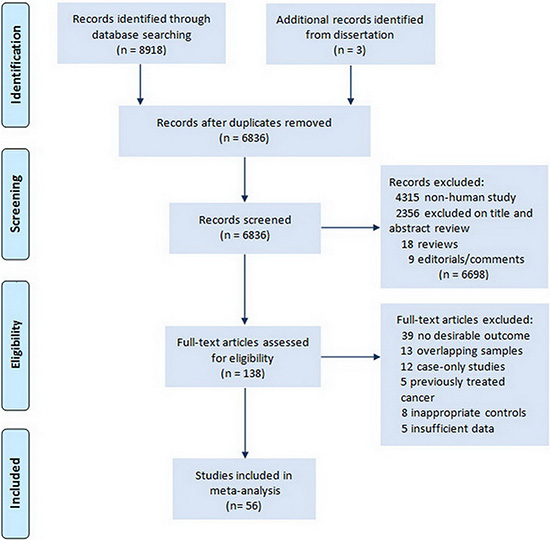
Figure 1: Flow chart of literature search for studies examining serum TSH level and thyroid cancer.
TSH levels between TC patients and controls
Table 1 summarize the main results of the meta-analysis for TSH level and TC. Overall, the random effects model summarising all 56 comparisons revealed that TC patients had significantly higher mean TSH levels compared to controls (RoM: 1.44, 95% CI: 1.32–1.56, P < 10−5). In different ethnicities, the pooled RoM for East Asian TC patients was 1.39 (95% CI: 1.27–1.53, P < 10−5), 1.72 for Caucasian cases (95% CI: 1.40–2.12, P < 10−5) and 1.49 for the other ethnic populations (95% CI: 1.33–1.65, P < 10−5; Figure 2). As for studies with small and moderate sample size, the summary RoM of serum TSH level for TC was 1.54 (95% CI: 1.42–1.67, P < 10−5) and 1.33 (95% CI 1.20–1.47, P < 10−5) in studies with small and moderate sample size, respectively. When analysis was restricted to the 12 studies with at least 500 TC cases, which should be less prone to selective publication than smaller studies, yielded an pooled RoM of 1.33 (95% CI: 1.05–1.68, P = 0.017). Paediatric thyroid cancer appears to be unique and quite different from the adult form. Significant increased serum TSH levels were both found in adults cases (RoM: 1.42, 95% CI: 1.31–1.55, P < 10−5) and paediatric TC patients (RoM: 1.99, 95% CI: 1.63–2.44, P < 10−5). In the stratified analysis by study design, a significant increased TSH was detected among studies using retrospective cross-section design and studies using other design (Table 1). Not all researchers reported data in the same way, and most articles reported results for TSH using mean and standard deviation. Analysis restricted to the 49 studies with sufficient data, which should be less prone to data bias from estimations of mean and SD, yielded an overall RoM of 1.44 (95% CI: 1.31–1.57, P < 10−5; Supplementary Figure 1).
Table 1: Main results of overall and subgroups analysis for serum TSH level and TC
Overall and subgroups analyses |
No. of studies |
No. of cases/controls |
RoM (95% CI) |
P (Z) |
P (Q) |
I2 (%) |
|---|---|---|---|---|---|---|
All |
56 |
20227/50003 |
1.44 (1.32–1.56) |
< 10−5 |
< 10−5 |
99.2 |
Ethnicity |
|
|
|
|
|
|
Asian |
44 |
18291/35339 |
1.39 (1.27–1.53) |
< 10−5 |
< 10−5 |
99.4 |
Caucasian |
10 |
1660/11827 |
1.72 (1.40–2.12) |
< 10−5 |
< 10−5 |
86.1 |
Others |
2 |
276/2837 |
1.49 (1.33–1.65) |
< 10−5 |
0.34 |
0 |
Age |
|
|
|
|
|
|
Adult |
53 |
20151/49794 |
1.42 (1.31–1.55) |
< 10−5 |
< 10−5 |
99.3 |
Children |
3 |
76/209 |
1.99 (1.63–2.44) |
< 10−5 |
0.96 |
0 |
Sample size |
|
|
|
|
|
|
Small (No. cases < 200) |
29 |
2605/6116 |
1.54 (1.42–1.67) |
< 10−5 |
< 10−5 |
91.8 |
Moderate (No. cases between 200–500) |
15 |
4922/12356 |
1.33 (1.20–1.47) |
< 10−5 |
< 10−5 |
89.8 |
Large (No. cases > 500) |
12 |
12700/31531 |
1.33 (1.05–1.68) |
0.017 |
< 10−5 |
99.8 |
Study design |
|
|
|
|
|
|
Retrospective cross-sectional study |
49 |
13834/38454 |
1.43 (1.31–1.56) |
< 10−5 |
< 10−5 |
99.3 |
Others |
7 |
6393/11549 |
1.52 (1.24–1.85) |
< 10−5 |
< 10−5 |
74.0 |
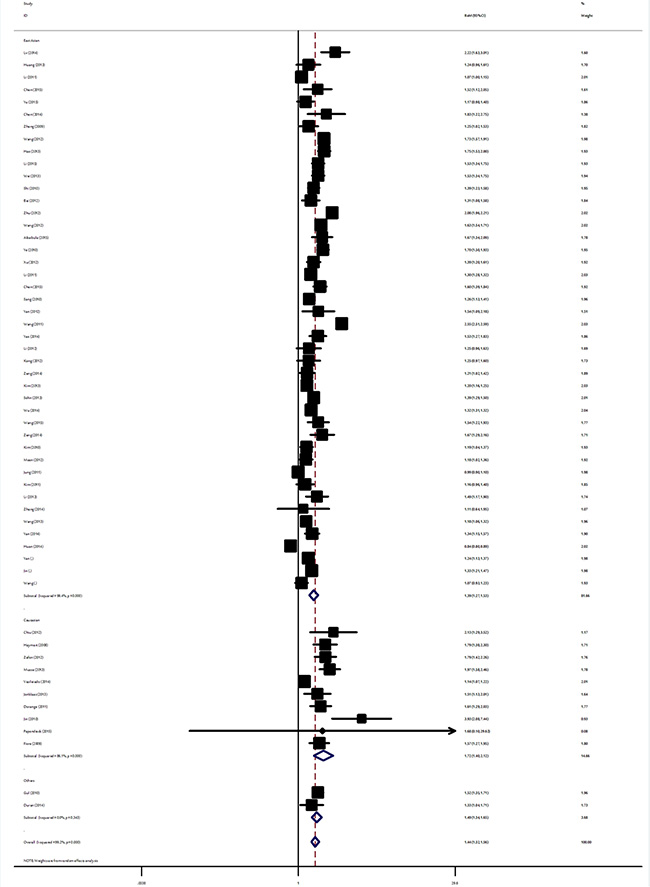
Figure 2: Ratio of the mean (RoM) serum TSH levels in TC patients compared to the controls and the 95% confidence intervals, as stratified by ethnicity.
TSH effects on size, stage, metastasis and histological subtype of TC
The data on TSH level of TC patients stratified by tumour size, TNM stages and lymph node metastasis status were available in 8, 7, and 10 studies respectively (Table 2). When tumour sizes were classified into subgroups defined as < 1 cm and > 1 cm, analysis demonstrated that patients with larger tumour size had significantly increased TSH levels (RoM = 1.56, 95% CI: 1.22–2.00 vs. RoM = 1.22, 95% CI: 1.10–1.36; P = 0.01) compared with patients with smaller one (Table 1). The patients with advanced disease (stage III and IV) had a significantly higher mean TSH relative to those with stage I and II disease. The RoM TSH of those with advanced disease was 2.09 (95% CI: 1.60–2.72) vs. 1.34 (95% CI: 1.17–1.54) (P < 10−5). There was significant difference in TSH levels between TC cases with and without lymph node metastasis (RoM: 2.32 vs. 1.46, P = 0.001). Given the biological differences between the histological types of TC, subgroup analyses by histological types found that serum TSH levels were significantly increased among PTC (P < 10−5). However, no significant differences in TSH levels were detected in FTC (P = 0.95).
Table 2: TSH level and tumor size, TNM stage, lymph node metastasis
Subgroups |
No. of studies |
No. of cases/controls |
RoM (95% CI) |
P (Z) |
P (Q) |
I2 (%) |
|---|---|---|---|---|---|---|
Tumor size |
|
|
|
|
|
|
> 1 cm |
8 |
2262/6156 |
1.56 (1.22–2.00) |
< 10−4 |
< 10−5 |
97.4 |
< 1 cm |
8 |
2481/6156 |
1.22 (1.10–1.36) |
< 10−4 |
< 10−5 |
85.3 |
TNM stage |
|
|
|
|
|
|
I and II |
7 |
2335/13126 |
1.34 (1.17–1.54) |
< 10−5 |
< 10−5 |
96.7 |
III and IV |
7 |
903/13126 |
2.09 (1.60–2.72) |
< 10−5 |
< 10−5 |
98.5 |
Lymph node metastasis |
|
|
|
|
|
|
No |
10 |
2021/10975 |
1.46 (1.23–1.73) |
< 10−5 |
< 10−5 |
96.9 |
Yes |
10 |
631/10975 |
2.32 (1.79–3.02) |
< 10−5 |
< 10−5 |
97.6 |
Histological type |
|
|
|
|
|
|
PTC |
5 |
2978/1786 |
1.27 (1.17–1.38) |
< 10−5 |
< 10−5 |
81.1 |
FTC |
5 |
87/1786 |
0.99 (0.73–1.34) |
0.95 |
< 10−5 |
81.4 |
Association between TSH levels and TC Risk
Thyroid functional autonomy, defined as serum TSH levels below the lower limit of the normal range (0.4 mU/ml), was used as reference group and a TSH of 4.2 or greater was considered above the upper end of normal TSH [66]. The risk of higher serum TSH for TC was significantly increased with OR of 7.25 (95% CI: 4.22–12.47, P < 10−5); while the OR for TC with TSH between 1.35 and 2.3 was 1.84 (95% CI: 1.27–2.66, P = 0.001; Supplementary Figure 2).
The diagnostic value of TSH for TC
To investigate the diagnostic value of TSH for thyroid cancer, a diagnostic meta-analysis was conducted. Many studies showed the distributions of cases and controls according to the TSH range. To explore the optimal cut-off value, true positives, false positives, false negatives, and true negatives for each individual study were calculated according to different cut-off value. The pooled specificity, sensitivity and area under the SROC were summarized in Figure 3. The pooled specificity was high (0.96, 95% CI: 0.95–0.97) when the cut-off value was set as larger than 3.5 mU/L, while the sensitivity was poor (0.12, 95% CI: 0.09–0.16). When the cut-off value was less than 0.5 mU/L, the pooled sensitivity was high (0.95, 95% CI: 0.94–0.96) and the pooled specificity was poor (0.10, 95% CI: 0.07–0.13). Subgroup analysis stratified by ethnicity showed there was no significant difference between Asians and Caucasians (Table 3). Likelihood ratios were used to evaluate clinical utility of the diagnostic test. A clinically useful test was defined with a PLR > 10 and a NLR < 0.1. In our meta-analysis, no cut-off value can reach the threshold of clinically useful test (Figure 4).
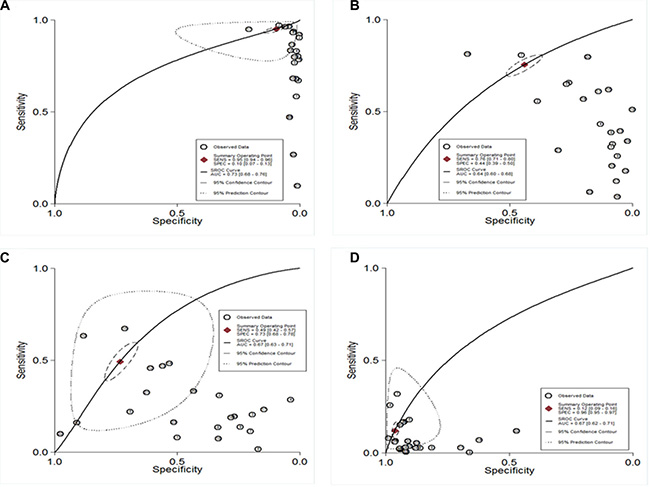
Figure 3: SROC curve of diagnostic meta-analysis. (A) TSH cut-off < 0.5 mU/L; (B) TSH cut-off 0.5–1.5 mU/L; (C) TSH cut-off 1.5–2.5 mU/L; (D) TSH cut-off > 3.5 mU/L).
Table 3: Summary of diagnostic meta-analysis of TSH for thyroid cancer
Cut-off of TSH |
Ethnicity |
n |
Specificity (95% CI) |
Sensitivity (95% CI) |
AUSROC curve (95% CI) |
|---|---|---|---|---|---|
< 0.5 |
All |
21 |
0.10 (0.07–0.13) |
0.95 (0.94–0.96) |
0.73 (0.68–0.76) |
|
Asian |
15 |
0.08 (0.06–0.10) |
0.96 (0.95–0.97) |
0.80 (0.76–0.83) |
|
Caucasian |
6 |
0.13 (0.09–0.17) |
0.90 (0.88–0.92) |
0.70 (0.66–0.74) |
0.5–1.5 |
All |
22 |
0.44 (0.39–0.50) |
0.76 (0.71–0.80) |
0.64 (0.60–0.68) |
|
Asian |
11 |
0.41 (0.37–0.46) |
0.78 (0.73–0.81) |
0.63 (0.59–0.67) |
|
Caucasian |
11 |
0.44 (0.60–0.69) |
0.76 (0.68–0.83) |
0.65 (0.60–0.69) |
1.5–2.5 |
All |
22 |
0.73 (0.68–0.78) |
0.49 (0.42–0.57) |
0.67 (0.63–0.71) |
|
Asian |
15 |
0.71 (0.64–0.72) |
0.55 (0.46–0.63) |
0.69 (0.64–0.72) |
|
Caucasian |
7 |
0.80 (0.68–0.88) |
0.36 (0.27–0.47) |
0.58 (0.54–0.63) |
> 3.5 |
All |
24 |
0.96 (0.95–0.97) |
0.12 (0.09–0.16) |
0.68 (0.64–0.72) |
|
Asian |
18 |
0.97 (0.95–0.98) |
0.13 (0.09–0.18) |
0.71 (0.67–0.75) |
|
Caucasian |
6 |
0.96 (0.94–0.97) |
0.10 (0.08–0.13) |
0.47 (0.42–0.51) |
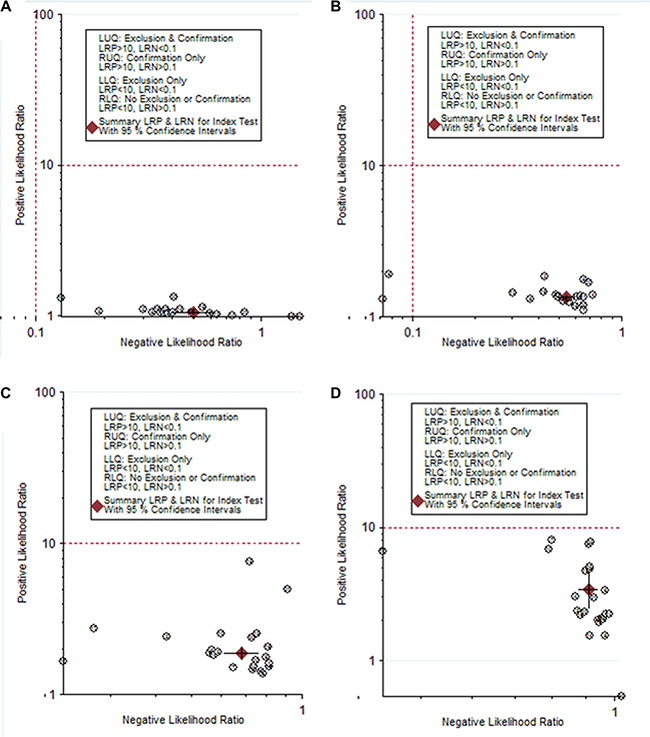
Figure 4: The likelihood ratio matrix of TSH for the diagnosis of thyroid cancer. (A) TSH cut-off < 0.5 mU/L; (B) TSH cut-off 0.5–1.5 mU/L; (C) TSH cut-off 1.5–2.5 mU/L; (D) TSH cut-off > 3.5 mU/L).
Heterogeneity exploration
Significant heterogeneity was present among the included studies in overall and subgroup analysis (P < 0.05). As the formal test for heterogeneity may not be powerful enough, meta-regression was used to evaluate potential effect modifiers by including ethnicity, sample size, study design, mean age, sex distribution and study quality as covariates. In meta-regression analysis, it was found that sample size (coefficient = −0.09, P < 10−5) and ethnic population (coefficient = 0.08, P = 0.004) was potential source of heterogeneity; while study design (P = 0.90), mean age of cases (P = 0.18) and controls (P = 0.79), sex distribution among cases (P = 0.09) and controls (P = 0.76), and study quality (P = 0.05), did not significantly explain between-study heterogeneity. Furthermore, Galbraith plot analyses of all included studies were used to assess the potential sources of heterogeneity. Five studies were found to be the contributors of heterogeneity (Supplementary Figure 3).
Sensitivity analyses and small study effect
To assess the extent to which individual studies with extremely large RoMs influenced the summary RoM, one-way sensitivity analyses was conducted. The exclusion of the study by Jin et al. [56] that included the largest RoM estimate reduced between-study heterogeneity but did not appreciably change the summary RoM (1.43; 95% CI: 1.28–1.59; Pheterogeneity < 10−5, I2 = 99.0%). One recent study [58] with the smallest number of cases (n = 14) yielded large variance in the effect estimate; removing this study led to almost the same summary RoM (1.44; 95% CI: 1.32–1.56; Pheterogeneity < 10−5, I2 = 99.3%). However, omitting the study by Wang et al. (14), which included large sample size and heterogeneous results, did substantially influence the summary RoM (1.39; 95% CI: 1.33–1.45; Pheterogeneity < 10−5, I2 = 93.5%). Sensitivity analysis indicated that the results of this meta-analysis were stable, with RoMs and 95% CIs ranging from 1.39 (95% CI: 1.33–1.45, P < 10−5) to 1.45 (95% CI: 1.30–1.61, P < 10−5) (Supplementary Figure 4).
We found no evidence of small study effects (P = 0.39 by Egger regression test; Supplementary Figure 5). The shape of the funnel plots was symmetrical (P = 0.06 Begg adjusted rank correlation test, Supplementary Figure 6).
DISCUSSION
This is the first meta-analysis addressing serum TSH and TC risk, and our results indicate that TC patients have significant increased level of serum TSH, supporting recommendations of TSH suppressive therapy to reduce the risk of TC recurrence and increased survival [67]. Significant associations were observed in East Asians, Caucasians, and other ethnic populations, suggesting the importance of TSH as a predictor of the risk of TC in different ethnicity with different genetic backgrounds and living environments. We also observed that the effect size in small and moderate studies was stronger than that in studies with large sample size. Indeed, small sample sized association studies lack statistical power and have resulted in apparently contradicting finding [68]. Larger studies of different ethnic populations, strict selection of patients will be required in the future.
Association between serum TSH concentrations and likelihood of differentiated thyroid carcinoma was mainly investigated in adults. However, paediatric thyroid cancer appears to be unique, and quite different from the adult form in terms of epidemiology and natural history [69]. By combining all the evidence available, we also observed a higher serum TSH concentration in children and adolescents with differentiated thyroid cancer compared with those with benign thyroid nodules. Given the limitations of pediatric studies and the small size, our results may be overinflated and large scale researches will be required to confirm our findings.
In subgroup analysis by nodules size (> 1 cm vs. < 1 cm), positive association was maintained regardless of the size of tumor. This suggests that the pathophysiology of TSH in tumorigenesis was similar among TC regardless of tumor size. Therefore, relatively high serum TSH concentrations may not be useful as a malignancy predictor in the assessment of thyroid nodules. When patients with TC were grouped according to TNM, we found that mean serum TSH levels were significantly higher in those with advanced stage disease when compared with those with more localised (stage I and II) disease. A similar finding was present in patients with lymph node metastasis with respect to those with no evidence of node metastasis. These results of advanced disease further suggest that TSH might be involved in the pathogenesis or progression of TC. Stratification of tumors by histological subtype indicated that TSH increased, preferentially for PTC. The reason for the observed tumour-specific difference in the TSH level is unknown. However, different carcinogenic processes may be involved in the genesis of various well-differentiated thyroid cancers because of the presence of different concentration of serum TSH. As studies for FTC are currently limited, further studies with increasing number of FTC cases are warranted to confirm our findings.
In the diagnostic meta-analysis, we explored the diagnostic performance based on different TSH cut-off values. The areas under SROC were quite similar when different cut-off values were used, while the specificity and sensitivity depended on the TSH cut-off value. However, the overall diagnostic accuracy was poor. No cut-off value can pass the clinical useful test, which indicated TSH alone is not sufficient for confirmation or exclusion of TC. TSH together with other factors may increase the diagnostic accuracy.
TSH stimulates the production and release of thyroid hormones and promotes thyroid cancer growth as well as, invasion, and angiogenesis [70]. Trophic growth effects of TSH in thyroid cancer are well established and are most likely manipulated by TSH receptors on tumor cells [71, 72]. This is consistent with clinical results showing improvement in disease remission and relapse-free survival of DTC patients with TSH suppression [73]. Furthermore, evidence in favour of the TSH receptor’s role in thyroid cancer includes the data on autoimmune thyroid disease and thyroid cancer. Although not all studies are in agreement, a meta-analysis of 38 studies showed a 2.8−fold increased incidence of thyroid cancer in patients with Hashimoto’s thyroiditis, compared with control population [74]. Recently, genome-wide association studies (GWAS) of levels of TSH in euthyroid individuals has identified associations at 1p36.13 [75], PDE8B [76], and FOXE1 [77, 78]. Several of the newly identified variants confer its risk to TC through serum levels of TSH [77, 78].
Limitations also inevitably existed in this meta-analysis. Firstly, our results were based on unadjusted; while a more precise analysis should be conducted after adjustment for important confounders (e.g., family history, carcinogens exposure and other lifestyle). Secondly, data from the studies exhibit statistically significant heterogeneity. Lack of individual-level data prevents us from making efficient assessment of the sources of heterogeneity. Thirdly, the subgroup analysis of associations between TSH level and tumour size, TNM stage, and lymph node metastasis as well as histological type were performed on the basis of a fraction of all the possible data to be pooled, so selection bias may have occurred and our results may be overinflated. Larger studies with detailed histopathological information are needed to confirm our findings. Fourthly, independence of TSH for TC risk was not investigated in current meta-analysis due to the limit access to individual data. However, many studies included in our-meta-analysis have proved its independence by logistic regression analysis [11, 43]. Finally, differences in the sensitivity and/or specificity of the analytical techniques, or sample degradation during storage, may also contribute to inconsistence between studies.
In conclusion, our meta-analysis of 56 studies indicate that a significant increased serum TSH level were associated with risk of TC. Direct evidence from future prospective study is warranted to clarify a cause-and-effect relationship between TSH and TC as well as its diagnostic value.
MATERIALS AND METHODS
Identification and eligibility of relevant studies
We performed this analysis in accordance with the guidelines of the PRISMA (Preferred Reporting Items for Systematic Reviews and Meta-analyses) statement [79]. Epidemiological association studies published before January, 2016, on thyroid stimulating hormone and thyroid cancer were identified by computer-based searches from databases including PubMed, Web of Science, EMBASE, SCOPUS, Cochrane Library databases, CSPD (China Science Periodical Database) and CNKI (China National Knowledge Infrastructure). The search strategy were MeSH terms relating to thyroid stimulating hormone (e.g., “thyroid stimulating hormone”, “TSH”, “thyrotropin”, and “serum thyrotropin level”) in combination with words related to thyroid cancer (e.g., “thyroid cancer’’, “thyroid carcinoma’’, “thyroid neoplasm”, “thyroid tumor”, and “differentiated thyroid cancer”). No language restriction was applied. The titles and abstracts of potential articles were screened to determine their relevance, and any clearly irrelevant studies were excluded. The full texts of the remaining articles were read to determine whether they contained information on the topic of interest. Furthermore, reference lists of primary studies and review articles were also reviewed by a manual search to identify additional relevant publications.
The outcome of interest was histologically or pathologically confirmed thyroid cancer. Control subjects were defined as thyroid nodule patients or benign surgical patients without thyroid cancer. Eligible studies had to meet all of the following criteria: (1) investigated preoperative serum TSH levels and the risk of TC using either prospective (nested case-control or cohort study) or retrospective design (cross-sectional or retrospective case-control study); (2) original human studies with independent data; (3) no medications that would specifically suppress thyroid function and consequentially TSH response (e.g., methimazole, propylthiouracil or levothyroxine usage); (4) serum TSH were measured separately for cases and controls using a reliable assay; (5) the results were expressed as, or could be estimated into, mean and standard deviation (SD). Major exclusion criteria were: (1) overlapping data, (2) case-only studies and (3) insufficient data.
Quality assessment and data extraction
For association studies with inconsistent results, the methodological quality should be assessed by appropriate criteria to limit the risk of introducing bias into meta-analyses. A procedure known as ’Newcastle–Ottawa Scale (NOS)’ has been used to assess the quality of association studies [80]. NOS scores of ≥ 6 were defined as high-quality studies.
Two investigators independently reviewed each eligible article and extracted relevant information. The following data were collected from each study: first author, publication date, diagnostic criterion, study design, age, gender, ethnicity, quantified method of serum TSH, sample size, TNM (tumor node metastasis) stages (I/II, or III/IV, defined according to the AJCC), tumor size (less than 1 cm, 1 or more than 1 cm), lymph node metastasis (yes, or no), histological subtypes, the mean and SD values of serum TSH concentration among cases and controls, the distributions of cases and controls according to different TSH range.. When only the median and range were reported, we used a conversion formula [81] to convert to the mean and SD. We attempted to contact study authors for additional or missing information when needed. Discrepancies in data extraction were resolved by discussion among all authors through consensus.
Statistical analysis
As serum TSH concentrations were measured using different methods across different studies, a ratio method was used to express the difference in mean TSH between TC patients and controls for each study. In brief, ratio of the mean (RoM) was defined as the mean value of the TC case group divided by that of the control group [82, 83]. Thus, changes in results are expressed as percentages, and their variances are approximated by standard techniques (delta method). To provide quantitative evidence from all studies and maximize statistical power for hypothesis testing, we performed meta-analyses using DerSimonian and Laird’s random-effects model which considers both within- and between-study variation to calculate the summary-risk estimate [84]. Heterogeneity across individual studies was calculated using the standard Q-statistic test followed by subsidiary analysis or by random-effect regression models with restricted maximum likelihood estimation [85]. We also calculated the I2 statistics (I2= (Q − df)/Q) to reflect between-study heterogeneity. The percentage of I2 < 25, 25–50, and > 50 indicates low, moderate, and high heterogeneity, respectively [86]. Sources of heterogeneity were investigated by stratified meta-analyses based on ethnicity, and sample size (No. cases ≥ 500 or < 500). Furthermore, meta-regression analysis was performed to investigate potential sources of heterogeneity by including ethnicity, sample size, age, and sex as covariates. Sensitivity analysis was performed by analysing the influence of each study on the overall estimates and heterogeneity. For diagnostic meta-analysis, we calculated true positives, false positives, false negatives, and true negatives for each individual study that showed frequency of thyroid cancer in accord with serum TSH concentration. The studies were divided into 4 groups based on the cut-off value. (Group1, cut-off values were less than 0.5; Group2, cut-off values were between 0.5 and 1.5; Group3, cut-off values were between 1.5 and 2.5; Group4, cut-off values were larger than 3.5). The diagnostic numbers were used to calculate the pooled sensitivity, specificity, positive likelihood ratio (PLR), negative likelihood ratio (NLR), and corresponding 95% confidence intervals (95% CI) [87, 88]. The PLR is calculated as: sensitivity/(1-specificity) and the NLR is calculated as (1-sensitivity)/specificity. A clinically useful test was defined with a PLR > 10 and a NLR < 0.1. The summary ROC curve (SROC) was generated and the area under the SROC (AUSROC) was calculated [89]. Small study effects was assessed with the funnel plot [90] and Egger’s test [91]. All the analyses were done with Stata 10.0 software (STATA Corp., College Station, TX, USA). All P values are two-sided at the P = 0.05 level.
ACKNOWLEDGMENTS AND FUNDING
This work was supported by the National Natural Science Foundation of China (81272722).
CONFLICTS OF INTEREST
All authors declare that they have no conflicts of interests.
REFERENCES
1. Siegel R, Naishadham D, Jemal A. Cancer statistics, 2013. CA Cancer J Clin. 2013; 63:11–30.
2. Kondo T, Ezzat S, Asa SL. Pathogenetic mechanisms in thyroid follicular-cell neoplasia. Nat Rev Cancer. 2006; 6:292–306.
3. DeLellis RA. Pathology and genetics of thyroid carcinoma. J Surg Oncol. 2006; 94:662–669.
4. Polyzos SA, Kita M, Avramidis A. Thyroid nodules—stepwise diagnosis and management. Hormones (Athens). 2007; 6:101–119.
5. Mazzaferri EL. Management of a solitary thyroid nodule. N Engl J Med. 1993; 328:553–559.
6. Brander A, Viikinkoski P, Nickels J, Kivisaari L. Thyroid gland: US screening in a random adult population. Radiology. 1991; 181:683–687.
7. Frates MC, Benson CB, Doubilet PM, Kunreuther E, Contreras M, Cibas ES, Orcutt J, Moore FD Jr, Larsen PR, Marqusee E, Alexander EK. Prevalence and distribution of carcinoma in patients with solitary and multiple thyroid nodules on sonography. J Clin Endocrinol Metab. 2006; 91:3411–3417.
8. Akama T, Sue M, Kawashima A, Wu H, Tanigawa K, Suzuki S, Hayashi M, Yoshihara A, Ishido Y, Ishii N, Suzuki K. Identification of microRNAs that mediate thyroid cell growth induced by TSH. Mol Endocrinol. 2012; 26:493–501.
9. Machado DS, Sabet A, Santiago LA, Sidhaye AR, Chiamolera MI, Ortiga-Carvalho TM, Wondisford FE. A thyroid hormone receptor mutation that dissociates thyroid hormone regulation of gene expression in vivo. Proc Natl Acad Sci U S A. 2009; 106:9441–9446.
10. Biondi B, Filetti S, Schlumberger M. Thyroid-hormone therapy and thyroid cancer: a reassessment. Nat Clin Pract Endocrinol Metab. 2005; 1:32–40.
11. Haymart MR, Repplinger DJ, Leverson GE, Elson DF, Sippel RS, Jaume JC, Chen H. Higher serum thyroid stimulating hormone level in thyroid nodule patients is associated with greater risks of differentiated thyroid cancer and advanced tumor stage. J Clin Endocrinol Metab. 2008; 93:809–814.
12. Boelaert K. The association between serum TSH concentration and thyroid cancer. Endocr Relat Cancer. 2009; 16:1065–1072.
13. Fiore E, Vitti P. Serum TSH and risk of papillary thyroid cancer in nodular thyroid disease. J Clin Endocrinol Metab. 2012; 97:1134–1145.
14. Lv KX, Song ZM, Zhu LG, Sun ZQ, He YJ. Diagnostic value of serum thyroid stimulating hormone and thyroglobulin levels in differentiating thyroid benign and malignant nodules. Labeled Immunoassays Clin Med. 2014; 21:74–76.
15. Huang J, Zhang WJ, Wu JF, Liu YC, Zhang G, Xue G. The serum TSH, TgAb, TpoAb value to the diagnosis of thyroid diseases. Chongqing Medicine. 2013; 42:3875–3880.
16. Li X, Qiu WS, Guo WP, Huang Y, Jiang H, Wu JK, Liu RL, Huang ZN, Liu RB. Research of the relationship between thyroid autoantibodies and thyroid cancer. Chin J Exp Surg. 2011; 28:1986–1987.
17. Chen N, Jin XS, Jiao ZW. Clinical study on the serum levels of thyroid stimulating hormone of patients with thyroid cancer. Medical Research and Education. 2015; 32:51–54.
18. Yu YJ, Yang CZ, Guan XH, Wang LC, Wu SB, Liu M, Xiao L, Zhang D, Liu CY. Relationship between thyroid carcinoma, Hashimoto’s thyroiditis and other related risk factors. Int J Endocrinol Metab. 2015; 35:27–30.
19. Chen X, Guo ZH, Luo HY, Huang SY, Xu MQ, Gong YN. Relationship between thyroid hormones and the nature of thyroid nodules. Tianjin Medical Journal. 2014; 42:687–689.
20. Zheng DM, Lu N, Chen Q, Zhang HQ, Jiang XY, Guan QB, Zhao JJ. Clinical analysis of thyroid nodules. Journal of Shandong University (Health Sciences). 2009; 47:14–20.
21. Wang XX, Wang F, Wang ZC, Wang YG, Zhao WJ. A study of the relationship between preoperative serum thyrotropin level and thyroid nodules. Progress in Modern Biomedicine. 2012; 12:4108–4112.
22. Hao WW, Li XL. Study on the relationship between serum level of TSH and benign or malignant thyroid tumors. Henan Medical Research. 2013; 22:161–164.
23. Li X, Zhao ZJ, Fan XY, Xie DF, Ye L. Study on correlation between thyroid stimulating hormone and differentiated thyroid cancer. Chinese Journal of Biochemical Pharmaceutics. 2015; 35:107–109.
24. Wei W, Zeng XY, Zhang L. Relationship of serum thyroid stimulating hormone level with differentiated thyroid cancer. Chin J Endocrinol Metab. 2013; 29:400–402.
25. Shi LF, Guan HX, Li YS, Li J, Shan ZY, Teng WP. Association of preoperative serum thyrotropin level with benign or malignant thyroid nodules. Chin J Endocrinol Metab. 2010; 26:213–214.
26. Bai JC, Liu QL. Expression of thyrotropin serum concentrations in papillary thyroid microcancers and its significance. Ningxia Med J. 2012; 34:502–503.
27. Zhu HJ. Correlation of serum thyrotropin thyroxine levels and thyroid cancer. China Modern Doctor. 2012; 50:11–13.
28. Wang Q, Yang ZG, Xu HD, Xing XJ. Study on the relationship between serum thyroid stimulating hormone concentration and thyroid cancer incidence. China Oncology. 2012; 22:860–863.
29. Aibaibula R, Kadeer P, Qiang BR. Correlation between serum thyroid stimulating hormone level and benign and malignant thyroid nodules. China Health Standard Management. 2015; 6:145–147.
30. Ye H, Zhao DW, Wang NP, Gao QJ, Zhou Y, Duan HS, Gao RJ. Clinical study on the relationship between the canceration of thyroid nodular goiter and serum TSH concentration. Guizhou Medical Journal. 2010; 34:596–598.
31. Xu XB, Liu WY. Relationship between preoperative serum TSH concentration and thyroid carcinoma in patients with nodular goiter. Chin J Bases Clin General Surg. 2012; 19:58–61.
32. Li JZ, Liu X, Zhang LY, Jin YJ. Association between the serum TSH concentration and thyroid cancer incidence. Journal of Shandong University (Health Sciences). 2011; 49:10–13.
33. Chen G, Zhuang LD, Zhang W, Su JR, Hu D, Wu Q. Clinical application of detection of serum TSH and TG in the prediction of benign and malignant thyroid nodules in preoperative patients. China Tropical Medicine. 2015; 15:1139–1143.
34. Sang W, Tian L, Guo CJ, Jiang JF, Shang XQ, Li F, Zhao J. The expression and significance of hormothyrin and thyroid hormone in thyroid cancer. Progress in Modern Biomedicine. 2010; 10:715–717.
35. Yan L, Li QH, Wang SF, Di W. Relationship between preoperative serum thyrotropin (TSH) level and the nature of thyroid nodule. Chinese Journal of General Surgery. 2011; 21:1373–1376.
36. Wang PS, Li HH, Huang TL, Long MY, Luo DY, Huang MQ, Peng XZ. Serum thyroid stimulating hormone level and risks of differentiated thyroid cancer. Chin Arch Gen Surg (Electronic Edition). 2011; 5:512–515.
37. Yao L, Wang Y, Yan YQ, Wang JK, Tang JS. Relationship between serum TSH concentrations and neck lymph node metastasis of differentiated thyroid cancer. Journal of Hainan Medical University. 2014; 20:1257–1259.
38. Li J. Analysis on the clinical diagnosis of 144 cases of thyroid nodule. Hainan Medical Journal. 2012; 23:80–81.
39. Kong N, Chen XY, Zhang CY, Han X. Comparative analysis of clinical data among 385 postoperative patients with thyroid benign and malignant nodules. Chin J Endocrinol Metab. 2012; 28:806–810.
40. Chiu HK, Sanda S, Fechner PY, Pihoker C. Correlation of TSH with the risk of paediatric thyroid carcinoma. Clin Endocrinol (Oxf). 2012; 77:316–322.
41. Zeng R, He JD, Zhang JP, Zuo RX, Zheng YQ, Yan XM. Analysis of the clinicopathological characteristics of differentiated thyroid carcinoma in women. Chin J Clin Oncol. 2014; 41:781–786.
42. Kim HK, Yoon JH, Kim SJ, Cho JS, Kweon SS, Kang HC. Higher TSH level is a risk factor for differentiated thyroid cancer. Clin Endocrinol (Oxf). 2013; 78:472–477.
43. Sohn SY, Kim HJ, Jang HW, Kim SW, Chung JH. Lack of association between high serum thyroid-stimulating hormone level and risk of papillary thyroid microcarcinomas. Head Neck. 2014; 36:43–46.
44. Zafón C, Obiols G, Mesa J. Preoperative TSH level and risk of thyroid cancer in patients with nodular thyroid disease: nodule size contribution. Endocrinol Nutr. 2015; 62:24–28.
45. Mussa A, Salerno MC, Bona G, Wasniewska M, Segni M, Cassio A, Vigone MC, Gastaldi R, Iughetti L, Santanera A, Capalbo D, Matarazzo P, De Luca F, et al. Serum thyrotropin concentration in children with isolated thyroid nodules. J Pediatr. 2013; 163:1465–1470.
46. Wu X, Lun Y, Jiang H, Gang Q, Xin S, Duan Z, Zhang J. Coexistence of thyroglobulin antibodies and thyroid peroxidase antibodies correlates with elevated thyroid-stimulating hormone level and advanced tumor stage of papillary thyroid cancer. Endocrine. 2014; 46:554–560.
47. Vasileiadis I, Boutzios G, Charitoudis G, Koukoulioti E, Karatzas T. Thyroglobulin antibodies could be a potential predictive marker for papillary thyroid carcinoma. Ann Surg Oncol. 2014; 21:2725–2732.
48. Wang L, Li H, Yang Z, Guo Z, Zhang Q. Preoperative Serum Thyrotropin to Thyroglobulin Ratio Is Effective for Thyroid Nodule Evaluation in Euthyroid Patients. Otolaryngol Head Neck Surg. 2015; 153:15–19.
49. Jonklaas J, Danielsen M, Wang H. A pilot study of serum selenium, vitamin D, and thyrotropin concentrations in patients with thyroid cancer. Thyroid. 2013; 23:1079–1086.
50. Zeng Q, Liu J, Zhu J, Hu GH. Association between preoperative serum thyroid-stimulating hormone level and nonfunctioning malignant nodule thyroid disease. J Clin Otorhinolaryngol Head Neck Surg. 2014; 28:1931–1933.
51. Gul K, Ozdemir D, Dirikoc A, Oguz A, Tuzun D, Baser H, Ersoy R, Cakir B. Are endogenously lower serum thyroid hormones new predictors for thyroid malignancy in addition to higher serum thyrotropin? Endocrine. 2010; 37:253–260.
52. Kim ES, Lim DJ, Baek KH, Lee JM, Kim MK, Kwon HS, Song KH, Kang MI, Cha BY, Lee KW, Son HY. Thyroglobulin antibody is associated with increased cancer risk in thyroid nodules. Thyroid. 2010; 20:885–891.
53. Moon SS, Lee YS, Lee IK, Kim JG. Serum thyrotropin as a risk factor for thyroid malignancy in euthyroid subjects with thyroid micronodule. Head Neck. 2012; 34:949–952.
54. Jung E, Shon H. Association between serum TSH level and papillary thyroid microcarcinoma in Korean euthyroid patients. Thyroid. 2011; 21:A93.
55. Dorange A, Triau S, Mucci-Hennekinne S, Bizon A, Laboureau-Soares S, Illouz F, Rodien P, Rohmer V. An elevated level of TSH might be predictive of differentiated thyroid cancer. Ann Endocrinol (Paris). 2011; 72:513–521.
56. Jin J, Machekano R, McHenry CR. The utility of preoperative serum thyroid-stimulating hormone level for predicting malignant nodular thyroid disease. Am J Surg. 2010; 199:294–297; discussion 298.
57. Kim KW, Park YJ, Kim EH, Park SY, Park do J, Ahn SH, Park do J, Jang HC, Cho BY. Elevated risk of papillary thyroid cancer in Korean patients with Hashimoto’s thyroiditis. Head Neck. 2011; 33:691–695.
58. Papendieck P, Gruñeiro-Papendieck L, Venara M, Acha O, Cozzani H, Mateos F, Maglio S, Calcagno ML, Bergada I, Chiesa A. Differentiated Thyroid Cancer in Children: Prevalence and Predictors in a Large Cohort with Thyroid Nodules Followed Prospectively. J Pediatr. 2015; 167:199–201.
59. Duran AO, Anil C, Gursoy A, Nar A, Altundag O, Inanc M, Bozkurt O, Tutuncu NB. The relationship between thyroid volume and malignant thyroid disease. Med Oncol. 2014; 31:814.
60. Li T, Sheng JG, Li WQ, Shi YQ, Chen XY, Zhang JQ, Liu HM, Yu HY, Cai QC, Liu ZM. The derivation and validation of a prediction rule for differential diagnosis of thyroid nodules. Chin J Intern Med. 2013; 52:945–950.
61. Zhang MF, Hu Y, Zhou GY, Zhang M, Li SQ. Association of serum antithyroid antibodies with risk of thyroid cancer. Chinese Journal of General Practice. 2014; 12:356–358.
62. Wang YL, Feng SH, Guo SC, Wei WJ, Li DS, Wang Y, Wang X, Wang ZY, Ma YY, Jin L, Ji QH, Wang JC. Confirmation of papillary thyroid cancer susceptibility loci identified by genome-wide association studies of chromosomes 14q13, 9q22, 2q35 and 8p12 in a Chinese population. J Med Genet. 2013; 50:689–695.
63. Yan HX, Gu WJ, Yang GQ, Ba JM, Wang XL, Du J, Ouyang JZ, Jin N, Lv ZH, Dou JT, Mu YM, Lu JM. Association of serum thyrotropin level with papillary thyroid microcarcinoma. Chin J Endocrinol Metab. 2014; 30:669–672.
64. Fiore E, Rago T, Provenzale MA, Scutari M, Ugolini C, Basolo F, Di Coscio G, Berti P, Grasso L, Elisei R, Pinchera A, Vitti P. Lower levels of TSH are associated with a lower risk of papillary thyroid cancer in patients with thyroid nodular disease: thyroid autonomy may play a protective role. Endocr Relat Cancer. 2009; 16:1251–1260.
65. Huan Q, Wang K, Lou FC, Zhang L, Huang QX, Han YF, Sun HC, Zhu L, Lin P, Song J, Liu FQ, Wang Q, Hou WK. Epidemiological characteristics of thyroid nodules and risk factors for malignant nodules: a retrospective study from 6,304 surgical cases. Chin Med J. 2014; 127:2286–2292.
66. Canaris GJ, Manowitz NR, Mayor G, Ridgway C. The Colorado thyroid disease prevalence study. Arch Intern Med. 2000; 160:526–534.
67. Pujol P, Daures JP, Nsakala N, Baldet L, Bringer J, Jaffiol C. Degree of thyrotropin suppression as a prognostic determinant in differentiated thyroid cancer. J Clin Endocrinol Metab. 1996; 81:4318–4323.
68. Lohmueller KE, Pearce CL, Pike M, Lander ES, Hirschhorn JN. Meta-analysis of genetic association studies supports a contribution of common variants to susceptibility to common disease. Nat Genet. 2003; 33:177–182.
69. Chaukar DA, Rangarajan V, Nair N, Dcruz AK, Nadkarni MS, Pai PS, Mistry RC. Pediatric Thyroid Cancer. J Surg Oncol. 2005; 92:130–133.
70. Kimura T, Van Keymeulen A, Golstein J, Fusco A, Dumont JE, Roger PP. Regulation of thyroid cell proliferation by TSH and other factors: a critical evaluation of in vitro models. Endocr Rev. 2001; 22:631–656.
71. Carayon P, Thomas-Morvan C, Castanas E, Tubiana M. Human thyroid cancer: membrane thyrotropin binding and adenylate cyclase activity. J Clin Endocrinol Metab. 1980; 51:915–920.
72. Ichikawa Y, Saito E, Abe Y, Homma M, Muraki T. Presence of TSH receptor in thyroid neoplasms. J Clin Endocrinol Metab. 1976; 42:395–398.
73. Pujol P, Daures JP, Nsakala N, Baldet L, Bringer J, Jaffiol C. Degree of thyrotropin suppression as a prognostic determinant in differentiated thyroid cancer. J Clin Endocrinol Metab. 1996; 81:4318–4323.
74. Lee JH, Kim Y, Choi JW, Kim YS. The association between papillary thyroid carcinoma and histologically proven Hashimoto’s thyroiditis: a meta-analysis. Eur J Endocrinol. 2013; 168:343–349.
75. Panicker V, Wilson SG, Walsh JP, Richards JB, Brown SJ, Beilby JP, Bremner AP, Surdulescu GL, Qweitin E, Gillham-Nasenya I, Soranzo N, Lim EM, Fletcher SJ, et al. A locus on chromosome 1p36 is associated with thyrotropin and thyroid function as identified by genome-wide association study. Am J Hum Genet. 2010; 87:430–435.
76. Arnaud-Lopez L, Usala G, Ceresini G, Mitchell BD, Pilia MG, Piras MG, Sestu N, Maschio A, Busonero F, Albai G, Dei M, Lai S, Mulas A, et al. Phosphodiesterase 8B gene variants are associated with serum TSH levels and thyroid function. Am J Hum Genet. 2008; 82:1270–1280.
77. Gudmundsson J, Sulem P, Gudbjartsson DF, Jonasson JG, Sigurdsson A, Bergthorsson JT, He H, Blondal T, Geller F, Jakobsdottir M, Magnusdottir DN, Matthiasdottir S, Stacey SN, et al. Common variants on 9q22.33 and 14q13.3 predispose to thyroid cancer in European populations. Nat Genet. 2009; 41:460–464.
78. Gudmundsson J, Sulem P, Gudbjartsson DF, Jonasson JG, Masson G, He H, Jonasdottir A, Sigurdsson A, Stacey SN, Johannsdottir H, Helgadottir HT, Li W, Nagy R, et al. Discovery of common variants associated with low TSH levels and thyroid cancer risk. Nat Genet. 2012; 44:319–322.
79. Moher D, Liberati A, Tetzlaff J, Altman DG. Preferred reporting items for systematic reviews and meta-analyses: the PRISMA statement. Ann Intern Med. 2009; 151:264–269, W264.
80. Stang A. Critical evaluation of the Newcastle–Ottawa scale for the assessment of the quality of nonrandomized studies in meta-analyses. Eur J Epidemiol. 2010; 25:603–605.
81. Hozo SP, Djulbegovic B, Hozo I. Estimating the mean and variance from the median, range, and the size of a sample. BMC Med Res Methodol. 2005; 5:13.
82. Sud S, Sud M, Friedrich JO, Meade MO, Ferguson ND, Wunsch H, Adhikari NK. High frequency oscillation in patients with acute lung injury and acute respiratory distress syndrome (ARDS): systematic review and meta-analysis. BMJ. 2010; 340:c2327.
83. Friedrich JO, Adhikari N, Herridge MS, Beyene J. Meta-analysis: low-dose dopamine increases urine output but does not prevent renal dysfunction or death. Ann Intern Med. 2005; 142:510–524.
84. DerSimonian R, Laird N. Meta-analysis in clinical trials. Control Clin Trials. 1986; 7:177–188.
85. Cochran WG. The combination of estimates from different experiments. Biometrics. 1954; 10:101–129.
86. Higgins JP, Spiegelhalter DJ. Being sceptical about meta-analyses: a Bayesian perspective on magnesium trials in myocardial infarction. Int J Epidemiol. 2002; 31:96–104.
87. Deeks JJ, Macaskill P, Irwig L. The performance of tests of publication bias and other sample size effects in systematic reviews of diagnostic test accuracy was assessed. J Clin Epidemiol. 2005; 58:882–893.
88. Glas AS, Lijmer JG, Prins MH, Bonsel GJ, Bossuyt PM. The diagnostic odds ratio: a single indicator of test performance. J Clin Epidemiol. 2003; 56:1129–1135.
89. Moses LE, Shapiro D, Littenberg B. Combining independent studies of a diagnostic test into a summary ROC curve: data-analytic approaches and some additional considerations. Stat Med. 1993; 12:1293–1316.
90. Begg CB, Mazumdar M. Operating characteristics of a rank correlation test for publication bias. Biometrics. 1994; 50:1088–1101.
91. Egger M, Smith G Davey, Schneider M. Bias in meta-analysis detected by a simple, graphical test. BMJ. 1997; 315:629–634.