
INTRODUCTION
GBC is an aggressive but uncommon malignancy affecting about 5000 individuals in the United States annually. Although the incidence of this disease is decreasing in the Western Hemisphere, it continues to pose a challenge in certain geographic locations such as in Latin America and Asia. [1, 2] Gallstone is a known risk factor for this cancer. However, the actual incidence of GBC in patients with gallstones is very low and 10-15% of adults in the western world have gallstones. Other risk factors include Salmonella typhi infection, primary sclerosing cholangitis, obesity, and gallbladder polyps. Still unknown is why certain ethnic groups have a higher predisposition to GBC than others. Molecular characterization of this cancer has been very limited thus far. We investigated the genetic variants in GBCs and compared them with in normal gallbladder tissue using the powerful RNA sequencing (RNA-seq) technology to better understand the pathogenesis of this disease and define targets for its therapy.
RESULTS
RNA-seq: gene expression alterations in GBC cases
We analyzed alterations in gene expression in eight GBC and three normal gallbladder tissue specimens using RNA-seq. We identified 519 genes as being differentially expressed in the GBC samples as compared with normal GB tissue (p < 0.05) (Figure 1, Supplemental Table 1). The heat map (Figure 2) depicts the 100 most frequently overexpressed and underexpressed genes in the GBC specimens. These genes were ranked according to log fold-change. Table 1 lists the top upregulated and down-regulated genes in the GBC specimens tested.
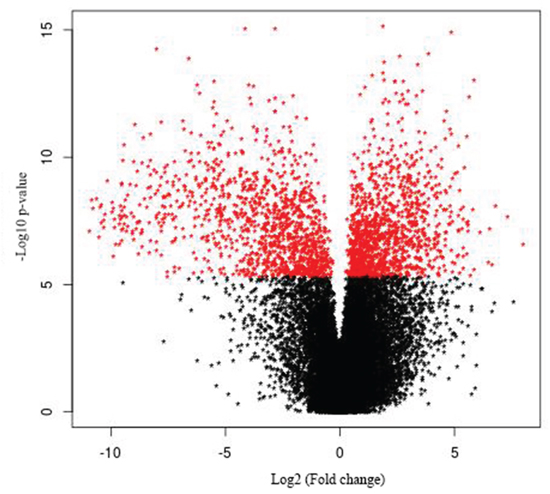
Figure 1: Volcano plot of gallbladder cancer vs. control. The 519 differentially expressed genes that fall above our threshold value are pictured in red.
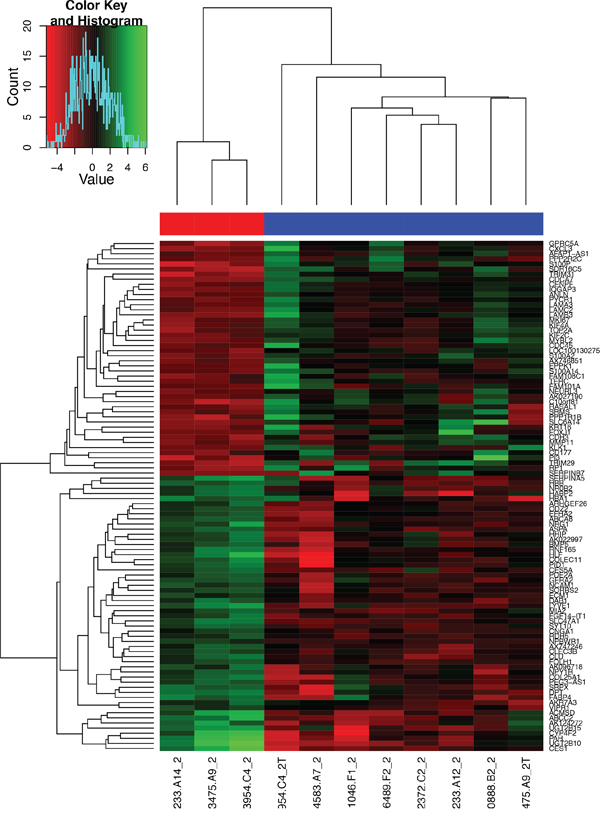
Figure 2: Heat map of the 100 most overexpressed (red) and underexpressed (green) genes in the formalin-fixed, paraffin-embedded GBC specimens. The depth of the colors reflects the degree of upregulation and downregulation: the deeper the color, the more extreme the log fold-change in expression.
Table 1: Fold-change in gene expression in GBC specimens
Gene |
Description |
Fold-change (log ratio) |
|---|---|---|
SERPINB3 |
Serpin peptidase inhibitor, clade B (ovalbumin), member 3 |
9.981 |
DUSP1 |
Dual-specificity phosphatase 1 |
9.504 |
FOXJ1 |
Forkhead box J1 |
9.236 |
CHP1 |
Calcineurin-like EF-hand protein 1 |
9.124 |
KLK5 |
Kallikrein-related peptidase 5 |
8.476 |
HOXB13 |
Homeobox B13 |
8.414 |
MAGEB2 |
Melanoma antigen family B, 2 |
8.211 |
KLK1 |
Kallikrein-related peptidase 1 |
7.974 |
HOXC10 |
Homeobox C10 |
7.816 |
CLCA4 |
Chloride channel accessory 4 |
7.767 |
DCAF12L1 |
DDB1- and CUL4-associated factor 12-like 1 |
-8.218 |
PPAN-P2RY11 |
PPAN-P2RY11 readthrough |
-8.041 |
MT1A |
Metallothionein 1A |
-7.726 |
ZNF275 |
Zinc finger protein 275 |
-7.636 |
GIMAP1-5 |
GIMAP1-GIMAP5 readthrough |
-7.572 |
MT1M |
Metallothionein 1M |
-7.342 |
APOA1 |
Apolipoprotein A-I |
-7.292 |
PGLYRP2 |
Peptidoglycan recognition protein 2 |
-7.274 |
SHBG |
Sex hormone-binding globulin |
-7.120 |
CYP1A1 |
Cytochrome P450, family 1, subfamily A, polypeptide 1 |
-6.770 |
Ingenuity pathway analysis (IPA)
We used IPA to identify the significantly different pathways in GBC and normal gallbladder tissue specimens and used log fold-change as a major observation of the cell signaling pathways analysis. Of the 519 significantly different genes, 503 genes were matched in the IPA database. Figure 3 shows the top 10 canonical pathways based on the 500 significant genes that differed in the GBC and normal gallbladder specimens. The IPA results demonstrated that the alteration of the LXR/RXR and FXR/RXR pathways occurring as a result of LXR and FXR down regulation play important roles in GBC (Table 2). Also, the results show the lipid metabolism pathway and gallbladder cell transport system are critical in gallbladder cancer pathogenesis. The causal network relationship of the top canonical pathways is shown in Figure 4.
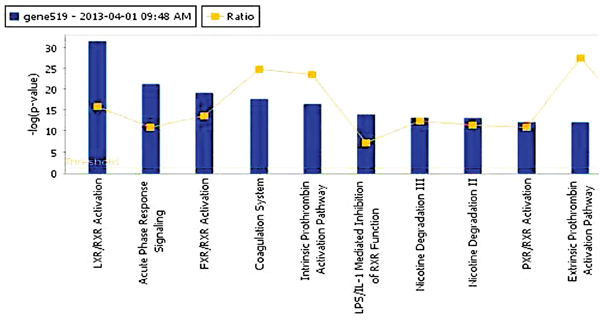
Figure 3: The top 10 canonical pathways that differed in GBC and normal gallbladder tissue specimens.
Table 2: Top canonical signaling pathways in gallbladder cancer
Pathway |
p |
Ratio |
|---|---|---|
LXR/RXR activation |
3.73 E-32 |
39/136 (0.287) |
Acute-phase response signaling |
6.58 E-22 |
35/179 (0.196) |
FXR/RXR activation |
9.14 E-20 |
25/101 (0.248) |
Coagulation system |
2.58 E-18 |
17/38 (0.447) |
Intrinsic prothrombin activation |
3.79 E-17 |
15/35 (0.429) |
Ingenuity pathway analysis (IPA)
We used IPA to identify the significantly different pathways in GBC and normal gallbladder tissue specimens and used log fold-change as a major observation of the cell signaling pathways analysis. Of the 519 significantly different genes, 503 genes were matched in the IPA database. Figure 3 shows the top 10 canonical pathways based on the 500 significant genes that differed in the GBC and normal gallbladder specimens. The IPA results demonstrated that the alteration of the LXR/RXR and FXR/RXR pathways occurring as a result of LXR and FXR down regulation play important roles in GBC (Table 2). Also, the results show the lipid metabolism pathway and gallbladder cell transport system are critical in gallbladder cancer pathogenesis. The causal network relationship of the top canonical pathways is shown in Figure 4.
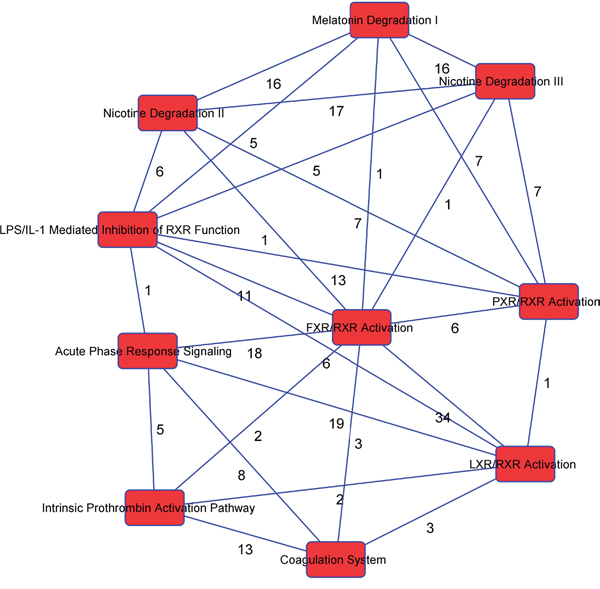
Figure 4: The interaction network analysis of key pathways in GBC.
Validation of next-generation sequencing data using RT-PCR
To validate the next-generation sequencing findings, we extracted total RNA from the 32 formalin-fixed, paraffin-embedded (FFPE) GBC and normal gallbladder tissue specimens. We assayed five upregulated genes and four down-regulated genes with different biologic functions and involvement in diverse molecular pathways. These genes consisted of overexpressed (SERPINB3, DUSP1, CHP1, KLK5, and KLK1) and underexpressed (MT1A, MT1M, APOA1, and SHBG) genes. RT-PCR data on the expression of these genes were normalized according to those on the expression of glyceraldehyde-3-phosphate dehydrogenase (GAPDH). The results demonstrated that SERPINB3 and KLK1 were expressed at higher levels and APOA1 was expressed at lower levels in GBC than in normal gallbladder tissue specimens. Furthermore, SERPINB3 expression was markedly higher in female than in male patients (Figure 5).
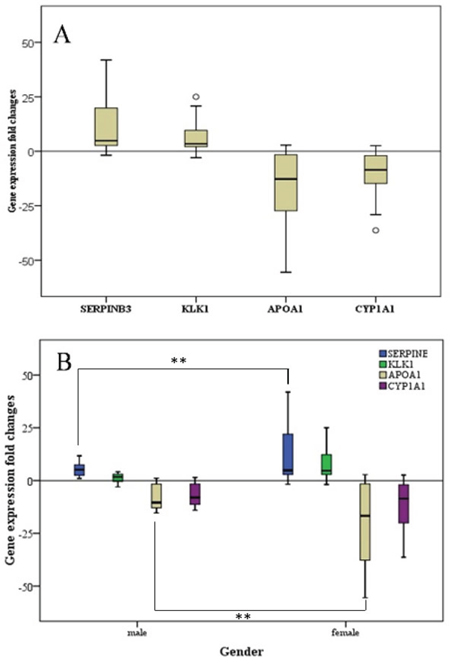
Figure 5: Fold-change in gene expression in GCB patients. A. The fold-change in all patients (n = 32). B. The fold-change in female patients (n = 21) compared with that in male patients (n = 11). **p < 0.01.
DISCUSSION
Our study suggests that unique genetic events result in alteration of the LXR/RXR and FXR/RXR pathways in GBC cells. LXRs are nuclear receptor family members that function in cholesterol transport, glucose metabolism and the modulation of inflammatory responses. There is now strong evidence to support the involvement of LXR and FXR in a variety of malignancies as tumor suppressors and the potential efficacy of their ligands in these diseases. FXR is a bile acid-activated transcription factor that is involved in metabolic regulation in the gut-liver axis. LXR and FXR play critical roles in bile acid homeostasis, glucose regulation and lipid metabolism.
Cancer cells depend on increased cholesterol biosynthesis for active signaling and tumor growth. The sterol response element-binding proteins are the master transcriptional regulators of cholesterol and fatty acid pathway. Nuclear sterol receptors (LXR and FXR) coordinate with these molecules when cholesterol is available. LXR and FXR function as intracellular sensors for sterols and bile acids, respectively. In addition, LXR/RXR is a “permissive heterodimer” that may be activated by either an LXR agonist or RXR ligand. The LXR/RXR heterodimer binds to a direct repeat 4 response element in regulatory regions of their target genes, such as ABCA1, ABCG5, and APOE [3, 4]. LXRs may also bind to all three peroxisome proliferator-activated receptor (PPAR) subtypes (PPARα, PPARγ, and PPARδ) with different binding affinities. PPARs, which are activated by free fatty acid, are widely accepted as having roles in metabolic pathways and inflammation. Mounting evidence demonstrates that PPARs repress nuclear factor NF-κB, signal transducer and activator of transcription, and AP-1 target genes in response to a variety of inflammatory stimuli. [5–7]
Prior studies have described the association of these pathways in the development of gallstones, the primary risk factor associated with GBC. LXR-β polymorphisms influence GBC susceptibility through estrogen and gallstone-dependent pathways [8]. LDLR-mediated hepatic cholesterol uptake and intestinal cholesterol absorption play important roles in LXR-promoted lithogenesis. [9] The ability of these receptors linking metabolism with inflammatory signaling makes them potentially attractive targets for treatment of metabolic diseases, inflammation, and cancer.
Many recent studies report the antiproliferative effect of LXR activation in colon [10–13], prostate [14–16], breast [17, 18], and pancreatic [19] cancer and GBC [20] cells. Deletion of both LXRβ alleles in female mice leads to a wide range of preneoplastic lesions in the gallbladder, such as dysplasia, metaplasia, hyperplasia, and adenomas on a background of chronic cholecystitis. [20] Interestingly, ovariectomy prevented the formation of these lesions, providing experimental evidence for an hormonal regulation of GBC progression and the well-known epidemiological association that women have a higher risk of developing GBC than men [21]. Importantly, these appeared in the absence of gallstones, suggesting a potential role for LXRβ in gallbladder carcinogenesis irrespective of lithiasis. [20] The inhibitory effects of LXR activation on cancer cells may be related to alteration of tumor metabolism, microenvironment, key growth pathways, and activation of apoptotic processes. [22] FXR also appears to be critical in the development of liver tumors. Huang et all showed that FXR -/- mice spontaneously developed liver tumors. [23] Given the critical roles of these receptors in various diseases, researchers have identified many natural and synthetic agonists of the LXRs. These agonists include the synthetic LXR agonist T0901317 [24–27] and the more LXR-selective agonist GW3965 [28], the partial and tissue-selective LXRβ-specific agonist WYE-672, and the intestine-specific ligand GW6340 without lipogenic activities. [7, 29, 30] Investigators have extensively studied the first-generation LXR agonists (T0901317 and GW3965) in various cancers, including colon, prostate, pancreatic, breast, and lung cancer. [31]
Our results demonstrated that the SERPINB3 and KLK1 genes were highly expressed in GBC specimens. SERPINB3 is a member of the ovalbumin-serine protease inhibitor family whose expression is upregulated in many advanced cancers with poor prognoses, including breast, lung, ovarian, and liver cancers [32–35]. Researchers detected high levels of SERPINB3 expression in primary liver tumors but not in normal liver tissue and showed a significant correlation with transforming growth factor-β1 and cytoplasmic β-catenin expression in hepatocellular carcinomas with poor prognoses. Furthermore, high levels of SERPINB3 expression have been significantly associated with early tumor recurrence [36]. SERPINB3 also induces epithelial-mesenchymal transition and cell proliferation associated with downregulation of E-cadherin expression and increased β-catenin expression. High expression of SERPIN3, therefore, maybe a marker of prognostic relevance in GBC. KLK1 is a member of the human kallikrein family and is functionally conserved in its capacity to release the vasoactive peptide and Lys-bradykinin. The kallikreins are serine proteases that have been recognized as cancer biomarkers and have also been implicated in cancer-related processes, including cell-growth regulation, angiogenesis, invasion and metastasis.
Our study has several limitations. While we hypothesize the role of LXR and FXR dimers in GBC pathogenesis, the nature of the pathogenic role of LXR suppression is not yet demonstrated in this observational, non-mechanistic study. Furthermore, our sample size is limited. However, the validation of our findings in a larger cohort adds to the strength of our findings.
In conclusion, this RNA sequencing analysis highlights the role of metabolic alterations in GBC and the potential benefit of targeting LXR/RXR pathway in this disease. LXR suppression may have an important pathogenic roles in GBC. LXR agonist may have clinical and therapeutic implications.
MATERIALS AND METHODS
Patients and tissues
The specimens used in this study were obtained from formalin-fixed, paraffin-embedded specimens from 32 patients with gallbladder carcinoma and controls (11 male and 21 female) at MD Anderson Cancer Center and Professor Kapoor’s laboratory. RNA-seq was performed for 11 cases, and reverse transcription (RT)-polymerase chain reaction (PCR) analysis was used to confirm these aberrant gene expressions found in RNA-seq in all 32 cases. All GBC specimens were confirmed by a pathologist at The University of Texas MD Anderson Cancer Center. Patient demographics, clinical and survival data, and treatment history were retrieved from the patients’ medical records. The study protocol was approved by the MD Anderson Institutional Review Board. Patient characteristics, including sex, age, GBC stage, and histology, are listed in Table 3.
Table 3: Patient characteristics
Case number |
Age at diagnosis, years |
Sex |
Ethnicity |
GBC stage at diagnosis |
Histology |
|---|---|---|---|---|---|
1 |
49 |
F |
White |
IIIA |
Adenocarcinoma |
2 |
61 |
M |
Hispanic |
IIIA |
Adenocarcinoma |
3 |
45 |
M |
Hispanic |
IVA |
Adenocarcinoma |
4 |
52 |
F |
Black |
II |
Adenocarcinoma |
5 |
55 |
F |
White |
IVB |
Adenocarcinoma |
6 |
70 |
F |
Hispanic |
II |
Adenocarcinoma |
7 |
66 |
F |
Hispanic |
II |
Adenocarcinoma |
8 |
84 |
M |
White |
IIIA |
Adenocarcinoma |
9 |
62 |
F |
White |
IIIB |
Adenocarcinoma |
10 |
62 |
F |
Hispanic |
III A |
Adenocarcinoma |
11 |
56 |
F |
White |
II |
Adenocarcinoma |
12 |
53 |
M |
White |
IVB |
Adenocarcinoma |
13 |
74 |
F |
White |
IIIA |
Adenocarcinoma |
14 |
77 |
F |
Hispanic |
IIIB |
Neuroendocrine |
15 |
55 |
F |
Hispanic |
II |
Adenocarcinoma |
16 |
61 |
M |
White |
IIIB |
Adenocarcinoma |
17 |
47 |
M |
White |
II |
Adenocarcinoma |
18 |
44 |
M |
White |
IIIB |
Adenosquamous |
19 |
58 |
M |
White |
IIIB |
Adenosquamous |
20 |
59 |
F |
White |
IIIB |
Adenosquamous |
21 |
68 |
M |
White |
II |
Adenocarcinoma |
22 |
58 |
F |
White |
IIIA |
Adenocarcinoma |
23 |
48 |
F |
Black |
II |
Adenocarcinoma |
24 |
73 |
F |
White |
IIIB |
Adenocarcinoma |
25 |
71 |
F |
Hispanic |
IIIA |
Adenocarcinoma |
26 |
68 |
F |
Hispanic |
II |
Adenocarcinoma |
27 |
82 |
F |
White |
II |
Adenocarcinoma |
28 |
55 |
F |
White |
IIIB |
Adenocarcinoma |
29 |
51 |
F |
Black |
IIIB |
Adenocarcinoma |
30 |
84 |
F |
White |
IIIA |
Adenocarcinoma |
31 |
58 |
M |
White |
II |
Adenosquamous |
32 |
61 |
M |
White |
IIIB |
Adenocarcinoma |
One slide from each specimen had been stained with hematoxylin and eosin and marked by a pathologist to ensure that the tissue section contained more than 80% tumor cells for macrodissection. Two sets of slides containing both normal GB and GBC tissue were scraped and poled into two separate tubes. These pooled specimens were then subjected to RNA isolation. An RNeasy kit (QIAGEN, Valencia, CA) was used for total RNA preparation. RNA samples were converted into cDNA libraries using a TruSeq Stranded Total RNA sample preparation kit (Illumina, San Diego, CA). Briefly, total RNA samples were concentration-normalized, and ribosomal RNA was removed using biotinylated probes that selectively bind ribosomal RNA species. This preserved messenger RNA and other noncoding RNA species, including long noncoding RNA, small nuclear RNA, and small nucleolar RNA. The resulting ribosomal RNA-depleted RNA was fragmented using heat in the presence of divalent cations, with fragmentation times varying according to input RNA degradation. Fragmented RNA was converted into double-stranded cDNA, with dUTP used in place of dTTP in a second-strand master mix. A single base was added to the cDNA, and forked adaptors that included index, or barcode, sequences were attached via ligation. The resulting molecules were amplified via PCR for 15 cycles. During PCR, the polymerase stalled when a dUTP base was encountered in the template. Final libraries were quantified via PCR, normalized to 2 nM, and pooled. Pooled libraries were bound to the surface of a flow cell, and each bound template molecule was clonally amplified up to 1000-fold to create individual clusters. Four fluorescently labeled nucleotides were then flowed over the surface of the flow cell and incorporated into each nucleic acid chain. Each nucleotide label acted as a terminator for polymerization. The fluorescence of each cluster was measured during the base identification. Dye was then enzymatically removed to allow for incorporation of the next nucleotide during the next cycle.
RNA extraction and quantitative real-time RT-PCR
Total RNA was isolated from the 32 GBC-patient FFPE tissue specimens. RNA was extracted as performed in a next-generation sequencing assay. cDNA was synthesized from 1 μg of total RNA using an iScript cDNA Synthesis Kit (Life Technologies, Hercules, CA). Real-time RT-PCR analysis was performed using a QuantiFast SYBR Green PCR Kit (QIAGEN). The primer sequences were synthesized by Sigma (St. Louis, MO). Gene expression levels were normalized according to the average cycle threshold values for the internal control gene glyceraldehyde-3-phosphate dehydrogenase. Cycle threshold values were extracted using the SDS 2.3 software program (Applied Biosystems, Carlsbad, CA). Data analysis was performed using the ΔΔCt method. The primer sequences used in quantitative RT-PCR are listed in Table 4.
Table 4: Primer sequences used in quantitative RT-PCR analysis
Gene |
Sequence 5’ to 3’ |
|
|---|---|---|
SERPINB3 |
Forward |
5'-GCA AAT GCT CCA GAA GAA AG-3' |
Reverse |
5'-CGA GGC AAA ATG AAA AAG ATG-3' |
|
DUSP1 |
Forward |
5’-CCT GAC AGC GCG GAATCT-3’ |
Reverse |
5’-GAT TTC CAC CGG GCC AC-3’ |
|
CHP1 |
Forward |
5’-CCA GAG GAT TCC AGA ACT TGC C-3’ |
Reverse |
5’- GAA TCC TCG GAA GTT TAC CTG ATC -3’ |
|
KLK5 |
Forward |
5’-CCG GTG ACA AAG CAG GTA GAG -3’ |
Reverse |
5’-GTG AAC TTG CAG AGG TTG GTG TA -3’ |
|
KLK1 |
Forward |
5’-GGA CTA CAG CCA CGA CCT CAT GCT GC-3’ |
Reverse |
5’-GTC GGG GAA TTC GAA GTC GTC TGG-3’ |
|
MT1M |
Forward |
5’-TTA TTT GGT GTA TAG TTT TTT TTG T-3’ |
Reverse |
5’-TAA ACC CAA CAT AAA TAC CAA ACA-3’ |
|
APOA1 |
Forward |
5'-CCC AGT TGT CAA GGA GCT TT-3' |
Reverse |
5'-TGG ATG TGC TCA AAG ACA GC-3' |
|
SHBG |
Forward |
5’-ACT CAG GCA GAA TTC AAT CTC -3’ |
Reverse |
5'- CTT TAA TGG GAA GCG TCA GT-3’ |
|
CYP1A1 |
Forward |
5’-TCC AAG AGT CCA CCC TTC C-3’ |
Reverse |
5’-AAG CAT GAT CAG TGT AGG GAT CT-3’ |
IPA
Ingenuity Pathway Analysis (IPA; QIAGEN) was used to identify the pathways that differed significantly in the GBC and normal gallbladder tissue specimens. A p value cutoff of 0.0001 was used to identify statistically significant difference in networks. This analysis was performed to identify gene interactions within these networks.
Bioinformatics and statistical analysis
The bioinformatic software program mRNAv7-RSEM (Quintiles, Durham, NC) was used to analyze RNA-seq data. To prepare the reads for alignment, the sequencing adapters and other low-quality bases were clipped. RSEM was used to quantify genes and transcripts The RSEM v1.1.18 program rsem-calculate-expression was run with parameters optimized for Illumina 50 x 50 paired-end sequencing. The University of California, Santa Cruz Known Gene transcriptome was used. Sustained misalignment of reads with the transcriptome may have resulted from missed or a lack of annotation or genomic DNA. To determine the origin of all reads as a method of quality control, the unaligned reads were aligned with the full genome (not the transcriptome) using BWA3. For cross-sample analysis, upper-quartile normalization of the read counts was performed. Two group comparisons were performed using edgeR [40, 41] and moderated separately using t-tests. The more conservative p value was used for any given gene. Heat maps were created using the R statistical programming language.
Abbreviations
FXR, farnesoid X receptor; GBC, gallbladder cancer; IPA, Ingenuity Pathway Analysis; LXR, liver X receptor; PCR, polymerase chain reaction; PPAR, peroxisome proliferator-activated receptor; RNA-seq, RNA sequencing; RT, reverse transcription; RXR, retinoid X receptor.
ACKNOWLEDGMENTS
We thank Mike Lu and Patty Maxin Foundation and Elaine Murpy Foundation support this study.
CONFLICTS OF INTEREST
The authors declare no conflicts of interest.
REFERENCES
1. Randi G, Franceschi S, La Vecchia C. Gallbladder cancer worldwide: geographical distribution and risk factors. Int J Cancer. 2006; 118:1591-1602.
2. Schottenfeld D, Beebe-Dimmer J. Chronic inflammation: a common and important factor in the pathogenesis of neoplasia. CA Cancer J Clin. 2006; 56:69-83.
3. Hong C, Tontonoz P. Liver X receptors in lipid metabolism: opportunities for drug discovery. Nature reviews Drug discovery. 2014; 13:433-444.
4. Calkin AC, Tontonoz P. Transcriptional integration of metabolism by the nuclear sterol-activated receptors LXR and FXR. Nature reviews Molecular cell biology. 2012; 13:213-224.
5. Yue L, Ye F, Gui C, Luo H, Cai J, Shen J, Chen K, Shen X, Jiang H. Ligand-binding regulation of LXR/RXR and LXR/PPAR heterodimerizations: SPR technology-based kinetic analysis correlated with molecular dynamics simulation. Protein Sci. 2005; 14:812-822.
6. Hong C, Tontonoz P. Coordination of inflammation and metabolism by PPAR and LXR nuclear receptors. Curr Opin Genet Dev. 2008; 18:461-467.
7. Steffensen KR, Jakobsson T, Gustafsson JA. Targeting liver X receptors in inflammation. Expert opinion on therapeutic targets. 2013; 17:977-990.
8. Sharma KL, Misra S, Kumar A, Mittal B. Association of liver X receptors (LXRs) genetic variants to gallbladder cancer susceptibility. Tumor Biology. 2013; 34:3959-3966.
9. Uppal H, Zhai Y, Gangopadhyay A, Khadem S, Ren S, Moser JA, Xie W. Activation of liver X receptor sensitizes mice to gallbladder cholesterol crystallization. Hepatology. 2008; 47:1331-1342.
10. Sasso GL, Bovenga F, Murzilli S, Salvatore L, Di Tullio G, Martelli N, D'Orazio A, Rainaldi S, Vacca M, Mangia A. Liver X receptors inhibit proliferation of human colorectal cancer cells and growth of intestinal tumors in mice. Gastroenterology. 2013; 144:1497-1507. e1413.
11. Vedin LL, Gustafsson JÅ, Steffensen KR. The oxysterol receptors LXRα and LXRβ suppress proliferation in the colon. Mol Carcinog. 2013; 52:835-844.
12. Chuu C-P. Modulation of liver X receptor signaling as a prevention and therapy for colon cancer. Med Hypotheses. 2011; 76:697-699.
13. Derangère V, Chevriaux A, Courtaut F, Bruchard M, Berger H, Chalmin F, Causse S, Limagne E, Végran F, Ladoire S. Liver X receptor β activation induces pyroptosis of human and murine colon cancer cells. Cell Death Differ. 2014; 21:1914-1924.
14. Fukuchi J, Kokontis JM, Hiipakka RA, Chuu C-p, Liao S. Antiproliferative effect of liver X receptor agonists on LNCaP human prostate cancer cells. Cancer Res. 2004; 64:7686-7689.
15. Pommier A, Alves G, Viennois E, Bernard S, Communal Y, Sion B, Marceau G, Damon C, Mouzat K, Caira F. Liver X Receptor activation downregulates AKT survival signaling in lipid rafts and induces apoptosis of prostate cancer cells. Oncogene. 2010; 29:2712-2723.
16. Chuu C-P, Kokontis JM, Hiipakka RA, Liao S. Modulation of liver X receptor signaling as novel therapy for prostate cancer. J Biomed Sci. 2007; 14:543-553.
17. Nelson ER, Wardell SE, Jasper JS, Park S, Suchindran S, Howe MK, Carver NJ, Pillai RV, Sullivan PM, Sondhi V. 27-Hydroxycholesterol links hypercholesterolemia and breast cancer pathophysiology. Science. 2013; 342:1094-1098.
18. Nguyen-Vu T, Vedin L-L, Liu K, Jonsson P, Lin JZ, Candelaria NR, Candelaria LP, Addanki S, Williams C, Gustafsson J-A. Liver X receptor ligands disrupt breast cancer cell proliferation through an E2F-mediated mechanism. Breast cancer research. 2013; 15:R51.
19. Candelaria NR, Addanki S, Zheng J, Nguyen-Vu T, Karaboga H, Dey P, Gabbi C, Vedin L-L, Liu K, Wu W. Antiproliferative effects and mechanisms of liver X receptor ligands in pancreatic ductal adenocarcinoma cells. PLoS One. 2014;9:e106289.
20. Gabbi C, Kim H-J, Barros R, Korach-Andrè M, Warner M, Gustafsson J-Å. Estrogen-dependent gallbladder carcinogenesis in LXRβ−/− female mice. Proceedings of the National Academy of Sciences. 2010; 107:14763-14768.
21. Hundal R, Shaffer EA. Gallbladder cancer: epidemiology and outcome. Clinical epidemiology. 2014; 6:99-109.
22. Bovenga F, Sabbà C, Moschetta A. Uncoupling nuclear receptor LXR and cholesterol metabolism in cancer. Cell metabolism. 2015; 21:517-526.
23. Huang X-f, Zhao W-y, Huang W-d. FXR and liver carcinogenesis. Acta pharmacologica Sinica. 2015; 36:37-43.
24. Houck KA, Borchert KM, Hepler CD, Thomas JS, Bramlett KS, Michael LF, Burris TP. T0901317 is a dual LXR/FXR agonist. Mol Genet Metab. 2004; 83:184-187.
25. Mitro N, Vargas L, Romeo R, Koder A, Saez E. T0901317 is a potent PXR ligand: implications for the biology ascribed to LXR. FEBS Lett. 2007; 581:1721-1726.
26. Rough JJ, Monroy MA, Yerrum S, Daly JM. Anti-proliferative effect of LXR agonist T0901317 in ovarian carcinoma cells. Journal of ovarian research. 2010; 3:1-10
27. Lin C-Y, Vedin L-L, Steffensen KR. The emerging roles of liver X receptors and their ligands in cancer. Expert opinion on therapeutic targets. 2015:1-11.
28. Kaneko T, Kanno C, Ichikawa-Tomikawa N, Kashiwagi K, Yaginuma N, Ohkoshi C, Tanaka M, Sugino T, Imura T, Hasegawa H. Liver X receptor reduces proliferation of human oral cancer cells by promoting cholesterol efflux via up-regulation of ABCA1 expression. Oncotarget. 2015; 6:33345-33357. doi: 10.18632/oncotarget.5428.
29. Loren J, Huang Z, Laffitte BA, Molteni V. Liver X receptor modulators: a review of recently patented compounds (2009 - 2012). Expert opinion on therapeutic patents. 2013; 23:1317-1335.
30. Viennois E, Mouzat K, Dufour J, Morel L, Lobaccaro J-M, Baron S. Selective liver X receptor modulators (SLiMs): what use in human health? Mol Cell Endocrinol. 2012; 351:129-141.
31. Lin C-Y, Gustafsson J-Å. Targeting liver X receptors in cancer therapeutics. Nature Reviews Cancer. 2015;15:216-224.
32. Lim W, Kim HS, Jeong W, Ahn SE, Kim J, Kim YB, Kim MA, Kim M-K, Chung HH, Song YS. Correction: SERPINB3 in the Chicken Model of Ovarian Cancer: A Prognostic Factor for Platinum Resistance and Survival in Patients with Epithelial Ovarian Cancer. PloS one. 2012; 7: e49869.
33. Collie-Duguid ES, Sweeney K, Stewart KN, Miller ID, Smyth E, Heys SD. SerpinB3, a new prognostic tool in breast cancer patients treated with neoadjuvant chemotherapy. Breast Cancer Res Treat. 2012; 132:807-818.
34. Sheshadri N, Catanzaro JM, Bott AJ, Sun Y, Ullman E, Chen EI, Pan JA, Wu S, Crawford HC, Zhang J, Zong WX. SCCA1/SERPINB3 promotes oncogenesis and epithelial-mesenchymal transition via the unfolded protein response and IL6 signaling. Cancer Res. 2014; 74:6318-6329.
35. Urquhart G, Kerr KM, Nicolson M, Loo PS, Sharma R, Shrimali R, Petty RD. Serpin B3 Is Associated with Poor Survival after Chemotherapy and Is a Potential Novel Predictive Biomarker in Advanced Non–Small-Cell Lung Cancer. Journal of Thoracic Oncology. 2013; 8:1502-1509.
36. Turato C, Vitale A, Fasolato S, Ruvoletto M, Terrin L, Quarta S, Morales RR, Biasiolo A, Zanus G, Zali N. SERPINB3 is associated with TGF-β1 and cytoplasmic β-catenin expression in hepatocellular carcinomas with poor prognosis. Br J Cancer. 2014; 110:2708-2715.
37. Gogol-Döring A, Chen W. (2012). An overview of the analysis of next generation sequencing data. Next Generation Microarray Bioinformatics: Springer), pp. 249-257.
38. Schmieder R, Lim YW, Rohwer F, Edwards R. TagCleaner: Identification and removal of tag sequences from genomic and metagenomic datasets. BMC bioinformatics. 2010; 11:341.
39. Li H, Handsaker B, Wysoker A, Fennell T, Ruan J, Homer N, Marth G, Abecasis G, Durbin R. The sequence alignment/map format and SAMtools. Bioinformatics. 2009; 25:2078-2079.
40. Zhou X, Lindsay H, Robinson MD. Robustly detecting differential expression in RNA sequencing data using observation weights. Nucleic Acids Res. 2014; 42:e91-e91.
41. Robinson MD, McCarthy DJ, Smyth GK. edgeR: a Bioconductor package for differential expression analysis of digital gene expression data. Bioinformatics. 2010; 26:139-140.