
INTRODUCTION
Cholangiocarcinoma, which occurs in epithelial cells within the biliary tree, is a relatively rare malignancy, but its incidence has been rising over the past several decades [1]. Cholangiocarcinoma accounts for about 3% of all gastrointestinal cancers worldwide [2]. Concerning the anatomical location, 60-70% of cholangiocarcinomas are perihilar, 20-30% are distal, and about 10% are intrahepatic [3]. According to the National Cancer Institute’s SEER program, the clinical outcomes for patients with perihilar cholangiocarcinoma (pCCA) are poor, with the 5-year survival rate ranging from 25% to 35% for localized cancer to less than 2% for patients with distant metastases [4]. Cholangiocarcinoma is characterized by a poor response to chemotherapy and radiation treatments, and the benefits to these treatments are not yet fully understood [5]. Surgical treatment, especially resections and liver transplantations, are most effective; however, only a few patients are eligible for such treatments because of late diagnoses and the complexity of the disease.
Identification of patients who may have poorer prognoses is required for the extensive treatments to improve their outcomes. For pCCAs, there are several staging systems, including the Bismuth-Corlette, Gazzaniga, and MSKCC (Memorial Sloan-Kettering Cancer Center) staging systems, which are widely used to predict the resectability of the tumor, but their roles in prognostic prediction are limited [6–8]. Further, the American Joint Committee on Cancer (AJCC) TNM and the Mayo Clinic systems have been proposed to predict the outcomes for the patients; however, they consider only a limited number of factors related to prognosis and lack accuracy [6, 9].
Nomograms provide a simple, graphics-based prognostic system to predict, for individual patients, their long-term survival based on personal and clinical characteristics. They have been proved to be more accurate than conventional systems for a variety of malignant neoplasms, including hepatocellular carcinoma, pancreatic adenocarcinoma, and intrahepatic cholangiocarcinoma [10–12]. For pCCAs, there is a lack of systematic evaluation of prognostic factors, especially for patients who have received curative intent surgery treatments. Here, clinical factors that may influence the prognosis of pCCA patients were systematically evaluated, and a nomogram was established to predict the long-term outcomes for pCCA patients after surgical treatment.
RESULTS
Participants characteristics of the primary training cohort
A total of 235 eligible patients were recruited from the Eastern Hepatobiliary Surgery Hospital of the Second Military Medical University as the primary training cohort between the years 2000 to 2009, and they were recognized as the primary training cohort to establish the prognostic nomogram. The follow-up time ranged from 1.7 to 143.9 months, with a median time of 23.3 months. The median overall survival (OS) time of the patients was 24.2 months (range, 1.7 to 75.0 months). The cumulative 1-, 3-, and 5-year survival rates of the patients were 77.4%, 28.9%, and 11.1%, respectively. 177 (75.3%) patients received R0 (complete) resections, and 58 (24.7%) received R1 (microscopic residual tumor) or R2 (macroscopic residual tumor) resections. The 1-, 3- and 5- year survival rates for patients with R0 and R1/R2 treatment were 84.8%, 35.0%, 24.3%, and 60.3%, 15.5%, 6.9%, respectively. The basic characteristics for the patients are shown in Table 1.
Table 1: Basic characteristics for the recruited participants in the primary training cohort (N = 235), internal validation cohort (N = 93), and external validation cohort (N = 84)
Demographic or characteristic factor |
Training cohort (N = 235) |
Internal cohort (N = 93) |
P-value* |
External cohort (N = 84) |
P-value# |
|---|---|---|---|---|---|
Age, years (± SD) |
56.8 ± 11.2 |
58.7 ± 9.1 |
0.119 |
58.4 ± 11.9 |
0.298 |
Sex (Male/Female) |
158/77 (67.2%/32.8%) |
54/39 (58.1%/41.9%) |
0.118 |
49/35 (58.3%/41.7%) |
0.142 |
Tumor size, cm (± SD) |
2.75 ± 1.04 |
2.61 ± 1.17 |
0.323 |
3.09 ± 1.28 |
0.028 |
Bismuth staging (I/II/IIIa/IIIb) |
17/52/56/110 (7.2%/22.1%/23.8%/46.8%) |
13/21/24/35 (14.0%/22.6%/25.8%/37.6%) |
0.284 |
2/13/32/37 (2.4%/15.5%/38.1%/44.0%) |
0.037 |
Gazzaniga staging (I/II/III/IV) |
60/133/34/8 (25.5%/56.6%/14.5%/3.4%) |
18/55/20/0 (19.4%/59.1%/21.5%/0.0%) |
0.097 |
27/10/4/4 (60.0%/22.2%/8.9%/8.9%) |
< 0.001 |
MSKCC T staging (T1/T2/T3) |
179/25/31 (76.2%/10.6%/13.2%) |
75/7/11 (80.6%/7.5%/11.8%) |
0.628 |
29/10/6 (64.4%/22.2%/13.3%) |
0.093 |
AJCC T staging (T1/T2/T3/T4) |
16/143/28/48 (6.8%/60.9%/11.9%/20.4%) |
2/61/15/15 (2.2%/65.6%/16.1%/16.1%) |
0.220 |
0/27/10/8 (0.0%/60.6%/22.2%/17.8%) |
0.104 |
AJCC N staging (N0/N1-2) |
172/63 (73.2%/26.8%) |
67/26 (72.0%/28.0%) |
0.833 |
25/20 (55.6%/44.4%) |
0.018 |
Differentiation (Low/Medium/High) |
26/199/10 (11.1%/84.7%/4.3%) |
1/90/2 (1.1%/96.8%/2.2%) |
0.007 |
7/33/5 (15.6%/73.3%/11.1%) |
0.103 |
Portal vein invasion |
|||||
None |
178 (75.7%) |
75 (80.6%) |
56 (66.7%) |
||
Ipsilateral portal vein branch |
25 (10.6%) |
7 (7.5%) |
9 (10.7%) |
||
Bifurcation |
10 (4.3%) |
2 (2.2%) |
8 (9.5%) |
||
Bifurcation plus portal vein branch |
10 (4.3%) |
2 (2.2%) |
5 (6.0%) |
||
Main portal vein encasement |
13 (5.5%) |
7 (7.5%) |
0.571 |
6 (7.1%) |
0.355 |
Hepatic artery invasion |
|||||
None |
203 (86.4%) |
70 (75.3%) |
62 (73.8%) |
||
Hepatic artery branch |
26 (11.1%) |
19 (20.4%) |
22 (26.2%) |
||
Main hepatic artery |
6 (2.6%) |
4 (4.3%) |
0.052 |
0 (0.0%) |
0.002 |
Perineural invasion (No/Yes) |
116/119 (49.4%/50.6%) |
19/74 (20.4%/79.6%) |
< 0.001 |
49/35 (58.3%/41.7%) |
0.158 |
Liver invasion (No/Yes) |
208/27 (88.5%/11.5%) |
70/23 (75.3%/24.7%) |
0.003 |
67/17 (79.8%/20.2%) |
0.046 |
Spigelian lobe resection (No/Yes) |
128/107 (54.5%/45.5%) |
53/40 (57.0%/43.0%) |
0.679 |
50/34 (59.5%/40.5%) |
0.423 |
Radiotherapy (No/Yes) |
185/50 (78.7%/21.3%) |
82/11 (88.2%/11.8%) |
0.047 |
81/3 (96.4%/3.6%) |
< 0.001 |
Chemotherapy (No/Yes) |
187/48 (79.6%/20.4%) |
78/15 (83.9%/16.1%) |
0.373 |
76/8 (90.4%/9.6%) |
0.024 |
Surgery treatment (R0/R1 or 2) |
177/58 (75.3%/24.7%) |
68/25 (73.1%/26.9%) |
0.679 |
59/25 (70.2%/29.8%) |
0.362 |
ECOG status (0/1/2-3) |
19/138/78 (8.1%/58.7%/33.2%) |
3/62/28 (3.2%/66.7%/30.1%) |
0.199 |
21/47/16 (25.0%/56.0%/19.0%) |
< 0.001 |
CA19-9 level (≤73.5/73.6-325.0/≥325.1 U/ml) |
78/78/79 (33.2%/33.2%/33.6%) |
24/42/27 (25.8%/45.2%/29.0%) |
0.122 |
28/24/32 (33.3%/28.6%/38.1%) |
0.680 |
Mayo Clinic (I/II/III-IV) |
12/107/116 (5.1%/45.5%/49.4%) |
0/46/47 (0%/49.5%/50.5%) |
0.083 |
6/19/59 (7.1%/22.6%/70.2%) |
0.001 |
Vascular encasement (No/Yes) |
167/68 (71.1%/28.9%) |
63/30 (67.7%/32.3%) |
0.554 |
46/38 (54.8%/45.2%) |
0.007 |
AJCC TNM staging (I/II/III/IV) |
14/113/54/54 (6.0%/48.1%/23.0%/23.0%) |
1/46/27/19 (1.1%/49.5%/29.0%/20.4%) |
0.197 |
5/23/33/23 (6.0%/27.4%/39.3%/27.4%) |
0.005 |
*P-value for the comparison between training cohort and internal validation cohort.
#P-value for the comparison between training cohort and external validation cohort.
Abbreviations: AJCC, American Joint Committee on Cancer; ECOG, Eastern Cooperative Oncology Group; MSKCC, Memorial Sloan Kettering Cancer Center; SD, Standard Deviation.
Overall survival prognostic factors for pCCA patients
The univariate analyses suggested that age, vascular encasement of the tumor, Gazzaniga stage, MSKCC stage, TNM stage, portal vein invasion status, hepatic artery invasion status, Eastern Cooperative Oncology Group (ECOG) status, plasma CA19-9 levels, surgery treatment outcomes (surgical margin), lymph node metastases, and Mayo Clinic stage were significantly associated with OS (Table 2) in the primary training cohort. Non-linear effects were evident for the continuous variant, age, on the hazard ratio for the OS of the participants (Supplementary Figure S1), and a restricted cubic spline model with three knots for age was applied in further analyses based on the optimized tests. With backward stepwise selection methods, age, treatment outcomes, portal vein invasion status, hepatic artery invasion, preoperative CA19-9 levels, and lymph node metastases were found to be independent prognosis factors for pCCA patients (Table 3).
Table 2: Univariate analysis for the associations between the personal and clinical characteristics and the OS for pCCA patients in the primary training cohort (N = 235)
Demographic or characteristic factor |
HR (95% CI) |
P-value |
|---|---|---|
Age (per year) |
1.02 (1.01-1.03) |
0.016 |
Sex (Female vs. Male) |
0.99 (0.73-1.34) |
0.940 |
Tumor size (per cm) |
1.08 (0.95-1.24) |
0.233 |
Differentiation |
||
Medium vs. Low |
0.70 (0.45-1.07) |
0.101 |
High vs. Low |
0.44 (0.19-1.03) |
0.060 |
Bismuth staging |
||
II vs. I |
0.90 (0.51-1.61) |
0.730 |
IIIa vs. I |
1.11 (0.93-1.97) |
0.712 |
IIIb vs. I |
1.28 (0.75-2.18) |
0.368 |
Gazzaniga staging |
||
II vs. I |
1.30 (0.92-1.83) |
0.138 |
III vs. I |
2.71 (1.70-4.32) |
< 0.001 |
IV vs. I |
2.40 (1.13-5.11) |
0.023 |
MSKCC T staging |
||
T2 vs. T1 |
1.03 (0.65-1.65) |
0.889 |
T3 vs.T1 |
2.11 (1.40-3.18) |
< 0.001 |
AJCC T staging |
||
T2 vs. T1 |
1.18 (0.67-2.05) |
0.568 |
T3 vs. T1 |
1.27 (0.65-2.48) |
0.491 |
T4 vs. T1 |
2.36 (1.28-4.35) |
0.006 |
AJCC N staging (N1/2 vs. N0) |
1.61 (1.17-2.22) |
0.004 |
Portal vein involvement |
||
Ipsilateral portal vein branch vs. None |
1.04 (0.65-1.66) |
0.865 |
Bifurcation vs. None |
1.20 (0.59-2.46) |
0.610 |
Bifurcation plus portal vein branch vs. None |
1.68 (0.82-3.44) |
0.156 |
With main portal vein encasement vs. None |
7.49 (4.02-13.95) |
< 0.001 |
Hepatic artery invasion |
||
Branch vs. None |
1.78 (1.15-2.74) |
0.009 |
Main hepatic artery vs. None |
4.63 (2.03-10.56) |
< 0.001 |
Perineural invasion (Yes vs. No) |
1.09 (0.82-1.44) |
0.571 |
Liver invasion (Yes vs. No) |
0.85 (0.55-1.33) |
0.477 |
Spigelian lobe resection (Yes vs. No) |
0.91 (0.68-1.21) |
0.498 |
Radiotherapy (Yes vs. No) |
1.01 (0.71-1.43) |
0.966 |
Chemotherapy (Yes vs. No) |
1.08 (0.77-1.52) |
0.662 |
Surgery treatment outcome |
||
R1/2 vs. R0 |
1.94 (1.41-2.66) |
< 0.001 |
ECOG status |
||
I vs. 0 |
2.02 (1.09-3.76) |
0.026 |
II-III vs. 0 |
2.08 (1.09-3.95) |
0.026 |
CA19-9 level (U/ml) |
||
Tertile 2 (73.5-325.0) vs. Tertile 1 (≤ 73.5) |
1.63 (1.14-2.32) |
0.008 |
Tertile 3 (≥ 325.1) vs. Tertile 1 (≤ 73.5) |
2.39 (1.68-3.41) |
< 0.001 |
Vascular encasement |
||
Yes vs. No |
1.65 (1.21-2.25) |
0.001 |
AJCC TNM staging |
||
II vs. I |
1.18 (0.65-2.16) |
0.586 |
III vs. I |
1.63 (0.86-3.09) |
0.134 |
IV vs. I |
2.44 (1.28-4.63) |
0.007 |
Mayo Clinic |
||
II vs. I |
1.81 (0.88-3.73) |
0.109 |
III-IV vs. I |
2.31 (1.12-4.77) |
0.023 |
Abbreviations: 95% CI, 95% confidential interval; AJCC, American Joint Committee on Cancer; ECOG, Eastern Cooperative Oncology Group; HR, hazard ratio; MSKCC, Memorial Sloan Kettering Cancer Center.
Table 3: Multivariate analysis for the primary training cohort (N = 235). The continuous variant, age, was transformed with the restricted cubic spline model with 3 knots
Demographic or characteristic factor |
HR (95% CI) |
P-value |
|---|---|---|
Age (≤ 57.5 years, per year) |
1.06 (1.02-1.09) |
0.001 |
Age’ (> 57.5 years, per year) |
0.94 (0.91-0.98) |
0.002 |
Surgery treatment outcome (R1/2 vs. R0) |
1.52 (1.09-2.12) |
0.014 |
Portal vein involvement |
||
Main vs. Branch or None |
5.51 (2.88-10.55) |
< 0.001 |
Hepatic artery invasion |
||
Branch vs. None |
1.58 (1.01-2.47) |
0.048 |
Main hepatic artery vs. None |
3.75 (1.57-8.99) |
0.003 |
AJCC N staging (N1/2 vs. N0) |
1.53 (1.10-2.12) |
0.012 |
CA19-9 (U/ml) |
||
Tertile 2 (73.6-325.0) vs. Tertile 1 (≤ 73.5) |
1.70 (1.18-2.44) |
0.004 |
Tertile 3 (≥ 325.1) vs. Tertile 1 (≤ 73.5) |
2.30 (1.60-3.30) |
< 0.001 |
Abbreviations: 95% CI, 95% confidential interval; AJCC, American Joint Committee on Cancer; HR, hazard ratio.
Prognostic nomogram of overall survival for pCCA patients
Based on the independent prognostic factors, a nomogram to predict the OS of the pCCA patients was established (Figure 1). The C-index for the OS prediction was 0.68 (95% CI, 0.61 to 0.71). The calibration plot for the probability of survival at 3 or 5 years after surgery showed an optimal calibration between the deaths from the prediction of the nomogram and those derived from the cumulative incidence estimates (Figure 2A and 2B).
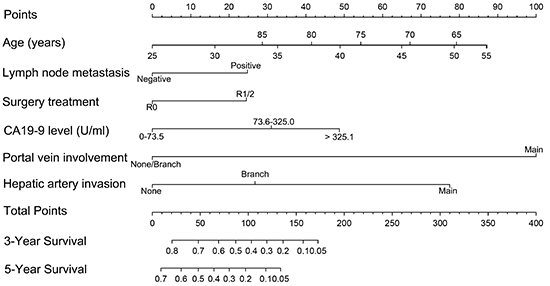
Figure 1: The survival nomogram for the pCCA patients. (To use the nomogram, the individual patient’s value is located on each variable axis, and a line is drawn upward to determine the risk score for each variant. The sum of these scores is located on the total points axis, and a line is drawn downward to the survival axes to determine the probability of 3- or 5-year survival).
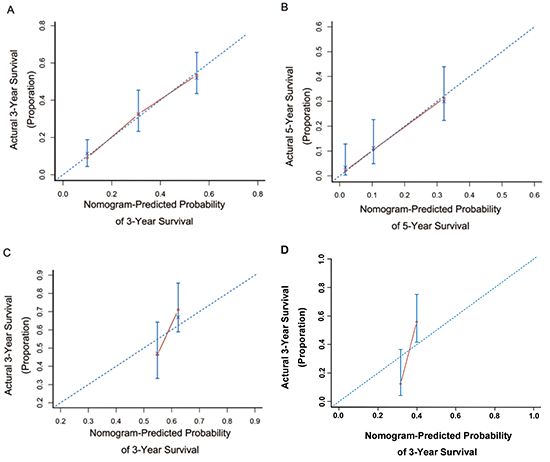
Figure 2: Calibration curves for predicting patient survival at A. 3 years and B. 5 years in the primary cohort and at 3 years in the internal validation cohort C. or external validation cohort D. Nomogram-predicted probability of OS is plotted on the x-axis; actual OS is plotted on the y-axis.
Comparison of predictive accuracy for overall survival between the nomogram and the conventional staging systems
The predictive accuracy for the derived nomogram and the conventional staging systems for pCCA patients were compared with the C-index criteria and time-dependent ROC curves. The TNM and Mayo Clinic staging systems showed better prognostic stratification for pCCA patients than the Bismuth, Gazzainiga, and MSKCC systems (Figure 3). In the primary cohort, the nomogram displayed better accuracy in predicting both short- and long-term survival, as determined by time-dependent ROC curves. The C-index of the nomogram (0.68) was significantly higher than the conventional TNM (0.58), Mayo Clinic (0.56), Bismuth-Corlette (0.55), Gazzaniga (0.58), and MSKCC (0.55) staging systems (P < 0.05). The time-dependent ROC curves also suggested that the predictive accuracy for the nomogram was better than the conventional staging systems (P < 0.05) at any specific time (Supplementary Figure S2).
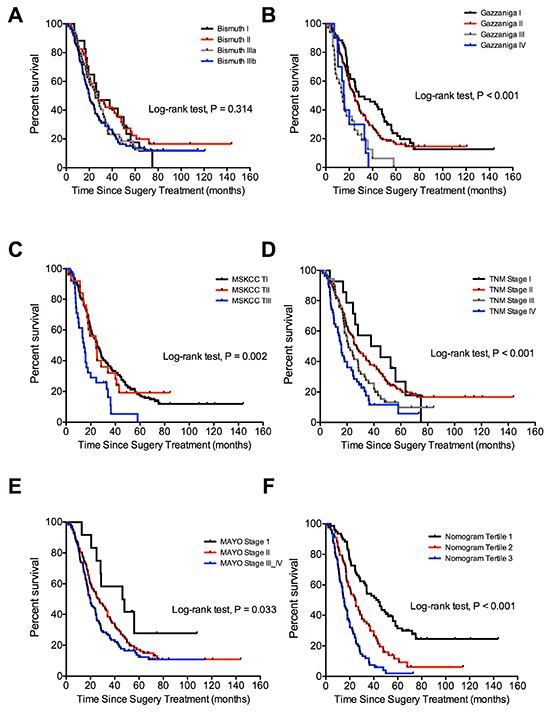
Figure 3: Comparison of the staging systems in the prediction of the OS for pCCA patients in primary training cohort (A. Bismuth-Corlette; B. Gazzaniga; C. MSKCC; D. AJCC TNM (seventh edition); E. Mayo Clinic; F. Nomogram risk score).
Internal validation of the prognostic prediction for nomogram
The internal validation cohort comprised 93 patients recruited from the same institution as the primary training cohort between the years 2010 to 2011. The detailed information for these patients is summarized in Table 1. The median follow-up time was 40.0 months (range, 1.9 to 52.0 months) and the median OS was 45.0 months (range, 1.9 to 52.0 months). The rates for deaths at 1 and 3 years post-surgery were 12.9% and 38.7%, respectively. The C-index of the nomogram for predicting the OS was 0.65 (95% CI, 0.56 to 0.74), and the calibration curve showed an optimal calibration between the nomogram prediction and the observation for the probability of 3-year survival (Figure 2C). For the validation cohort, the C-index for the nomogram (0.65) was significantly higher than that for the conventional staging systems. The C-index was 0.61 for the TNM, 0.56 for the Mayo Clinic, 0.54 for the Bismuth, 0.55 for the Gazzaniga, and 0.54 for the MSKCC staging systems. The predictive accuracy for the nomogram was higher than that for any of the conventional staging systems, as indicated by the time-dependent ROC curves (Supplementary Figure S3). The Kaplan-Meier survival plots for the conventional staging systems and the predictive results of the nomogram in the validation cohort are shown in Supplementary Figure S4.
External validation of the prognostic prediction for the nomogram
84 patients recruited from the First Affiliated Hospital of Sun Yat-Sen University between the years 2005 and 2011 were recognized as the external validation cohort. Detailed information is provided in Table 1. The follow-up time ranged from 3.0 to 117.1 months, with a median of 20.0 months. The median OS of the patients was 24.0 months (range, 3.0 to 117.1 months). The death rate was 25.0% and 56.0% for the patients at 1- and 3-years, respectively. The C-index of the nomogram in OS predicting was 0.68 (95% CI, 0.61 to 0.75), and the calibration curve showed an optimal calibration between the nomogram prediction and the observation of the survival probability at 3-year after the surgery (Figure 2D). The C-index for the nomogram was higher than those for the conventional staging systems. The C-index was 0.63 for Mayo Clinic, 0.59 for TNM, 0.58 for Bismuth, 0.52 for Gazzaniga, and 0.51 for MSKCC staging systems. The predictive accuracy for the nomogram was higher than conventional staging systems, as indicated by the time-dependent ROC curves (Supplementary Figure S5). The Kaplan-Meier survival plots for the conventional staging systems and the nomogram in the external validation cohort are in Supplementary Figure S6, which shows that the nomogram is more accurate in distinguishing those patients with worse from those with better OS (log-rank test, P < 0.001 for tertile categorized nomogram, and P = 0.008 to 0.571 for conventional systems).
DISCUSSION
Effective prediction of the short- and long-term survival of patients can guide clinical treatments. For pCCA, the Bismuth-Corlette, Gazzaniga, and MSKCC staging systems are most widely used to assess the resectability of tumors [6]. These systems were created based on the location and extent of cancer in the biliary tree, the portal vein invasion of the tumor, and lobar atrophy status; however, their efficacies as prognostics are limited [6]. The AJCC TNM staging was based only on pathological information of the resectable tumors and was expected to be useful in prediction for the OS of pCCA patients undergoing surgical resection [13, 14]; however, it has a lack of accuracy. Recently, the Mayo Clinic staging system showed an optimal stratification for pCCA patients receiving liver transplants or best supportive care [9]; however, the concordance score for patients who received resections was poor. This staging system encompasses only preoperative prognostic factors: ECOG status, CA19-9 levels, vascular encasement of the tumor, tumor number, tumor size, and metastasis [9]. The pathological characteristics of tumors, which influence the prognosis of the pCCA patients, are not included.
Here, we proposed a nomogram to predict the OS for those patients who received resections; the nomogram showed better accuracy than the conventional TNM and Mayo Clinic staging systems. We found that age, CA19-9 level, TNM stage, portal vein invasion, and the treatment outcomes (R0 and R1) were independent prognostic factors for pCCA patients. CA19-9 has been widely used as a diagnostic or prognostic marker for various types of cancers, including pCCA, colorectal cancer, and gastric cancer [15–17]. pCCA patients with preoperative CA19-9 levels < 150 U/ml showed better OS than those with higher CA19-9 levels [18]. pCCA patients with CA19-9 levels > 100 U/ml were associated with increased risk of recurrence for patients who received liver transplants [19], and pCCA patients with blood levels of CA19-9 over 1,000 U/ml were independently associated with worse OS [9]. We also found a negative association between the preoperative plasma CA19-9 levels and the OS of pCCA patients; however, the underlying mechanisms for the aberrant blood CA19-9 levels for pCCA patients are unknown. Lymph node metastasis was an independently adverse factor pCCA patients, an observation validated in other clinical studies [20, 21]. Several previous studies have found that vascular encasement, ECOG status, and the AJCC T stage are associated with pCCA prognosis [9, 22]. The prognostic effects of these factors are consistent with our current study; however, the multivariate analyses suggest that they were not independent prognostic factors for pCCA patients; this may be due to the high correlation with other variants, including portal vein invasion, hepatic artery invasion, and lymph node metastases (data not shown).
The prognostic effects of perineural invasion for patients with extrahepatic cholangiocarcinoma have been determined, showing that patients with perinerual invasion had worse prognoses relative to those who were negative in univariate but not multivariate analyses [23]. In our study, perineural invasion was not associated with the prognosis for pCCA patients, which may be due to the fact that extensive autonomic nerve dissection was performed for those patients. Complete surgical removal of the tumor is the standard treatment for resectable pCCAs, and the histological ductal margin status (R0 or R1/2) is associated with the OS of pCCA patients [24, 25]. We found that patients who received R0 treatment showed better OS than those with R1/2 treatment, which suggested that curative surgery is necessary to achieve a better prognosis. Portal vein invasion may affect the resectability of the pCCA patients and further influence the prognosis of the patients. Here, we found that bifurcation or ipsilateral branch portal vein involvement was not significantly associated with treatment outcomes (R0 or R1/2, data not shown) or with OS [26]. However, invasion of the main portal vein was independently associated with treatment outcomes (R0 or R1/2, data not shown) and with worse OS compared to those without main portal vein invasion. Although hepatic artery invasion had no significant effect on the resectability of pCCA tumors (data not shown), it was significantly associated with a worse prognosis of the patients. Patients with invasion of the branch hepatic artery or main hepatic artery showed a worse OS compared to those without hepatic artery invasion, because hepatic artery invasion may promote the metastasis of pCCA tumors.
Whether postoperative treatments, including radiation or chemotherapy, will benefit pCCA patients is controversial [18]. In our primary study cohort, 50 (21.3%) patients and 48 (20.4%) patients received radiation or chemotherapy treatment, respectively, after surgery. No significantly improved OS of these patients was evident regardless of the R0 or R1/2 resection, consistent with results of previous studies [18, 27]. However, other studies have shown a benefit of OS for those patients with positive resection margins (R1/2) or curative resected patients (R0) who received radiation treatment [5, 28]. More studies are warranted to address the optimal radiation dosing and postoperative treatments to improve the outcomes for pCCA patients.
Recently, Koerkamp et al. proposed a predictive nomogram for pCCA patients [29]. Three prognostic factors, differentiation, lymph node metastasis, and the resection margin status, were independently associated with disease-specific survival of pCCA patients after resections [29]. However, the sample size in the primary cohort was relatively small compared to that in the current study, and the predictive accuracy was not compared between the different staging systems, except for the TNM staging system. Due to a limited number of samples, the investigators did not determine the prognostic effects for portal vein or hepatic artery invasion on the DSS of the patients [29]. The prognostic effects for pre-operative CA19-9 levels were also not determined due to missing values [29]. Koerkamp et al. found that tumor differentiation was independently associated with the disease-specific survival of the pCCA patients [29]; however, there was a marginally significant association between tumor differentiation and the OS of pCCA patients in the primary cohort of the current study. Tumor differentiation was not included in our nomogram according to the stepwise multiple variants regression analyses. Whether tumor differentiation is independently associated with the prognosis of the pCCA patients needs to be elucidated with more investigations.
We acknowledge that there are several limitations for the current study. First, the sample size was relatively small in the internal and external cohorts due to the low incidence of pCCA. Second, the nomogram created here was applicable only to those patients who were eligible for resections. Whether the nomogram would be applicable to patients who were not eligible for curative intent surgery is not known. Third, although the concordance C-index for the nomogram is significantly higher than those for the AJCC TNM and the Mayo Clinic staging systems, the C-index value is still suboptimal (less than 0.70), which suggests that there are other prognostic factors that influence the OS of pCCA patients. More studies are warranted to discover factors that affect the OS for pCCA patients after surgery.
In conclusion, we have developed a reliable nomogram to predict the OS of pCCA patients who receive resections. Although the nomogram is superior to the current staging systems, more studies are required to determine if it is applicable to other groups of patients.
MATERIALS AND METHODS
Study design and patient recruitment
A retrospective study was performed for a cohort of pCCA patients who received curative intent surgery from 2000 to 2009 at the Eastern Hepatobiliary Surgery Hospital of the Second Military Medical University. Included were patients with non-metastatic pCCA, did not receive previous anticancer treatments, and had no history of other malignancies. Excluded were patients with intrahepatic or distal cholangiocarcinoma, tumors of uncertain origin or probable metastatic liver tumors, metastatic disease, a mixed type of primary liver cancer with a tumor thrombus perihilar to the bile duct, or non-resectable tumors (Bismuth type IV or Bismuth IIIa or IIIb with contralateral portal vein invasion). Also excluded were patients who died within one month after surgery, which may be caused by postoperative complications. 235 eligible patients were included in the primary training cohort study.
From January 2010 to December 2011, an internal independent validation cohort of 93 pCCA patients who received surgery with curative intent in the same hospital were prospectively recruited with same inclusion and exclusion criteria as the primary cohort.
From 2005 to 2011, 84 pCCA patients that received the curative intent surgery treatment in the First Affiliated Hospital of Sun Yat-Sen University were retrospectively recruited in the current study with the same inclusion and exclusion criteria as the primary training cohort. The last follow-up was performed in September 2015. These patients were recognized as the external validation cohort.
Each participant provided written consent, and the institutional review boards of the Second Military Medical University and the Ethnic Committee of the First Affiliated Hospital of Sun Yat-Sen University have approved the study.
Data collection
For each participant, baseline personal information was obtained from the admission records. The clinicopathologic characteristics were retrieved from the medical records and assessed by clinicians based on laboratory tests and image evaluations. The treatment methods and related outcomes were retrieved from medical records. The outcomes were followed from January 2001 to June 2014 at half-year intervals in the training cohort and internal cohort. The follow-up was performed from January 2008 to September 2015 with half-year intervals in the external validation cohort. Follow-up information, including metastasis, recurrence, or death, was collected by checking the medical records or by telephone calls.
Categorization of patients in different staging systems
For each patient, the disease stage was defined according to the criteria of the five staging systems (the seventh edition of the AJCC TNM classification 7th edition, Bismuth-Corlette, MSKCC, Gazzaniga, and Mayo Clinic) [6–9].
Statistical analyses
Overall survival (OS), defined as the time from the day of surgery to any cause of deaths, was considered as the primary outcome. Associations between the personal and clinical characteristics and the OS were evaluated with Kaplan-Meier plots and further assessed with log-rank tests. Multivariate analyses with the Cox proportional hazards model were performed to identify independent predictors of OS. In the primary cohort, the distribution of CA19-9 levels was categorized into three equal groups due to the upper limit of the test methods. For inclusion in the final model, effects of the continuous variant, age, was explored using restricted cubic splines, as a non-linear relationship was evident between age and the relative hazard risk.
Based on results of the multivariate analyses, the nomogram was created, and the final model was selected by the backward step-down method with the Akaike information criterion. The performance of the nomogram was evaluated with the Harrell concordance index (C-index) and internally validated with 1000 bootstrap samples and calibration plots [30]. To compare the prediction capacity of the staging system and the nomogram, we calculated the C-index value for each staging system and assessed the accuracy of the staging systems and the nomogram by time-dependent receiver operating characteristic (ROC) curves [31]. All statistical analyses were two-sided and conducted in with R software (www.r-project.org) and related packages. Statistical significance was defined as P < 0.05.
ACKNOWLEDGMENTS
This study was supported by grants from the Ministry of Science and Technology of China (2014AA020524), the National Nature Science Foundation (91529305, 81427805, 81302507, 31401611 and 81472280), the Instrument Developing Project of the Chinese Academy of Sciences, the Science and Technology Commission of Shanghai Municipality (14391901800, 14140902100, 13XD1400200 and 13140902902), and the Key Laboratory of Food Safety Research of INS, SIBS, CAS.
CONFLICTS OF INTEREST
The authors have declared no conflicts of interest.
Abbreviations
pCCA (perihilar cholangiocarcinoma), MSCKK (Memorial Sloan Kettering Cancer Center), AJCC (American Joint Committee on Cancer), ROC (receiver operating characteristic), C-inex (concordance index), DSS (disease-specific survival), ECOG (Eastern Cooperative Oncology Group), SD (Standard Deviation).
REFERENCES
1. Khan SA, Davidson BR, Goldin RD, Heaton N, Karani J, Pereira SP, Rosenberg WM, Tait P, Taylor-Robinson SD, Thillainayagam AV, Thomas HC, Wasan H and British Society of G. Guidelines for the diagnosis and treatment of cholangiocarcinoma: an update. Gut. 2012; 61:1657-1669.
2. Rizvi S and Gores GJ. Pathogenesis, diagnosis, and management of cholangiocarcinoma. Gastroenterology. 2013; 145:1215-1229.
3. Williams TM, Majithia L, Wang SJ and Thomas CR, Jr. Defining the role of adjuvant therapy: cholangiocarcinoma and gall bladder cancer. Semin Radiat Oncol. 2014; 24:94-104.
4. Ramirez-Merino N, Aix SP and Cortes-Funes H. Chemotherapy for cholangiocarcinoma: An update. World J Gastrointest Oncol. 2013; 5:171-176.
5. Grendar J, Grendarova P, Sinha R and Dixon E. Neoadjuvant therapy for downstaging of locally advanced hilar cholangiocarcinoma: a systematic review. HPB (Oxford). 2014; 16:297-303.
6. Deoliveira ML, Schulick RD, Nimura Y, Rosen C, Gores G, Neuhaus P and Clavien PA. New staging system and a registry for perihilar cholangiocarcinoma. Hepatology. 2011; 53:1363-1371.
7. Gazzaniga GM, Faggioni A and Filauro M. Surgical treatment of proximal bile duct tumors. Int Surg. 1985; 70:45-48.
8. Jarnagin WR, Fong Y, DeMatteo RP, Gonen M, Burke EC, Bodniewicz BJ, Youssef BM, Klimstra D and Blumgart LH. Staging, resectability, and outcome in 225 patients with hilar cholangiocarcinoma. Ann Surg. 2001; 234:507-517; discussion 517-509.
9. Chaiteerakij R, Harmsen WS, Marrero CR, Aboelsoud MM, Ndzengue A, Kaiya J, Therneau TM, Sanchez W, Gores GJ and Roberts LR. A new clinically based staging system for perihilar cholangiocarcinoma. Am J Gastroenterol. 2014; 109:1881-1890.
10. Xu L, Peng ZW, Chen MS, Shi M, Zhang YJ, Guo RP, Lin XJ and Lau WY. Prognostic nomogram for patients with unresectable hepatocellular carcinoma after transcatheter arterial chemoembolization. J Hepatol. 2015; 63:122-130.
11. Ferrone CR, Kattan MW, Tomlinson JS, Thayer SP, Brennan MF and Warshaw AL. Validation of a postresection pancreatic adenocarcinoma nomogram for disease-specific survival. Journal of clinical oncology. 2005; 23:7529-7535.
12. Wang Y, Li J, Xia Y, Gong R, Wang K, Yan Z, Wan X, Liu G, Wu D, Shi L, Lau W, Wu M and Shen F. Prognostic nomogram for intrahepatic cholangiocarcinoma after partial hepatectomy. Journal of clinical oncology. 2013; 31:1188-1195.
13. Ding G, Yang Y, Cao L, Chen W, Wu Z and Jiang G. A modified Jarnagin-Blumgart classification better predicts survival for resectable hilar cholangiocarcinoma. World journal of surgical oncology. 2015; 13:99.
14. Ebata T, Kosuge T, Hirano S, Unno M, Yamamoto M, Miyazaki M, Kokudo N, Miyagawa S, Takada T and Nagino M. Proposal to modify the International Union Against Cancer staging system for perihilar cholangiocarcinomas. Br J Surg. 2014; 101:79-88.
15. Zhou YC, Zhao HJ and Shen LZ. Preoperative serum CEA and CA19-9 in gastric cancer--a single tertiary hospital study of 1,075 cases. Asian Pac J Cancer Prev. 2015; 16:2685-2691.
16. Wang RF, Song BR, Peng JJ, Cai GX, Liu FQ, Wang MH, Cai SJ and Ye X. The Prognostic Value of Preoperative Serum CEA and CA19-9 Values in Stage I-III Colorectal Cancer. Hepatogastroenterology. 2014; 61:994-999.
17. O’Brien DP, Sandanayake NS, Jenkinson C, Gentry-Maharaj A, Apostolidou S, Fourkala EO, Camuzeaux S, Blyuss O, Gunu R, Dawnay A, Zaikin A, Smith RC, Jacobs IJ, Menon U, Costello E, Pereira SP, et al. Serum CA19-9 is significantly upregulated up to 2 years before diagnosis with pancreatic cancer: implications for early disease detection. Clin Cancer Res. 2015; 21:622-631.
18. Cai WK, Lin JJ, He GH, Wang H, Lu JH and Yang GS. Preoperative serum CA19-9 levels is an independent prognostic factor in patients with resected hilar cholangiocarcinoma. Int J Clin Exp Pathol. 2014; 7:7890-7898.
19. Heimbach JK, Gores GJ, Haddock MG, Alberts SR, Pedersen R, Kremers W, Nyberg SL, Ishitani MB and Rosen CB. Predictors of disease recurrence following neoadjuvant chemoradiotherapy and liver transplantation for unresectable perihilar cholangiocarcinoma. Transplantation. 2006; 82:1703-1707.
20. Guglielmi A, Ruzzenente A, Campagnaro T, Valdegamberi A, Bagante F, Bertuzzo F, Conci S and Iacono C. Patterns and prognostic significance of lymph node dissection for surgical treatment of perihilar and intrahepatic cholangiocarcinoma. J Gastrointest Surg. 2013; 17:1917-1928.
21. Yubin L, Chihua F, Zhixiang J, Jinrui O, Zixian L, Jianghua Z, Ye L, Haosheng J and Chaomin L. Surgical management and prognostic factors of hilar cholangiocarcinoma: experience with 115 cases in China. Annals of surgical oncology. 2008; 15:2113-2119.
22. Koerkamp BG, Wiggers JK, Allen PJ, Busch OR, D’Angelica MI, DeMatteo RP, Fong Y, Gonen M, Gouma DJ, Kingham TP, van Gulik TM and Jarnagin WR. American Joint Committee on Cancer staging for resected perihilar cholangiocarcinoma: a comparison of the 6th and 7th editions. HPB (Oxford). 2014; 16:1074-1082.
23. Murakami Y, Uemura K, Sudo T, Hashimoto Y, Kondo N, Nakagawa N, Muto T, Sasaki H, Urabe K and Sueda T. Perineural invasion in extrahepatic cholangiocarcinoma: prognostic impact and treatment strategies. J Gastrointest Surg. 2013; 17:1429-1439.
24. Neuhaus P, Jonas S, Bechstein WO, Lohmann R, Radke C, Kling N, Wex C, Lobeck H and Hintze R. Extended resections for hilar cholangiocarcinoma. Ann Surg. 1999; 230:808-818; discussion 819.
25. Hidalgo E, Asthana S, Nishio H, Wyatt J, Toogood GJ, Prasad KR and Lodge JP. Surgery for hilar cholangiocarcinoma: the Leeds experience. European journal of surgical oncology. 2008; 34:787-794.
26. Ito T, Ebata T, Yokoyama Y, Igami T, Sugawara G, Mizuno T, Shimoyama Y and Nagino M. The pathologic correlation between liver and portal vein invasion in perihilar cholangiocarcinoma: evaluating the oncologic rationale for the American Joint Committee on Cancer definitions of T2 and T3 tumors. World journal of surgery. 2014; 38:3215-3221.
27. Sagawa N, Kondo S, Morikawa T, Okushiba S and Katoh H. Effectiveness of radiation therapy after surgery for hilar cholangiocarcinoma. Surg Today. 2005; 35:548-552.
28. Gerhards MF, van Gulik TM, Gonzalez Gonzalez D, Rauws EA and Gouma DJ. Results of postoperative radiotherapy for resectable hilar cholangiocarcinoma. World journal of surgery. 2003; 27:173-179.
29. Groot Koerkamp B, Wiggers JK, Gonen M, Doussot A, Allen PJ, Besselink MG, Blumgart LH, Busch OR, D’Angelica MI, DeMatteo RP, Gouma DJ, Kingham TP, van Gulik TM and Jarnagin WR. Survival after resection of perihilar cholangiocarcinoma-development and external validation of a prognostic nomogram. Ann Oncol. 2016; 27:753.
30. Harrell FE, Jr., Lee KL and Mark DB. Multivariable prognostic models: issues in developing models, evaluating assumptions and adequacy, and measuring and reducing errors. Stat Med. 1996; 15:361-387.
31. Blanche P, Dartigues JF and Jacqmin-Gadda H. Estimating and comparing time-dependent areas under receiver operating characteristic curves for censored event times with competing risks. Stat Med. 2013; 32:5381-5397.