
INTRODUCTION
Metabolic reprogramming is an essential hallmark of cancer [1, 2]. Studies indicate that the oncogenes and tumor suppressor genes that initiate and maintain tumorigenesis also reprogram metabolism to cater to the biosynthetic demands associated with oncogenic transformation [3-6]. A common feature of many types of cancer cells is the phenomenon of aerobic glycolysis, also known as the Warburg effect [7, 8]. In the presence of oxygen, normal differentiated cells metabolize glucose to pyruvate through glycolysis followed by oxidation of pyruvate via the tricarboxylic acid (TCA) cycle. Cancer cells, on the other hand, metabolize glucose mostly to lactate, even under aerobic conditions [9]. At the molecular level, the Warburg effect is driven, amongst other factors, by overexpression of lactate dehydrogenase A (LDHA), the enzyme mediating the NADH-dependent reduction of pyruvate to lactate [7]. To avoid the associated reduction in intracellular pH and resultant cellular death, cancer cells also up-regulate expression of several transporters including the monocarboxylate transporters 1 and 4 (MCT1 and MCT4) [10-13].
The recent discovery that mutations in metabolic enzymes such as succinate dehydrogenase, fumarate hydratase and isocitrate dehydrogenase (IDH) can facilitate malignancy further emphasizes the connection between altered metabolism and cancer [4]. Most notably, the cytosolic isoform of IDH (IDH1), which is mutated in 70-90% of low-grade gliomas and secondary glioblastomas, is now understood to function as a “driver” of tumorigenesis [14-16]. The wild-type IDH1 enzyme converts isocitrate to α-ketoglutarate (α-KG). In contrast, mutations in the enzyme lead to its neomorphic ability to convert α-KG to 2-hydroxyglutarate (2-HG) [17, 18]. 2-HG is a competitive inhibitor of several α-KG-dependent dioxygenases including the TET family of DNA hydroxylases, the Jumonji C family of histone demethylases, and prolyl hydroxylases [19]. The resulting hypermethylator phenotype is thought to lead to a block in differentiation and the initiation of tumorigenesis in mutant IDH1 cells [19-21].
Several studies have demonstrated that mutant IDH1 cells also undergo extensive metabolic reprogramming that extends beyond 2-HG production. Reitman et al. were the first to perform a metabolomic analysis of wild-type and mutant IDH1 glioma cells. They showed that levels of several amino acids and TCA cycle intermediates were reduced in mutant IDH1 cells relative to wild-type [22] and similar results were obtained in a subsequent study of patient-derived mutant IDH1 tumor samples [23]. Reitman et al. also found reduced levels of phosphocholine (PC) and increased levels of glycerophosphocholine (GPC) in mutant IDH1 glioma cells relative to wild-type cells [22] and these results were in line with a subsequent study by Esmaeili et al. that showed increased GPC levels in mutant IDH1 gliomas relative to wild-type tumors [24]. These findings run counter to the increase in PC and drop in GPC typically observed in cancer [25] and suggest that mutant IDH1 cells reprogram their metabolism differently. Another indicator of unusual metabolic reprogramming in mutant IDH1 gliomas is their silencing of LDHA expression shown by Chesnelong et al. to occur via promoter hypermethylation in patient-derived mutant IDH1 glioma models and patient samples [26].
Magnetic resonance spectroscopy (MRS) is a translational method that can be used to monitor metabolism in cell extracts, live cells, tissue biopsies, animals and patients in vivo [27, 28]. Steady-state metabolite concentrations are primarily monitored using 1H and 31P MRS and metabolic fluxes can be assessed using 13C MRS to determine the fate of 13C-labeled metabolites. The recent development of dissolution dynamic nuclear polarization (DNP) for 13C-labeled metabolites enables a signal-to-noise ratio (SNR) enhancement on the order of 10,000-50,000 allowing rapid monitoring of metabolic fluxes using 13C MRS [29-31]. In particular, [1-13C]-pyruvate is readily hyperpolarized and has been widely used to probe the Warburg effect in cancer cells, animals, and recently in prostate cancer patients [31-33].
Our laboratory has used MRS to investigate the metabolic reprogramming of mutant IDH1 glioma cells. We carried out an unbiased 1H MRS-based metabolomic analysis of glioma cells genetically engineered to express either the wild-type or mutant IDH1 enzyme and found that steady-state levels of glutamate, lactate and PC were reduced in mutant IDH1 cells [34]. In a separate study, we linked the reduction in glutamate levels to down-regulation of pyruvate dehydrogenase (PDH) activity in mutant IDH1 cells [35]. As mentioned above, cancer cells often up-regulate pyruvate flux towards lactate while reducing pyruvate oxidation via PDH, resulting in an inverse link between PDH activity and aerobic glycolysis [36-42]. The down-regulation of PDH activity in mutant IDH1 cells might, therefore, be expected to result in increased lactate production from pyruvate in these cells. However, LDHA expression is typically silenced in mutant IDH1 gliomas [26], suggesting that pyruvate conversion to lactate could be reduced. The goal of this study was therefore to investigate the flux of pyruvate to lactate in mutant IDH1 glioma cells using hyperpolarized 13C MRS.
We performed our studies on an immortalized normal human astrocyte (NHA) cell line genetically engineered to express either wild-type or mutant IDH1 [34]. Our results indicate that the flux of hyperpolarized [1-13C]-pyruvate to hyperpolarized [1-13C]-lactate is significantly reduced in mutant IDH1 cells compared to wild-type and this could be linked, at least in part, to reduced MCT1 and MCT4 expression in our mutant IDH1 cells. Importantly, the drop in MCT expression was confirmed in patient data from The Cancer Genome Atlas (TCGA) database. Our findings contribute to the understanding of mutant IDH1 cell metabolism and have important implications for the treatment and imaging of mutant IDH1 gliomas.
RESULTS
Pyruvate to lactate flux is significantly reduced in mutant IDH1 cells
To compare pyruvate to lactate flux between NHAIDHwt and NHAIDHmut cells, we used hyperpolarized 13C MRS and dynamically probed the metabolism of hyperpolarized [1-13C]-pyruvate in live cells in a bioreactor. Following injection of hyperpolarized [1-13C]-pyruvate (δ=171.1 ppm) into the medium of perfused cells, production of hyperpolarized [1-13C]-lactate (δ=183.2 ppm) could be observed (Figure 1A). Comparison of the build-up of hyperpolarized lactate over time showed a clear reduction in hyperpolarized lactate production in NHAIDHmut cells relative to NHAIDHwt (Figure 1B). Quantification of Lacmax/Pyrmax revealed that hyperpolarized [1-13C]-lactate production was significantly reduced by 48.6±10.5% (p<0.0005) (Figure 1B). Similarly, quantification of Lacauc/Pyrauc showed a drop of 56.9±7.3% (p<0.005) in NHAIDHmut cells relative to NHAIDHwt cells (Figure 1C).
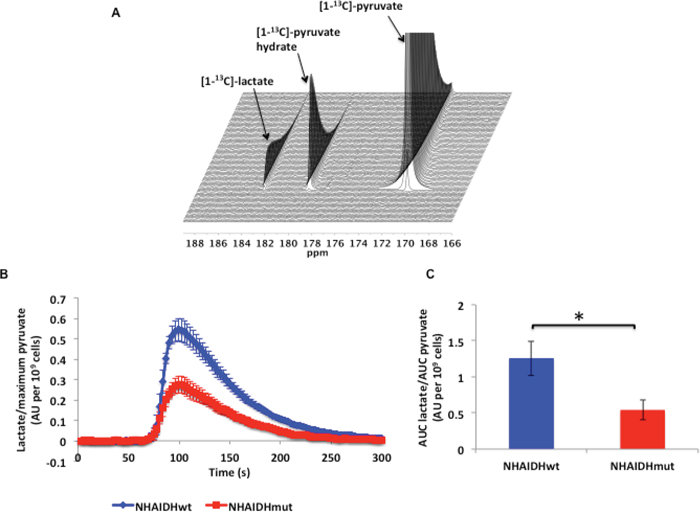
Figure 1: A. 13C MR spectral array showing hyperpolarized [1-13C]-lactate production from hyperpolarized [1-13C]-pyruvate in live NHAIDHwt cells. B. Build-up of hyperpolarized [1-13C]-lactate following injection of hyperpolarized [1-13C]-pyruvate in live NHAIDHwt and NHAIDHmut cells. C. Ratio of the AUC of hyperpolarized lactate to the AUC of hyperpolarized pyruvate normalized to cell number for live NHAIDHwt and NHAIDHmut cells. * represents statistically significant difference (p<0.05).
LDH expression and activity, intracellular NADH concentration and NAD+/NADH ratio are unaltered in mutant IDH1 cells
Previous studies have demonstrated that several factors can influence the production of hyperpolarized [1-13C]-lactate. One factor is the expression and activity of the two LDH isoforms, LDHA and LDHB. LDHA is efficient at the NADH-dependent reduction of pyruvate to lactate while LDHB catalyzes the NAD+-dependent conversion of lactate to pyruvate [56]. In addition, the intracellular NADH concentration [57, 58] and the size of the intracellular lactate pool [57, 59] can modulate hyperpolarized lactate production. Finally, MCT1, which has a high affinity for the transport of pyruvate into the cell (Km 0.7-3 mM) and a somewhat lower affinity for the transport of lactate (Km ~3-6 mM), and MCT4, which has a low affinity for pyruvate (Km ~153 mM) and a higher affinity for lactate (Km ~25-30 mM), both affect hyperpolarized lactate production by controlling the delivery of pyruvate as well as the intracellular lactate pool [57, 60-63].
First, we looked at LDHA expression and activity. As mentioned earlier, LDHA expression is silenced by hypermethylation in patient-derived mutant IDH1 glioma models [26]. However, in our genetically engineered NHA model, it has been shown that the difference in LDHA expression between NHAIDHwt and NHAIDHmut cells is not statistically significant, in spite of a significant increase in promoter methylation [26]. Here we confirmed these earlier findings. We found that the LDHA gene was significantly hypermethylated in NHAIDHmut relative to NHAIDHwt (Δβ = 0.35, p<0.0001, probe cg02232751), but no significant difference in LDHA expression between NHAIDHwt and NHAIDHmut cells was observed (Supplementary Figure 1). To further confirm our results, we also measured LDHA activity and found no difference in the Km (Figure 2A) and Vmax (Figure 2B) of LDHA between NHAIDHwt and NHAIDHmut cells.
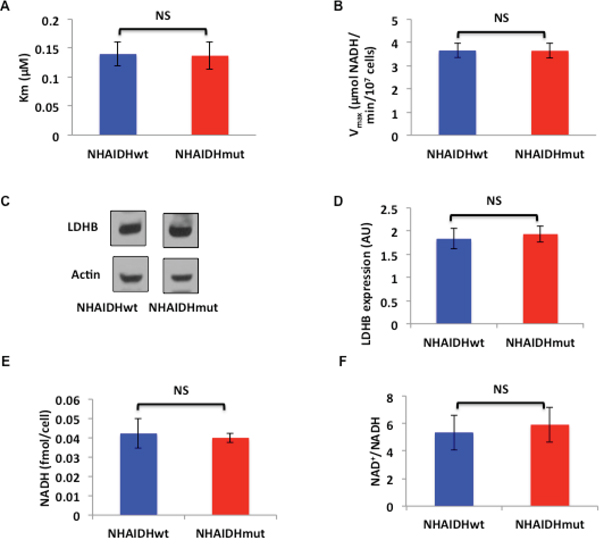
Figure 2: A. Km for pyruvate of LDHA from NHAIDHwt and NHAIDHmut cells. B. Vmax of LDHA from NHAIDHwt and NHAIDHmut cells. C. Western blots for LDHB in NHAIDHwt and NHAIDHmut cells. D. Quantification of LDHB expression in NHAIDHwt and NHAIDHmut cells. E. NADH concentration in NHAIDHwt and NHAIDHmut cells. F. NAD+/NADH ratio in NHAIDHwt and NHAIDHmut cells. NS indicates no statistically significant difference.
Next, we examined LDHB expression and found no significant difference between NHAIDHwt and NHAIDHmut cells (Figure 2C and 2D). Measurement of intracellular NADH concentration (Figure 2E) and the NAD+/NADH ratio (Figure 2F) also revealed no differences between NHAIDHwt and NHAIDHmut cells.
Reduced glucose uptake leads to a drop in intracellular lactate production in NHAIDHmut cells and could contribute to reduced hyperpolarized [1-13C]-lactate production
Reduced intracellular lactate has been shown to lead to a drop in hyperpolarized [1-13C]-lactate production [57]. We previously reported that the intracellular lactate pool is lower in NHAIDHmut cells compared to NHAIDHwt (28±14.8%, p<0.05) [34]. To further examine the reasons for reduced lactate production, we metabolically labeled cells with [1-13C]-glucose and monitored [1-13C]-glucose uptake and [3-13C]-lactate production in NHAIDHwt and NHAIDHmut cells assembled into a bioreactor (Figure 3A). Quantification of the rate of [1-13C]-glucose consumption indicated that it was reduced significantly by 62.5±16.3% (p<0.05) in NHAIDHmut cells compared to NHAIDHwt cells from 90.2±17.1 fmol/cell.h to 34.9±18.5 fmol/cell.h (Figure 3B). Concomitantly, [3-13C]-lactate production was reduced by 45.6±13.5% (p<0.05) from 90.5±18.2 fmol/cell.h to 49±16.1 fmol/cell.h in NHAIDHmut cells relative to NHAIDHwt (Figure 3C). These results suggest that reduced lactate production from glucose is likely responsible for the lower intracellular lactate in NHAIDHmut cells. This could explain, at least in part, the observed drop in hyperpolarized [1-13C]-lactate production in NHAIDHmut cells.
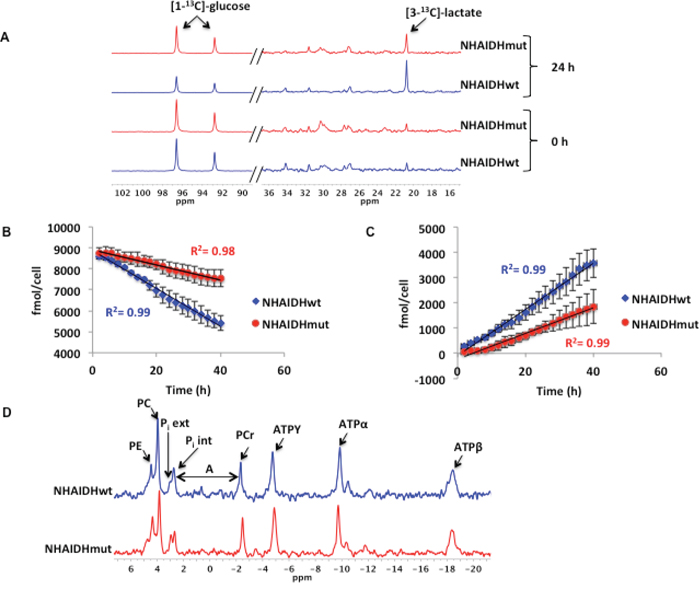
Figure 3: A. Representative spectra showing a comparison of [1-13C]-glucose consumption and [3-13C]-lactate production at 0 and 24 h in NHAIDHwt and NHAIDHmut cells (the portion of the spectrum containing [1-13C]-glucose (90-102 ppm) is scaled differently than that containing [3-13C]-lactate (16-36 ppm) in order to illustrate the difference in glucose uptake between NHAIDHwt and NHAIDHmut cells). B. Quantification of [1-13C]-glucose uptake over the course of 40 h in NHAIDHwt and NHAIDHmut cells. C. Quantification of [3-13C]-lactate production over the course of 40 h in NHAIDHwt and NHAIDHmut cells. D. Representative 31P MR spectra for NHAIDHwt and NHAIDHmut cells. The chemical shift difference (A) between the Pi int and PCr peaks was used to calculate the intracellular pH in NHAIDHwt and NHAIDHmut cells. PE=phosphoethanolamine, PC=phosphocholine, Pi ext=extracellular inorganic phosphate, Pi int= intracellular inorganic phosphate, PCr=phosphocreatine, ATPY=Y phosphate of ATP, ATPα= α phosphate of ATP and ATPβ= β phosphate of ATP.
Interestingly however, the drop in intracellular lactate levels was not associated with a detectable change in intracellular pH as assessed using 31P MRS (Figure 3D). The intracellular pH of NHAIDHwt cells was 7.16±0.08 and the pH of NHAIDHmut was 7.19±0.12 (p=0.8).
Expression of MCT1 and MCT4 is down-regulated in NHAIDHmut cells
As mentioned earlier, MCT expression has been shown to influence hyperpolarized lactate production from pyruvate [44, 57, 63]. Therefore, we examined MCT1 and MCT4 expression in the NHA model using western blotting. Our results indicated that MCT1 expression was reduced by 33.3±6.4% (p<0.05) (Figure 4A & 4B) and MCT4 expression was reduced by 30.4±2% (p<0.005) (Figure 4C & 4D) in NHAIDHmut cells relative to NHAIDHwt.
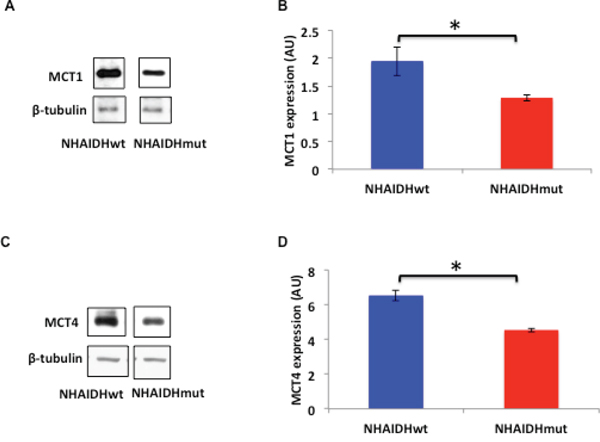
Figure 4: A. MCT1 expression in NHAIDHwt and NHAIDHmut cells determined by western blotting. B. Quantification of MCT1 expression in NHAIDHwt and NHAIDHmut cells. C. MCT4 expression in NHAIDHwt and NHAIDHmut cells determined by western blotting. D. Quantification of MCT4 expression in NHAIDHwt and NHAIDHmut cells. * represents statistically significant difference (p<0.05).
2-HG produced by the IDH1 mutation is known to induce DNA hypermethylation resulting in reduced expression of several genes [20, 21, 26]. Examination of the methylome of NHAIDHwt and NHAIDHmut cells indicated that the SLC16A3 gene coding for MCT4 was hypermethylated in NHAIDHmut cells relative to NHAIDHwt (Δβ = 0.39, p<0.0001, probe cg09147131). However, methylation of the SLC16A1 gene coding for MCT1 was not significantly different between NHAIDHwt and NHAIDHmut cells (Δβ=0.02, p=0.1, probe cg20614262).
Reduced MCT expression is a major factor leading to reduced hyperpolarized [1-13C]-lactate production in mutant IDH1 NHAs
The rate of pyruvate transport across the cell membrane, mediated by the MCTs and in particular by MCT1, affects the hyperpolarized pyruvate to lactate flux in live cells as previously shown in several studies [44, 57, 63]. To confirm the role of MCTs in explaining the reduction in hyperpolarized lactate production in our intact NHAIDHmut cells, we therefore measured hyperpolarized lactate production in cell lysates, wherein the role of the MCTs is excluded. Quantification of both Lacmax/Pyrmax (2.5±0.5 in NHAIDHwt and 2.2±0.2 in NHAIDHmut, p=0.56) and Lacauc/Pyrauc (1.7±0.5 in NHAIDHwt and 1.8±0.2 in NHAIDHmut, p=0.54) revealed that hyperpolarized [1-13C]-lactate production was comparable in NHAIDHwt lysate relative to NHAIDHmut lysate (Figure 5A and 5B). In contrast to live cells, [3-13C]-alanine (δ=176.2 ppm) production could be detected in lysates but showed no difference between NHAIDHwt and NHAIDHmut lysates (data not shown). These results confirmed that the reduction in hyperpolarized pyruvate to lactate flux in intact NHAIDHmut cells resulted primarily from reduced expression of the MCTs.
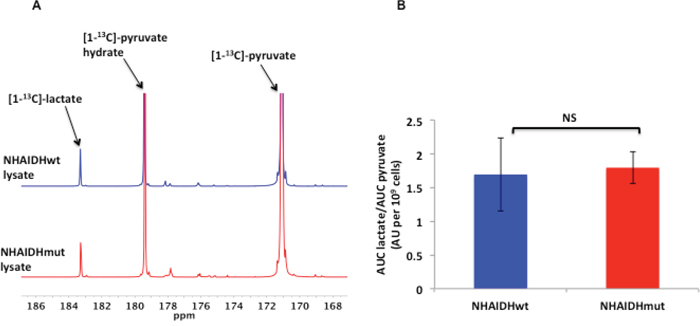
Figure 5: A. Representative 13C MR spectra comparing maximum hyperpolarized [1-13C]-lactate produced from hyperpolarized [1-13C]-pyruvate in NHAIDHwt and NHAIDHmut lysates. B. Ratio of the AUC of hyperpolarized lactate to the AUC of hyperpolarized pyruvate normalized to cell number for NHAIDHwt and NHAIDHmut lysates. NS indicates no significant difference.
MCT1 and MCT4 expression is reduced in mutant IDH1 low-grade glioma patient tumors relative to wild-type IDH1 tumors
In order to assess whether our findings are clinically relevant, we analyzed expression data from low-grade (grade II and III) glioma biopsy samples available in the TCGA database. We found that the mean normalized z-scores of mRNA expression were significantly reduced for both MCT1 (Figure 6A, 0.22 vs. -0.21, p<0.05) and MCT4 (Figure 6B, 0.25 vs. -0.15, p<0.005) in mutant IDH1 glioma samples (n=218) compared to wild-type IDH1 low-grade glioma (n=68). This confirmed that our findings in the NHA model reflected the behavior of mutant IDH1 tumors in patients.
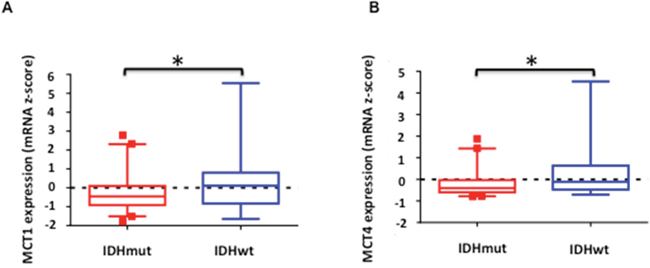
Figure 6: Comparison of normalized expression z-scores for MCT1 A. and MCT4 B. mRNA in low-grade glioma patient samples. Boxes denote the mean z-score and whiskers denote 1-99 percentile for tumors within the group (n=68 for IDH1 wild-type and n=218 for IDH1 mutant). A negative z-score represents expression value below the population mean. * indicates statistically significant effect (p<0.05).
DISCUSSION
Using a combination of MRS, cell and molecular biological assays, our study found that the expression of the monocarboxylate transporters MCT1 and MCT4 was reduced in our genetically engineered mutant IDH1 cells when compared to their wild-type IDH1 counterparts.
Whereas recently isolated patient-derived mutant IDH1 models [26] are clinically more relevant, they do not provide a matched comparison between IDH1 wild-type and mutant cells. In the current study we therefore used immortalized NHAs genetically engineered to express either the wild-type or mutant IDH1 enzyme in order to obtain a paired comparison of the effect of the IDH1 mutation on MCT expression. A limitation of our model is that the NHAIDHwt cells are not tumorigenic and therefore an in vivo comparison is not possible. Furthermore, the NHAIDHmut cells have not silenced LDHA [26] and therefore do not fully reproduce the findings from patient tumors. This could be due to their relatively low passage number (~P20) following mutant IDH1 transfection, considering that remodeling of the methylome has been shown to occur progressively [20]. Importantly, however, our observation that the expression of MCT1 and MCT4 is reduced in NHAIDHmut cells was validated in patient samples submitted to the TCGA. This confirms the clinical significance of our findings with regard to the MCTs.
By comparing hyperpolarized pyruvate to lactate conversion in lysates and in intact cells, we have identified the role of down-regulated MCT1 and MCT4 expression in reducing hyperpolarized lactate production in mutant IDH1 cells. However, it should be noted that lysing cells not only removes the cell membrane (and therefore the MCTs), but also dilutes the intracellular lactate. We have previously shown that intracellular lactate levels are lower by 28±14.8% (p<0.05) in mutant IDH1 cells [34] and others have demonstrated that a reduction in intracellular lactate levels can reduce hyperpolarized lactate production [57]. We therefore cannot rule out that lower intracellular lactate levels in mutant IDH1 cells also play a role in reduced hyperpolarized lactate production.
With regard to the relative contribution of MCT1 and MCT4 towards hyperpolarized pyruvate transport, based on the substrate affinities mentioned above, MCT1 is generally thought to mediate pyruvate uptake into the cells and MCT1 and MCT4 to mediate lactate efflux. However, transport also depends on the concentration gradients of monocarboxylate and H+ [62, 64]. Thus, MCT1 and MCT4 could both serve to import as well as export pyruvate into and out of the cell, albeit with differing affinities. Further functional studies with MCT1/4 inhibitors and genetic knockdowns are needed to unravel the relative contributions of MCT1 and MCT4 towards hyperpolarized pyruvate transport in mutant IDH1 gliomas.
Interestingly, our data indicates that the mechanisms through which MCT1 and MCT4 are silenced could be different. Reduced MCT4 expression in NHAIDHmut cells was associated with increased promoter methylation of the SLC16A3 (MCT4) gene, which can explain the drop in MCT4 expression [65]. Although our results were based on two replicates for each cell line, they are in agreement with those of Turcan et al. who, using NHAs of similar origin as our study, found that the SLC16A3 (MCT4) gene was hypermethylated in mutant IDH1 cells (22.9 fold, p<0.05) relative to wild-type cells [20]. Our findings are also in agreement with a previous study showing that SLC16A3 (MCT4) mRNA levels were lower in patient-derived mutant IDH1 models compared to wild-type IDH1 glioblastoma models [26]. Most importantly, our results are in line with the TCGA data wherein a reduction in SLC16A3 (MCT4) mRNA levels was observed in mutant IDH1 patient biopsy samples relative to wild-type. Taken together, these findings suggest that MCT4 expression is likely down-regulated in mutant IDH1 cells via promoter hypermethylation. In contrast, SLC16A1 (MCT1) methylation was comparable in our NHAIDHwt and NHAIDHmut cells pointing to a possible alternate mechanism for reduced expression of this gene. In this case, our findings differ from those of Turcan et al. who found that the SLC16A1 (MCT1) gene is significantly methylated (1.7 fold, p<0.05) in mutant IDH1 cells compared to wild-type [20]. However, it should be noted that the cells used in that study were at a higher passage number (P40), possibly indicating that, ultimately, mutant IDH1 cells reduce MCT1 expression via more than one mechanism. Indeed, a recent paper identified methylation-independent modulation of gene expression via insulator function modification in mutant IDH1 cells [66]. Further studies are needed to fully understand the mechanisms by which MCT1 and MCT4 expression and function are modulated in mutant IDH1 cells.
Independent of mechanism, our findings highlight another aspect of the unusual metabolic reprogramming of mutant IDH1 cancer cells. Previous studies have shown, for example, that abnormal choline metabolism with increased PC synthesis is a hallmark of many types of cancer cells [25]. Mutant IDH1 glioma cells, however, display reduced PC levels indicating that they reprogram choline metabolism differently [34]. Likewise, most types of cancer cells display the Warburg effect with elevated glucose uptake and conversation to lactate mediated, amongst other factors, by overexpression of LDHA [7, 8]. Our results indicate that mutant IDH1 cells, on the other hand, reduce glucose uptake and concomitant lactate production, in addition to silencing LDHA expression [26], making their metabolic phenotype different from non-IDH mutated cancer cells. With regard to MCT1 and MCT4, previous studies have shown that cancer cells up-regulate these transporters in order to facilitate lactate export and avoid intracellular acidosis [7, 10-13]. Our finding that expression of MCTs is reduced in mutant IDH1 gliomas is therefore also unusual. However, it is in line with a study showing that NHE-1, another transporter involved in maintenance of intracellular pH and cell survival in glycolytic tumors, is silenced in 1p/19q co-deleted mutant IDH1 gliomas [67, 68]. Silencing of NHE-1 and reduced MCT expression are consistent with reduced glycolytic production of lactate as well as silencing of LDHA expression [26]; cells that produce less lactate do not require an increase in its export and are, therefore, less dependent on MCT and NHE-1 expression.
Reduced MCT1 and MCT4 expression in mutant IDH1 gliomas could also have important implications for chemotherapy. Elevated expression of the MCTs has been observed in highly glycolytic tumors and has been associated with poor outcome [11, 69, 70]. Additionally, the MCTs have been shown to impact the effects of chemotherapeutic agents such as 3-bromopyruvate and dichloroacetate by modulating their delivery to the cell [71-73]. The MCTs can also sensitize cells to radiation therapy [74, 75]. As a result, MCTs have been considered a therapeutic target, either alone or in combination with other therapies [61, 69, 70, 74, 76-79]. However, in the current study, we show that expression of MCT1 and MCT4 is significantly reduced in mutant IDH1 gliomas. Further studies are needed to assess the utility of MCT inhibition as a treatment strategy for mutant IDH1 gliomas, but considering that the effectiveness of MCT inhibitors has been linked to MCT expression [78], inhibition of MCT expression and/or function likely would not provide a therapeutic opportunity for mutant IDH1 gliomas and this point should be considered in the planning of treatment for mutant IDH1 glioma patients. Nonetheless other metabolic targets such as mutant IDH and PDH may provide potential therapeutic opportunities [35, 80].
Hyperpolarized 13C MR imaging is rapidly emerging as a novel imaging modality in oncology, and its safety and utility in prostate cancer patients has been demonstrated [31-33]. Positron emission tomography imaging using 18F-fluorodeoxyglucose is of limited utility in brain tumors due to the high background glucose consumption in normal brain, which limits sensitivity and specificity [81]. Hyperpolarized [1-13C]-pyruvate has been shown to cross the blood-brain barrier in non-human primates [82] and initial clinical studies also confirm that this is the case in patients. Furthermore, detection of increased hyperpolarized [1-13C]-lactate production from hyperpolarized [1-13C]-pyruvate as a result of up-regulation of aerobic glycolysis in high-grade glioblastomas and a drop in hyperpolarized [1-13C]-lactate in response to treatment have been reported in animal models [33, 49, 83, 84]. Hyperpolarized 13C MRS of pyruvate therefore has clear potential as an imaging method for brain tumors. However, as mentioned earlier, production of hyperpolarized lactate depends on pyruvate transport into the cell via the MCTs, LDHA expression, intracellular lactate levels and NADH. Our finding regarding reduced expression of the MCTs, taken together with reduced intracellular lactate levels and the silencing of LDHA expression [26], indicate that in mutant IDH1 gliomas in vivo the production of hyperpolarized lactate is likely to be very limited. While a head-to-head comparison of NHAIDHwt and NHAIDHmut tumors is not possible in vivo due to the lack of tumorigenicity of the NHAIDHwt cells, a comparison of patient-derived mutant IDH1 models, such as BT142, with wild-type IDH1 glioblastoma models, such as the U87 model, is feasible and provides a clinically relevant comparison. Such a preliminary study from our lab indicated that hyperpolarized pyruvate to lactate conversion was very significantly reduced in the BT142 model compared to the U87 model [85]. While this could preclude the use of hyperpolarized lactate production as an indicator of response to therapy it could provide a method of confirming mutant IDH1 status [84].
In summary, our finding that the expression of MCT1 and MCT4 is reduced in mutant IDH1 gliomas highlights the unusual metabolic reprogramming that occurs in mutant IDH1 tumors and has important implications for our understanding of these tumors and their treatment. Furthermore, and importantly, our findings in preclinical models point to what is likely an unusual fate for hyperpolarized pyruvate and an unexpected metabolic imaging signature for these tumors in the clinic.
MATERIALS AND METHODS
Cell culture
Normal human astrocytes (Clonetics) were immortalized as described previously [43] and transfected with lentiviral vectors expressing the wild-type IDH1 gene (NHAIDHwt) or mutant IDH1 R132H gene (NHAIDHmut) [34]. There was no significant difference in doubling time between NHAIDHwt and NHAIDHmut cells [34]. Cell lines were last authenticated by single nucleotide polymorphism fingerprinting (Cell Line Genetics) on 10/28/2015. Cells were routinely cultured in Dulbecco’s Modified Eagles’ Medium (UCSF Cell Culture Facility, UCSF) supplemented with 10% fetal bovine serum (Corning), 2 mM L-glutamine (UCSF Cell Culture Facility, UCSF) and 100 U/ml each of penicillin and streptomycin (UCSF Cell Culture Facility, UCSF).
MRS studies
MRS studies were performed on live cells immobilized on Biosilon polystyrene beads (Nunc) using an MR-compatible cell perfusion (bioreactor) system as described previously [44]. All MRS studies were performed on a 500 MHz INOVA spectrometer (Agilent) equipped with a 10 mm broadband probe. First, to confirm cell viability, proton-decoupled 31P spectra were acquired using a 30° pulse, 3 s relaxation delay and 1024 scans. For thermally polarized 13C MRS studies, glucose in the medium was replaced with 5 mM [1-13C]-glucose (Sigma-Aldrich). Proton-decoupled 13C spectra were then acquired in 2 h blocks using a 60° pulse, 6 s relaxation delay and 2400 scans over the course of 40 h. Peak integrals were quantified using Mnova (Mestrelab Research), corrected for saturation and NOE and normalized to cell number and to the known concentration of [1-13C]-glucose at the start of the experiment. The rates of [1-13C]-glucose uptake and [3-13C]-lactate production were then detemined using linear regression analysis. For hyperpolarized 13C MRS, [1-13C]-pyruvic acid (Sigma Aldrich) containing 15 mM of the OX063 trityl radical (Oxford Instruments) was hyperpolarized using the Hypersense DNP polarizer (Oxford Instruments) as described previously [44]. After ~1 h, hyperpolarized pyruvic acid was rapidly dissolved in 6 mL isotonic buffer (40 mM Tris HCl, 3 μM ethylenediaminetetraacetic acid (EDTA), pH 7.8) and injected into the perfusion system within 15 s at approximately 37°C and to a final concentration of 5 mM. For studies of cell lysates, cells (~108) were lysed by sonication in 80 mM Tris HCl, 200 mM NaCl, 2 mM NADH, pH 8, centrifuged at 14000 rpm for 10 minutes to remove precipitated membranes and the supernatant placed in a 10 mM NMR tube. Hyperpolarized pyruvate was then injected to a final concentration of 5 mM. Single transient 13C spectra were acquired every 3 s over a period of 300 s using 5° pulses, 40 k data points and a spectral width of 20 kHz. Data analysis was performed using Mnova. Several approaches have been described to analyze hyperpolarized pyruvate metabolism and results are essentially comparable [45-49]. Here, the data was assessed using two model-free approaches. Either the integral of lactate was normalized to the maximum pyruvate integral and to cell number, and the values of normalized maximum lactate (Lacmax/Pyrmax) compared. Alternatively the area under the curve (AUC) for hyperpolarized lactate was normalized to the AUC for hyperpolarized pyruvate and to cell number (Lacauc/Pyrauc) and values compared.
Intracellular pH determination
Intracellular pH was determined using the chemical shift difference (A) between the intracellular inorganic phosphate (Pi int) and phosphocreatine (PCr) peaks in the 31P MR spectrum obtained at the start of the study (see above) and using the Henderson-Hasselbalch equation (pH= 6.77 + log [(A-3.29)/(5.68-A)] to calculate the pH as described previously [50].
LDH activity assay
LDH activity was monitored using a spectrophotometric assay designed to monitor the rate of NADH consumption at 340 nm during LDH-catalyzed conversion of pyruvate to lactate in cell lysates as described previously [49, 51]. The Km and Vmax values were calculated by fitting the initial rate of NADH consumption to a Lineweaver–Burke plot.
Western blotting
Cells (~107) were lysed by sonication in cell lysis buffer (Cell signaling). Total cellular protein (~20 μg) was separated by sodium dodecyl sulphate polyacrylamide gel electrophoresis and transferred onto Immobilon-FL PVDF membrane (Millipore). Immunoblotting was performed using primary antibodies against MCT1 and MCT4 (Santa Cruz Biotechnology), LDHA and LDHB (Abcam), β-tubulin and Actin (Cell Signaling) followed by horseradish peroxidase-conjugated secondary antibodies (Cell Signaling). Images were developed onto autoradiographic film using an enhanced chemiluminescence substrate kit (Thermo Scientific) and quantified using ImageJ software (NIH).
NAD+/NADH assay
Total cellular NADH concentration and the NAD+/NADH ratio were determined spectrophotometrically using a commercially available kit (Biovision) according to the manufacturer’s instructions.
DNA methylation analysis
Genomic DNA was isolated from the NHA parental line [43], NHAIDHwt or NHAIDHmut cells (n=2 each) and digested with 1 mg/ml proteinase K in lysis buffer (50 mM Tris-HCl, 1 mM EDTA, 0.5% SDS, pH 8) overnight at 55°C. After RNase treatment, DNA was phenol/chloroform extracted, precipitated with ethanol and resuspended in buffer containing 10 mM Tris-HCl, 1 mM EDTA, pH 8. DNA was bisulfite converted using the EZ DNA Methylation Kit (Zymo Research) and processed on Infinium HumanMethylation450 bead arrays (Illumina) according to the manufacturer’s protocol. Probe-level signals for individual CpG sites were subject to both background and global dye-bias correction [52]. Probes that map to regions with known germline polymorphisms, to multiple genomic loci, or to either sex chromosome were filtered out [53]. The Limma (moderated t-test) approach was used to identify probes that were significantly different between NHAIDHwt and NHAIDHmut cells. Beta (β) values (the ratio between methylated probe intensity and total probe intensities, which can be interpreted as the percentage of methylation) were then calculated. To match the assumption of normality, the β values for NHAIDHwt and NHAIDHmut samples were transformed by the logit function and rescaled to the parental cell line scale. Each value was represented in terms of parental standard deviations (using Limma’s inflated variance estimates) away from the parental mean. Finally, Δβ values (difference in β value between NHAIDHwt and NHAIDHmut cells) and p-values were assigned to the most significant probe difference within a gene.
TCGA analysis
Patient biopsy data for diffuse low-grade gliomas (grade II and III) deposited in the TCGA database (http://cancergenome.nih.gov) was downloaded through the CBio Portal (http://www.cbioportal.org) [54, 55]. Mean normalized z-scores for mRNA levels were determined for mutant and wild-type IDH1 glioma datasets. Statistical significance of differences was assessed using a two-tailed Mann-Whitney test with p<0.05 considered significant.
Statistical analysis
Unless otherwise stated, results are expressed as mean ± standard deviation (n≥3 unless otherwise specified) and statistical significance evaluated using a two-tailed Student’s t-test assuming unequal variance with p<0.05 considered significant.
CONFLICTS OF INTEREST
The authors declare no conflicts of interest.
FINANCIAL SUPPORT
This work was supported by NIH R01CA172845 (SMR), NIH R01CA154915 (SMR), NIH R21CA201453 (SMR), the UCSF Brain Tumor Center Loglio Collective and P41EB013598 (Hyperpolarized MRI Technology Resource Center, UCSF).
REFERENCES
1. Hanahan D, Weinberg RA. Hallmarks of cancer: the next generation. Cell. 2011; 144:646-674.
2. Pavlova NN, Thompson CB. The Emerging Hallmarks of Cancer Metabolism. Cell metabolism. 2016; 23:27-47.
3. Boroughs LK, DeBerardinis RJ. Metabolic pathways promoting cancer cell survival and growth. Nature cell biology. 2015; 17:351-359.
4. Mullen AR, DeBerardinis RJ. Genetically-defined metabolic reprogramming in cancer. Trends in endocrinology and metabolism: TEM. 2012; 23:552-559.
5. DeBerardinis RJ, Lum JJ, Hatzivassiliou G, Thompson CB. The biology of cancer: metabolic reprogramming fuels cell growth and proliferation. Cell metabolism. 2008; 7:11-20.
6. Hirschey MD, DeBerardinis RJ, Diehl AM, Drew JE, Frezza C, Green MF, Jones LW, Ko YH, Le A, Lea MA, Locasale JW, Longo VD, Lyssiotis CA, McDonnell E, Mehrmohamadi M, Michelotti G, et al. Dysregulated metabolism contributes to oncogenesis. Seminars in cancer biology. 2015; 35:S129-150.
7. Gatenby RA, Gillies RJ. Why do cancers have high aerobic glycolysis? Nature reviews Cancer. 2004; 4:891-899.
8. Vander Heiden MG, Cantley LC, Thompson CB. Understanding the Warburg effect: the metabolic requirements of cell proliferation. Science (New York, NY). 2009; 324:1029-1033.
9. Lunt SY, Vander Heiden MG. Aerobic glycolysis: meeting the metabolic requirements of cell proliferation. Annual review of cell and developmental biology. 2011; 27:441-464.
10. Izumi H, Torigoe T, Ishiguchi H, Uramoto H, Yoshida Y, Tanabe M, Ise T, Murakami T, Yoshida T, Nomoto M, Kohno K. Cellular pH regulators: potentially promising molecular targets for cancer chemotherapy. Cancer treatment reviews. 2003; 29:541-549.
11. Pinheiro C, Longatto-Filho A, Azevedo-Silva J, Casal M, Schmitt FC, Baltazar F. Role of monocarboxylate transporters in human cancers: state of the art. Journal of bioenergetics and biomembranes. 2012; 44:127-139.
12. Parks SK, Chiche J, Pouyssegur J. Disrupting proton dynamics and energy metabolism for cancer therapy. Nature reviews Cancer. 2013; 13:611-623.
13. Enerson BE, Drewes LR. Molecular features, regulation, and function of monocarboxylate transporters: implications for drug delivery. Journal of pharmaceutical sciences. 2003; 92:1531-1544.
14. Suzuki H, Aoki K, Chiba K, Sato Y, Shiozawa Y, Shiraishi Y, Shimamura T, Niida A, Motomura K, Ohka F, Yamamoto T, Tanahashi K, Ranjit M, Wakabayashi T, Yoshizato T, Kataoka K, et al. Mutational landscape and clonal architecture in grade II and III gliomas. Nature genetics. 2015; 47:458-468.
15. Eckel-Passow JE, Lachance DH, Molinaro AM, Walsh KM, Decker PA, Sicotte H, Pekmezci M, Rice T, Kosel ML, Smirnov IV, Sarkar G, Caron AA, Kollmeyer TM, Praska CE, Chada AR, Halder C, et al. Glioma Groups Based on 1p/19q, IDH, and TERT Promoter Mutations in Tumors. New England Journal of Medicine. 2015; 372:2499-2508.
16. Brat DJ, Verhaak RG, Aldape KD, Yung WK, Salama SR, Cooper LA, Rheinbay E, Miller CR, Vitucci M, Morozova O, Robertson AG, Noushmehr H, Laird PW, Cherniack AD, Akbani R, Huse JT, et al. Comprehensive, Integrative Genomic Analysis of Diffuse Lower-Grade Gliomas. The New England journal of medicine. 2015; 372:2481-2498.
17. Waitkus MS, Diplas BH, Yan H. Isocitrate dehydrogenase mutations in gliomas. Neuro-oncology. 2015.
18. Dang L, White DW, Gross S, Bennett BD, Bittinger MA, Driggers EM, Fantin VR, Jang HG, Jin S, Keenan MC, Marks KM, Prins RM, Ward PS, Yen KE, Liau LM, Rabinowitz JD, et al. Cancer-associated IDH1 mutations produce 2-hydroxyglutarate. Nature. 2009; 462:739-744.
19. Xu W, Yang H, Liu Y, Yang Y, Wang P, Kim SH, Ito S, Yang C, Wang P, Xiao MT, Liu LX, Jiang WQ, Liu J, Zhang JY, Wang B, Frye S, et al. Oncometabolite 2-hydroxyglutarate is a competitive inhibitor of alpha-ketoglutarate-dependent dioxygenases. Cancer cell. 2011; 19:17-30.
20. Turcan S, Rohle D, Goenka A, Walsh LA, Fang F, Yilmaz E, Campos C, Fabius AW, Lu C, Ward PS, Thompson CB, Kaufman A, Guryanova O, Levine R, Heguy A, Viale A, et al. IDH1 mutation is sufficient to establish the glioma hypermethylator phenotype. Nature. 2012; 483:479-483.
21. Lu C, Ward PS, Kapoor GS, Rohle D, Turcan S, Abdel-Wahab O, Edwards CR, Khanin R, Figueroa ME, Melnick A, Wellen KE, O'Rourke DM, Berger SL, Chan TA, Levine RL, Mellinghoff IK, et al. IDH mutation impairs histone demethylation and results in a block to cell differentiation. Nature. 2012; 483:474-478.
22. Reitman ZJ, Jin G, Karoly ED, Spasojevic I, Yang J, Kinzler KW, He Y, Bigner DD, Vogelstein B, Yan H. Profiling the effects of isocitrate dehydrogenase 1 and 2 mutations on the cellular metabolome. Proceedings of the National Academy of Sciences of the United States of America. 2011; 108:3270-3275.
23. Ohka F, Ito M, Ranjit M, Senga T, Motomura A, Motomura K, Saito K, Kato K, Kato Y, Wakabayashi T, Soga T, Natsume A. Quantitative metabolome analysis profiles activation of glutaminolysis in glioma with IDH1 mutation. Tumour biology. 2014; 35:5911-5920.
24. Esmaeili M, Hamans BC, Navis AC, van Horssen R, Bathen TF, Gribbestad IS, Leenders WP, Heerschap A. IDH1 R132H mutation generates a distinct phospholipid metabolite profile in glioma. Cancer research. 2014; 74:4898-4907.
25. Glunde K, Bhujwalla ZM, Ronen SM. Choline metabolism in malignant transformation. Nature reviews Cancer. 2011; 11:835-848.
26. Chesnelong C, Chaumeil MM, Blough MD, Al-Najjar M, Stechishin OD, Chan JA, Pieper RO, Ronen SM, Weiss S, Luchman HA, Cairncross JG. Lactate dehydrogenase A silencing in IDH mutant gliomas. Neuro-oncology. 2014; 16:686-695.
27. James ML, Gambhir SS. A Molecular Imaging Primer: Modalities, Imaging Agents, and Applications. Physiological Reviews. 2012; 92:897-965.
28. Glunde K, Bhujwalla ZM. Metabolic Tumor Imaging Using Magnetic Resonance Spectroscopy. Seminars in Oncology. 2011; 38:26-41.
29. Ardenkjaer-Larsen JH, Fridlund B, Gram A, Hansson G, Hansson L, Lerche MH, Servin R, Thaning M, Golman K. Increase in signal-to-noise ratio of > 10,000 times in liquid-state NMR. Proceedings of the National Academy of Sciences of the United States of America. 2003; 100:10158-10163.
30. Golman K, in 't Zandt R, Thaning M. Real-time metabolic imaging. Proceedings of the National Academy of Sciences of the United States of America. 2006; 103:11270-11275.
31. Kurhanewicz J, Vigneron DB, Brindle K, Chekmenev EY, Comment A, Cunningham CH, Deberardinis RJ, Green GG, Leach MO, Rajan SS, Rizi RR, Ross BD, Warren WS, Malloy CR. Analysis of cancer metabolism by imaging hyperpolarized nuclei: prospects for translation to clinical research. Neoplasia (New York, NY). 2011; 13:81-97.
32. Gutte H, Hansen AE, Johannesen HH, Clemmensen AE, Ardenkjaer-Larsen JH, Nielsen CH, Kjaer A. The use of dynamic nuclear polarization (13)C-pyruvate MRS in cancer. American journal of nuclear medicine and molecular imaging. 2015; 5:548-560.
33. Nelson SJ, Kurhanewicz J, Vigneron DB, Larson PE, Harzstark AL, Ferrone M, van Criekinge M, Chang JW, Bok R, Park I, Reed G, Carvajal L, Small EJ, Munster P, Weinberg VK, Ardenkjaer-Larsen JH, et al. Metabolic imaging of patients with prostate cancer using hyperpolarized [1-(1)(3)C]pyruvate. Science translational medicine. 2013; 5:198ra108.
34. Izquierdo-Garcia JL, Viswanath P, Eriksson P, Chaumeil MM, Pieper RO, Phillips JJ, Ronen SM. Metabolic Reprogramming in Mutant IDH1 Glioma Cells. PloS one. 2015; 10:e0118781.
35. Izquierdo-Garcia JL, Viswanath P, Eriksson P, Cai L, Radoul M, Chaumeil MM, Blough M, Luchman HA, Weiss S, Cairncross JG, Phillips JJ, Pieper RO, Ronen SM. IDH1 Mutation Induces Reprogramming of Pyruvate Metabolism. Cancer research. 2015; 75:2999-3009.
36. Kim JW, Tchernyshyov I, Semenza GL, Dang CV. HIF-1-mediated expression of pyruvate dehydrogenase kinase: a metabolic switch required for cellular adaptation to hypoxia. Cell metabolism. 2006; 3:177-185.
37. Takubo K, Nagamatsu G, Kobayashi CI, Nakamura-Ishizu A, Kobayashi H, Ikeda E, Goda N, Rahimi Y, Johnson RS, Soga T, Hirao A, Suematsu M, Suda T. Regulation of glycolysis by Pdk functions as a metabolic checkpoint for cell cycle quiescence in hematopoietic stem cells. Cell stem cell. 2013; 12:49-61.
38. Abildgaard C, Dahl C, Basse AL, Ma T, Guldberg P. Bioenergetic modulation with dichloroacetate reduces the growth of melanoma cells and potentiates their response to BRAFV600E inhibition. Journal of translational medicine. 2014; 12:247.
39. Lin G, Hill DK, Andrejeva G, Boult JK, Troy H, Fong AC, Orton MR, Panek R, Parkes HG, Jafar M, Koh DM, Robinson SP, Judson IR, Griffiths JR, Leach MO, Eykyn TR, et al. Dichloroacetate induces autophagy in colorectal cancer cells and tumours. British journal of cancer. 2014; 111:375-385.
40. Madhok BM, Yeluri S, Perry SL, Hughes TA, Jayne DG. Dichloroacetate induces apoptosis and cell-cycle arrest in colorectal cancer cells. British journal of cancer. 2010; 102:1746-1752.
41. Sanchez WY, McGee SL, Connor T, Mottram B, Wilkinson A, Whitehead JP, Vuckovic S, Catley L. Dichloroacetate inhibits aerobic glycolysis in multiple myeloma cells and increases sensitivity to bortezomib. British journal of cancer. 2013; 108:1624-1633.
42. Seth P, Grant A, Tang J, Vinogradov E, Wang X, Lenkinski R, Sukhatme VP. On-target inhibition of tumor fermentative glycolysis as visualized by hyperpolarized pyruvate. Neoplasia (New York, NY). 2011; 13:60-71.
43. Sonoda Y, Ozawa T, Hirose Y, Aldape KD, McMahon M, Berger MS, Pieper RO. Formation of intracranial tumors by genetically modified human astrocytes defines four pathways critical in the development of human anaplastic astrocytoma. Cancer research. 2001; 61:4956-4960.
44. Lodi A, Woods SM, Ronen SM. Treatment with the MEK inhibitor U0126 induces decreased hyperpolarized pyruvate to lactate conversion in breast, but not prostate, cancer cells. NMR in biomedicine. 2013; 26:299-306.
45. Hill DK, Orton MR, Mariotti E, Boult JKR, Panek R, Jafar M, Parkes HG, Jamin Y, Miniotis MF, Al-Saffar NMS, Beloueche-Babari M, Robinson SP, Leach MO, Chung Y-L, Eykyn TR. Model Free Approach to Kinetic Analysis of Real-Time Hyperpolarized (13)C Magnetic Resonance Spectroscopy Data. PloS one. 2013; 8:e71996.
46. Daniels CJ, McLean MA, Schulte RF, Robb FJ, Gill AB, McGlashan N, Graves MJ, Schwaiger M, Lomas DJ, Brindle KM, Gallagher FA. A comparison of quantitative methods for clinical imaging with hyperpolarized13C-pyruvate. NMR in biomedicine. 2016:n/a-n/a.
47. Harrison C, Yang C, Jindal A, DeBerardinis RJ, Hooshyar MA, Merritt M, Dean Sherry A, Malloy CR. Comparison of kinetic models for analysis of pyruvate-to-lactate exchange by hyperpolarized 13C NMR. NMR in biomedicine. 2012; 25:1286-1294.
48. Bankson JA, Walker CM, Ramirez MS, Stefan W, Fuentes D, Merritt ME, Lee J, Sandulache VC, Chen Y, Phan L, Chou PC, Rao A, Yeung SC, Lee MH, Schellingerhout D, Conrad CA, et al. Kinetic Modeling and Constrained Reconstruction of Hyperpolarized [1-13C]-Pyruvate Offers Improved Metabolic Imaging of Tumors. Cancer research. 2015; 75:4708-4717.
49. Ward CS, Venkatesh HS, Chaumeil MM, Brandes AH, Vancriekinge M, Dafni H, Sukumar S, Nelson SJ, Vigneron DB, Kurhanewicz J, James CD, Haas-Kogan DA, Ronen SM. Noninvasive detection of target modulation following phosphatidylinositol 3-kinase inhibition using hyperpolarized 13C magnetic resonance spectroscopy. Cancer research. 2010; 70:1296-1305.
50. Petroff OA, Prichard JW, Behar KL, Alger JR, den Hollander JA, Shulman RG. Cerebral intracellular pH by 31P nuclear magnetic resonance spectroscopy. Neurology. 1985; 35:781-788.
51. Vassault A. Lactate dehydrogenase. UV-method with pyruvate and NADH. Methods of enzymatic analysis. 1983; 3:118-126.
52. Triche TJ, Jr., Weisenberger DJ, Van Den Berg D, Laird PW, Siegmund KD. Low-level processing of Illumina Infinium DNA Methylation BeadArrays. Nucleic acids research. 2013; 41:e90.
53. Price ME, Cotton AM, Lam LL, Farre P, Emberly E, Brown CJ, Robinson WP, Kobor MS. Additional annotation enhances potential for biologically-relevant analysis of the Illumina Infinium HumanMethylation450 BeadChip array. Epigenetics & chromatin. 2013; 6:4.
54. Gao J, Aksoy BA, Dogrusoz U, Dresdner G, Gross B, Sumer SO, Sun Y, Jacobsen A, Sinha R, Larsson E, Cerami E, Sander C, Schultz N. Integrative analysis of complex cancer genomics and clinical profiles using the cBioPortal. Science signaling. 2013; 6:pl1.
55. Cerami E, Gao J, Dogrusoz U, Gross BE, Sumer SO, Aksoy BA, Jacobsen A, Byrne CJ, Heuer ML, Larsson E, Antipin Y, Reva B, Goldberg AP, Sander C, Schultz N. The cBio Cancer Genomics Portal: An Open Platform for Exploring Multidimensional Cancer Genomics Data. Cancer discovery. 2012; 2:401-404.
56. Valvona CJ, Fillmore HL, Nunn PB, Pilkington GJ. The Regulation and Function of Lactate Dehydrogenase A: Therapeutic Potential in Brain Tumor. Brain pathology (Zurich, Switzerland). 2015.
57. Witney TH, Kettunen MI, Brindle KM. Kinetic modeling of hyperpolarized 13C label exchange between pyruvate and lactate in tumor cells. The Journal of biological chemistry. 2011; 286:24572-24580.
58. Christensen CE, Karlsson M, Winther JR, Jensen PR, Lerche MH. Non-invasive in-cell determination of free cytosolic [NAD+]/[NADH] ratios using hyperpolarized glucose show large variations in metabolic phenotypes. The Journal of biological chemistry. 2014; 289:2344-2352.
59. Day SE, Kettunen MI, Gallagher FA, Hu DE, Lerche M, Wolber J, Golman K, Ardenkjaer-Larsen JH, Brindle KM. Detecting tumor response to treatment using hyperpolarized 13C magnetic resonance imaging and spectroscopy. Nature medicine. 2007; 13:1382-1387.
60. Rae C, Fekete AD, Kashem MA, Nasrallah FA, Broer S. Metabolism, compartmentation, transport and production of acetate in the cortical brain tissue slice. Neurochemical research. 2012; 37:2541-2553.
61. Draoui N, Feron O. Lactate shuttles at a glance: from physiological paradigms to anti-cancer treatments. Disease models & mechanisms. 2011; 4:727-732.
62. Halestrap AP. The monocarboxylate transporter family-Structure and functional characterization. IUBMB life. 2012; 64:1-9.
63. Harris T, Eliyahu G, Frydman L, Degani H. Kinetics of hyperpolarized 13C1-pyruvate transport and metabolism in living human breast cancer cells. Proceedings of the National Academy of Sciences of the United States of America. 2009; 106:18131-18136.
64. Bergersen LH. Lactate transport and signaling in the brain: potential therapeutic targets and roles in body-brain interaction. Journal of cerebral blood flow and metabolism. 2015; 35:176-185.
65. Miranda TB, Jones PA. DNA methylation: the nuts and bolts of repression. Journal of cellular physiology. 2007; 213:384-390.
66. Flavahan WA, Drier Y, Liau BB, Gillespie SM, Venteicher AS, Stemmer-Rachamimov AO, Suva ML, Bernstein BE. Insulator dysfunction and oncogene activation in IDH mutant gliomas. Nature. 2016; 529:110-114.
67. Reshkin SJ, Bellizzi A, Caldeira S, Albarani V, Malanchi I, Poignee M, Alunni-Fabbroni M, Casavola V, Tommasino M. Na+/H+ exchanger-dependent intracellular alkalinization is an early event in malignant transformation and plays an essential role in the development of subsequent transformation-associated phenotypes. FASEB journal. 2000; 14:2185-2197.
68. Blough MD, Al-Najjar M, Chesnelong C, Binding CE, Rogers AD, Luchman HA, Kelly JJ, Fliegel L, Morozova O, Yip S, Marra M, Weiss S, Chan JA, Cairncross JG. DNA hypermethylation and 1p Loss silence NHE-1 in oligodendroglioma. Annals of neurology. 2012; 71:845-849.
69. Baek G, Tse YF, Hu Z, Cox D, Buboltz N, McCue P, Yeo CJ, White MA, DeBerardinis RJ, Knudsen ES, Witkiewicz AK. MCT4 defines a glycolytic subtype of pancreatic cancer with poor prognosis and unique metabolic dependencies. Cell reports. 2014; 9:2233-2249.
70. Baenke F, Dubuis S, Brault C, Weigelt B, Dankworth B, Griffiths B, Jiang M, Mackay A, Saunders B, Spencer-Dene B, Ros S, Stamp G, Reis-Filho JS, Howell M, Zamboni N, Schulze A. Functional screening identifies MCT4 as a key regulator of breast cancer cell metabolism and survival. The Journal of pathology. 2015.
71. Birsoy K, Wang T, Possemato R, Yilmaz OH, Koch CE, Chen WW, Hutchins AW, Gultekin Y, Peterson TR, Carette JE, Brummelkamp TR, Clish CB, Sabatini DM. MCT1-mediated transport of a toxic molecule is an effective strategy for targeting glycolytic tumors. Nature genetics. 2013; 45:104-108.
72. Gan L, Xiu R, Ren P, Yue M, Su H, Guo G, Xiao D, Yu J, Jiang H, Liu H, Hu G, Qing G. Metabolic targeting of oncogene MYC by selective activation of the proton-coupled monocarboxylate family of transporters. Oncogene. 2015.
73. Queiros O, Preto A, Pacheco A, Pinheiro C, Azevedo-Silva J, Moreira R, Pedro M, Ko YH, Pedersen PL, Baltazar F, Casal M. Butyrate activates the monocarboxylate transporter MCT4 expression in breast cancer cells and enhances the antitumor activity of 3-bromopyruvate. Journal of bioenergetics and biomembranes. 2012; 44:141-153.
74. Colen CB, Seraji-Bozorgzad N, Marples B, Galloway MP, Sloan AE, Mathupala SP. Metabolic remodeling of malignant gliomas for enhanced sensitization during radiotherapy: an in vitro study. Neurosurgery. 2006; 59:1313-1323; discussion 1323-1314.
75. Bola BM, Chadwick AL, Michopoulos F, Blount KG, Telfer BA, Williams KJ, Smith PD, Critchlow SE, Stratford IJ. Inhibition of monocarboxylate transporter-1 (MCT1) by AZD3965 enhances radiosensitivity by reducing lactate transport. Mol Cancer Ther. 2014; 13:2805-2816.
76. Colen CB, Shen Y, Ghoddoussi F, Yu P, Francis TB, Koch BJ, Monterey MD, Galloway MP, Sloan AE, Mathupala SP. Metabolic targeting of lactate efflux by malignant glioma inhibits invasiveness and induces necrosis: an in vivo study. Neoplasia (New York, NY). 2011; 13:620-632.
77. Mathupala SP, Parajuli P, Sloan AE. Silencing of monocarboxylate transporters via small interfering ribonucleic acid inhibits glycolysis and induces cell death in malignant glioma: an in vitro study. Neurosurgery. 2004; 55:1410-1419; discussion 1419.
78. Miranda-Goncalves V, Honavar M, Pinheiro C, Martinho O, Pires MM, Pinheiro C, Cordeiro M, Bebiano G, Costa P, Palmeirim I, Reis RM, Baltazar F. Monocarboxylate transporters (MCTs) in gliomas: expression and exploitation as therapeutic targets. Neuro-oncology. 2013; 15:172-188.
79. Doherty JR, Cleveland JL. Targeting lactate metabolism for cancer therapeutics. The Journal of clinical investigation. 2013; 123:3685-3692.
80. Rohle D, Popovici-Muller J, Palaskas N, Turcan S, Grommes C, Campos C, Tsoi J, Clark O, Oldrini B, Komisopoulou E, Kunii K, Pedraza A, Schalm S, Silverman L, Miller A, Wang F, et al. An inhibitor of mutant IDH1 delays growth and promotes differentiation of glioma cells. Science (New York, NY). 2013; 340:626-630.
81. la Fougère C, Suchorska B, Bartenstein P, Kreth F-W, Tonn J-C. Molecular imaging of gliomas with PET: Opportunities and limitations. Neuro-oncology. 2011; 13:806-819.
82. Park I, Larson PEZ, Tropp JL, Carvajal L, Reed G, Bok R, Robb F, Bringas J, Kells A, Pivirotto P, Bankiewicz K, Vigneron DB, Nelson SJ. Dynamic Hyperpolarized Carbon-13 MR Metabolic Imaging of Nonhuman Primate Brain. Magnetic resonance in medicine. 2014; 71:19-25.
83. Venkatesh HS, Chaumeil MM, Ward CS, Haas-Kogan DA, James CD, Ronen SM. Reduced phosphocholine and hyperpolarized lactate provide magnetic resonance biomarkers of PI3K/Akt/mTOR inhibition in glioblastoma. Neuro-oncology. 2012; 14:315-325.
84. Chaumeil MM, Lupo JM, Ronen SM. Magnetic Resonance (MR) Metabolic Imaging in Glioma. Brain pathology (Zurich, Switzerland). 2015; 25:769-780.
85. Chaumeil MM, Radoul M, Eriksson P, Blough MD, Cheneslong C, Pieper RO, Phillips JJ, Cairncross JG, Ronen SM. (2015). The tumor exception that proves the rule: Hyperpolarized 13C MRS cannot be used to detect the presence of mutant IDH1 glioma or their responses to Temozolomide therapy. International Society for Magnetic Resonance in Medicine 23rd Annual Meeting & Exhibition.