
INTRODUCTION
Recent advances in genetics and epigenetics have improved our understanding of molecular mechanisms of hematological cell transformation and progression to a great extent [1–4]. Numbers of previous studies elaborated leukemic cells exhibited various genetic and epigenetic abnormalities contributing to leukemogenesis, that not only provide the clue for diagnostic stratification and prognostic evaluation, but play a key role for selection of appropriate individuals with suitable targeted therapy [5–8]. Our growing knowledge of the role of aberrant DNA methylation levels silencing leukemia-related anti-oncogenes furnishes a theoretical basis for improving molecular prognostic model [9, 10]. Hypermethylation within the promoters of genes appears to be especially common in some or all types of human hematopoietic neoplasms [11]. Patterns of DNA methylation are nonrandom and tumor-type specific, and this trend has also been shown in acute myeloid leukemia (AML). To date, many genes have been shown to contribute to leukemogenesis through epigenetic silencing. Our previous reports elaborated that aberrant methylation levels of the CHFR gene has been detected in acute myeloid leukemia (AML) [12], and miR-193a hypermethylation has been discovered for participating in the occurrence of t(8;21) AML [13].
In recent years, a few studies have shown that CTNNA1 is expressed in normal hematopoietic stem cells (HSCs); however, its expression is significantly lower in human leukemia initiating cells (LICs) in AML [14–16]. Loss-of-function mutations or decreased CTNNA1 levels have been reported in human cancer cell lines derived from various solid tumors to myeloid malignancies and have been shown to closely be involved in disease progression [17]. This suggests that CTNNA1 is a promising and essential tumor-suppressor gene involved in leukemic cell transformation, and then give a reasonable presumption that any biomedical procedure that could restore CTNNA1 expression represents a potential targeted therapeutic strategy to bring benefit to patients with myeloid malignancies.
In the present work, we examined methylation levels of the CTNNA1 promoter using quantitative methylation-specific PCR method in bone marrow samples from 319 AML patients, with the aim of identifying a subset of patients who harbored aberrant methylation levels and comparing the clinical characteristics of these patients. We also sought to examine chromosome abnormalities and gene mutations associated with AML, for finding significant associations with CTNNA1 hypermethylation. Furthermore, with the purpose of predicting clinical impact, we would analyzed the relapse-free survival (RFS) and overall survival (OS) according to CTNNA1 methylation levels.
RESULTS
Analysis of DNA methylation levels and gene expression of the CTNNA1 gene in patients with AML
Promoter methylation levels of CTNNA1 were assessed in bone marrow samples from 319 AML patients and 30 healthy donors using quantitative methylation-specific PCR (qMSP). CTNNA1 was hypermethylated in 25% (79/319) AML, but not in samples from healthy donors. In positive patients, the media level was 0.8051 (range, 0.1026–3.3691). Gene expression analysis showed significantly decreased expression of CTNNA1 in samples of AML patients compared to control individuals (Figure 1A, P<0.001). Moreover, there was a significant difference of CTNNA1 mRNA levels between the patients with hypermethylation and that with non-methylation (Figure 1B, P=0.001). Seventy nine patients with CTNNA1 hypermethylation exhibited lower mRNA transcripts than those with non-methylation. Furthermore, as shown in Figure 1C, among those patients with hypermethylation, CTNNA1 methylation levels were negatively correlated with mRNA levels (R=-0.364, P=0.011).
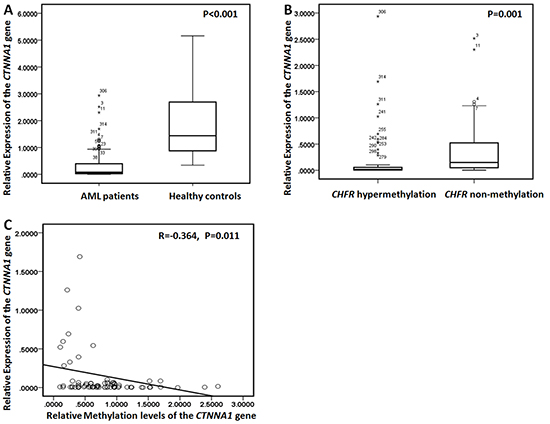
Figure 1: CTNNA1 mRNA levels and methylation levels in AML patients. A. Relative expression of the CTNNA1 gene in 319 AML patients and 30 healthy controls. AML patients exhibited the lower CTNNA1 mRNA levels than healthy controls. B. Relative expression of the CTNNA1 gene was detected in the patients with CTNNA1 hypermethylation and the cases with non-methylation. Patients with CTNNA1 hypermethylation exhibited lower mRNA transcript levels than those with non-methylation C. There was a negative correlation between CTNNA1 methylation levels and CTNNA1 transcripts levels (R=-0.364, P=0.011).
Aberrant DNA methylation of the CTNNA1 promoter was confirmed by bisulfite sequencing
In five newly diagnosed AML patients with CTNNA1 hypermethylation, the promoter of the CTNNA1 gene was confirmed by bisulfite sequencing with methylation rates of 91.7%, 92.2%, 93.9%, 93.7% and 91.7%, respectively (Figure 2). After traditional chemotherapy employed at our institutions, the methylation rate decreased to different degree in all five patients achieving complete hematological remission with methylation rates of 13.3%, 14.4%, 7.8%, 10.6%, 15.0%, respectively.
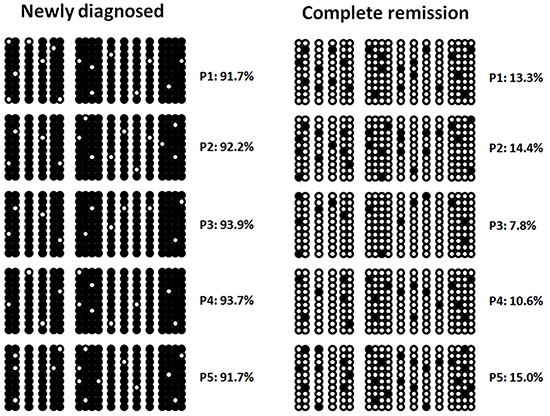
Figure 2: Hypermethylation of the CTNNA1 promoter in five AML patients by bisulfate sequencing at different clinical stages. Methylation rates decreased during hematological complete remission.
The patients with CTNNA1 hypermethylation had lower complete remission rate and inferior survival rate
To assess clinical impact of CTNNA1 hypermethylation, we analyzed clinical characteristics between the patients with DNA hypermethylation and that of without. As Table 1 shown, there were not significant differences in age, sex, white blood cell (WBC), hemoglobin, platelet and marrow blast. The patients with CTNNA1 hypermethylation had the lower complete remission rate after 1-round chemotherapy. However, 1-year relapse rate and 1-year OS exhibited no differences between the two group. Notably, the cases with CTNNA1 hypermethylation had the lower 5-year OS rate (P=0.001).
Table 1: The analysis of clinical characteristics and outcome in two groups
Total |
Hypermethylation (n) |
Non-methylation (n) |
P-value |
|
|---|---|---|---|---|
Patients(N) |
319 |
79 |
240 |
NS |
Age |
40.05 (12-91) |
37.27(14-69) |
40.97(12-91) |
0.085 |
Sex |
186/133 |
45/34 |
141/99 |
0.780 |
M0 |
10 |
4 |
6 |
0.216 |
M1 |
7 |
2 |
5 |
0.551 |
M2 |
84 |
20 |
64 |
0.813 |
M3 |
30 |
4 |
26 |
0.128 |
M4 |
77 |
19 |
58 |
0.980 |
M5 |
90 |
24 |
66 |
0.666 |
M6 |
12 |
3 |
9 |
0.606 |
M7 |
9 |
3 |
6 |
0.393 |
WBC(*109/L) |
21.91(1.9-83.1) |
22.36(2.8-83.1) |
21.76(1.9-76.0) |
0.740 |
Hemoglobin(g/L) |
76.37(31-131) |
76.14(34-131) |
76.45(31-131) |
0.914 |
Platelet(*109/L) |
40.07(5-146) |
39.34(6-141) |
40.30(5-146) |
0.802 |
Marrow blast(%) |
69.07(50-98) |
67.73(50-98) |
69.51(50-98) |
0.298 |
Induction therapy |
||||
Decitabine |
49 |
11 |
38 |
0.703 |
DA |
134 |
33 |
101 |
0.961 |
MA |
136 |
35 |
101 |
0.729 |
Allo-HSCT |
56 |
12 |
44 |
0.524 |
Auto-HSCT |
31 |
6 |
25 |
0.463 |
CR rate (1-round therapy) |
266/319 |
59/79 |
207/240 |
0.017 |
1-year survival |
302 |
76 |
226 |
0.682 |
5-year survival |
96 |
12 |
84 |
0.001 |
FAB, French-American-British Cooperative Group; WBC, white blood cell; DA, daunorubicin and cytarabine; MA, mitoxantrone and cytarabine; allo-HSCT, allogeneic hematopoietic stem cell transplantation; auto-HSCT, autologous hematopoietic stem cell transplantation; CR, complete remission.
DNA hypermethylation of the CTNNA1 gene was significantly associated with unfavorable karyotype
To further investigate cytogenetic abnormalities in AML patients with and without aberrant methylation levels of the CTNNA1 gene, we analyzed the differences of various karyotype abnormalities between the two groups. As Table 2 shown, patients harboring CTNNA1 hypermethylation demonstrated the higher frequency of unfavorable karyotype (P=0.010). Furthermore, CTNNA1 hypermethylation was found to coexist more frequently with +8, -5/5q- compared to non-methylation (P=0.006, P=0.014, respectively). Among 79 individuals with CTNNA1 hypermethylation, eight patients harbored -5/5q-, while only 7 patients were detected with chromosome 5 abnormalities in the lower methylation group. Additionally, among 31 patients carrying +8 abnormalites, Fourteen patients had CTNNA1 hypermethylation, however, 17 cases with non-methylation of the CTNNA1 gene.
Table 2: Comparison of genetic alterations between patients with acute myeloid leukemia with or without hypermethylation of the CTNNA1 Promoter
Variant |
Total (n) |
Hypermethylation (n) |
Non-methylation (n) |
P-value |
|---|---|---|---|---|
Cytogenetic riska |
||||
Favorable |
56 |
13 |
43 |
0.767 |
Intermediate |
172 |
39 |
133 |
0.349 |
Unfavorable |
75 |
27 |
48 |
0.010 |
Cytogenetic characteristicsb |
||||
t(8;21) |
26 |
6 |
22 |
0.668 |
t(15;17) |
20 |
2 |
18 |
0.088 |
inv(16)/t(16;16) |
14 |
4 |
10 |
0.736 |
11q23 abnormalities |
20 |
8 |
12 |
0.090 |
+8 |
31 |
14 |
17 |
0.006 |
-5/5q- |
15 |
8 |
7 |
0.014 |
-7/7q- |
22 |
6 |
16 |
0.778 |
-X |
34 |
11 |
23 |
0.278 |
-Y |
38 |
9 |
29 |
0.869 |
Complex karyotype |
32 |
10 |
22 |
0.370 |
Normal karyotype |
171 |
40 |
131 |
0.541 |
Gene mutationsc |
||||
IDH |
26 |
6 |
20 |
0.835 |
ASXL1 |
33 |
15 |
16 |
0.001 |
FLT3 |
28 |
9 |
19 |
0.344 |
KIT |
10 |
3 |
7 |
0.493 |
TP53 |
16 |
5 |
11 |
0.360 |
TET2 |
30 |
7 |
23 |
0.849 |
UTX |
9 |
3 |
6 |
0.393 |
SF3B1 |
20 |
5 |
15 |
0.580 |
CEBPA |
14 |
2 |
12 |
0.282 |
MLL-PTD |
15 |
6 |
9 |
0.138 |
EZH2 |
11 |
4 |
7 |
0.572 |
DNMT3A |
26 |
10 |
16 |
0.091 |
NPM1 |
46 |
3 |
43 |
0.002 |
NRAS |
16 |
3 |
13 |
0.409 |
SRSF2 |
14 |
6 |
8 |
0.103 |
SETBP1 |
15 |
4 |
11 |
0.533 |
RUNX1 |
26 |
14 |
12 |
<0.001 |
aCytogenetic abnormalities were grouped according to published criteria adopted by Southwest Oncology Group (SWOG) as favorable, intermediate, and unfavorable. Favorable : inv(16)/t(16;16)/del(16q), t(15;17) with/without secondary aberrations, t(8;21) lacking del(9q) or complex karyotypes; Unfavorable: del(5q)/-5, del(7q)/-7, abnormalities of 3q,9q, 11q, 20q, and 17p, t(6;9), t(9;22) and complex karyotypes; Intermediate: normal karyotype, other abnormalities.
bPatients may be counted more than once because of coexistence of more than one cytogenetic abnormality in the leukemic clone.
cPatients may be counted more than once because of coexistence of more than one mutation in the leukemic clone.
Patients with CTNNA1 hypermethylation had the higher frequencies of ASXL1 and RUNX1 mutations
IDH1, ASXL1, FLT3-ITD, MLL-PTD, CEBPA, NRAS, TET2, DNMT3A, KIT, TP53, UTX, SF3B1, SRSF2, SETBP1, RUNX1 and EZH2 mutations were detected in 319 individuals with AML using DNA sequencing. The spectrum of mutation status in the patients with CTNNA1 hypermethylation or non-methylation was shown in Figure 3. The individuals with aberrant CTNNA1 methylation levels had more probabilities of harboring ASXL1 and RUNX1 mutations (P=0.001, and P <0.001 respectively). In the present work, thirty three patients harbored ASXL1 mutations, including 15 cases in hypermethylation group and 16 in non-methylation group. Moreover, among 26 patients with RUNX1 mutations, 14 individual demonstrated aberrant methylation levels of the CTNNA1 gene.
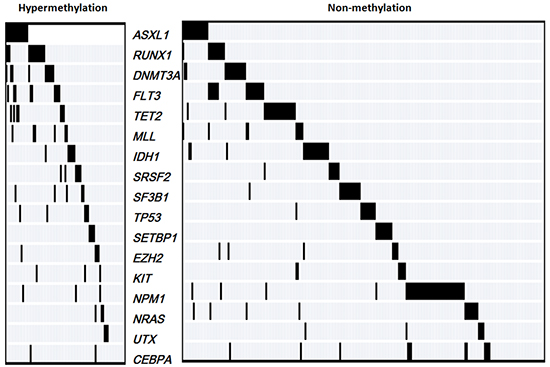
Figure 3: The spectrum of gene mutations in 319 AML patients with hypermethylation and non-methylation of the CTNNA1 gene.
Patients harboring aberrant CTNNA1 methylation levels had poor survival
In the present study, RFS and OS were analyzed in two groups with CTNNA1 hypermethylation and non-methylation. Kaplan-Meier curves indicated that the patients with aberrant CTNNA1 methylation levels were found to present reduced RFS and OS in all 319 AML patients (Figure 4A and 4B, P=0.001, P=0.002, respectively ). Moreover, the same significant differences were also detected in non-M3 AML about RFS and OS (Figure 4C and 4D, P =0.001, P=0.003, respectively). To further appraise the prognostic impact of different CTNNA1 methylation levels, the patients with CTNNA1 hypermethylation were divided into two groups according to the 75th percentile of the initial methylation levels. Nineteen patients were assigned to the group with the higher methylation levels and the others were assigned to the group with lower methylation levels group. We found that the patients with higher CTNNA1 methylation levels exhibited inferior RFS (P=0.014) and OS (P=0.003) (Figure 4E and 4F).
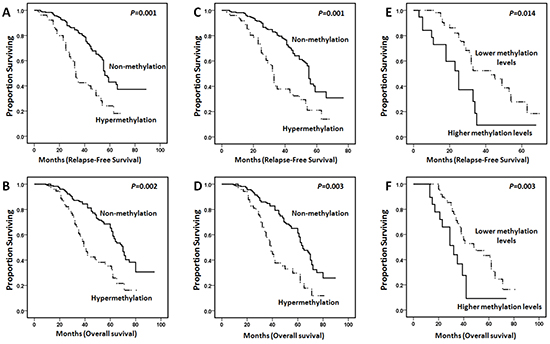
Figure 4: Kaplan-Meier curves for poor relapse-free survival (RFS) and overall survival (OS) in AML patients revealed that CTNNA1 hypermethylation indicated the shorter survival. A. and B., In all 319 AML patients, the cases with CTNNA1 hypermethylation (n=79) had poor RFS and OS compared to those with non-methylation (n=240) (P=0.001 and P=0.002, respectively). C. and D., In non-M3 AML patients, the cases with CTNNA1 hypermethylation (n=75) had inferior RFS and OS compared to those with non-methylation (n=220) (P=0.001 and P=0.003, respectively). E. and F. Patients with higher CTNNA1 methylation levels (n=19) had adverse RFS and OS compared to individuals with lower methylation levels (n=60) (P = 0.014 and P=0.003, respectively).
Hypermethylation of the CTNNA1 gene was entered into a multivariate model in addition to factors significantly associated with prognosis in univariate analysis in our cohort (age>60 years, unfavorable karyotype, ASXL1 mutation, SRSF2 mutation, FLT-ITD, RUNX1 mutation, DNMT3A mutation, and MLL-PTD). In multivariate analysis, CTNNA1 hypermethylation was an independent factor predicting for poor RFS, but not for OS (Table 3). Furthermore, DNMT3A mutation predicted poor RFS independently. The cases with the age of more than 60 years, unfavorable karyotype, RUNX1 mutation, and SRSF2 mutation conferred worse RFS and OS in AML.
Table 3: Univariate and multivariate analysis of clinical and molecular variables for RFS and OS in AML patients
Variables |
Univariate analysis |
Multivariate analysis |
||||||
RFS |
OS |
RFS |
OS |
|||||
P |
OR(95%CI) |
P |
OR(95%CI) |
P |
OR(95%CI) |
P |
OR(95%CI) |
|
agea |
0.005 |
0.731 (0.587-0.911) |
0.009 |
0.745 (0.597-0.929) |
0.001 |
0.650 (0.513-0.824) |
0.002 |
0.669 (0.528-0.847) |
Unfavorable karyotypeb |
0.014 |
0.620 (0.423-0.907) |
0.018 |
0.633 (0.433-0.925) |
0.016 |
0.618 (0.418-0.914) |
0.022 |
0.634 (0.429-0.937) |
CTNNA1 hypermethylation |
0.001 |
0.623 (0.515-0.752) |
0.002 |
0.631 (0.522-0.762) |
0.034 |
0.771 (0.606-0.981) |
0.060 |
0.793 (0.623-1.010) |
ASXL1 mutation |
0.001 |
0.649 (0.515-0.818) |
0.001 |
0.636 (0.504-0.803) |
0.093 |
0.790 (0.600-1.040) |
0.078 |
0.780 (0.592-1.028) |
FLT3-ITD |
0.004 |
0.678 (0.521-0.883) |
0.004 |
0.676 (0.520-0.880) |
0.051 |
0.759 (0.577-1.000) |
0.055 |
0.763 (0.578-1.006) |
RUNX1 mutation |
<0.001 |
0.494 (0.376-0.649) |
<0.001 |
0.489 (0.371-0.643) |
0.012 |
0.661 (0.479-0.914) |
0.016 |
0.662 (0.474-0.925) |
MLL-PTD |
0.003 |
0.628 (0.461-0.857) |
0.002 |
0.617 (0.452-0.841) |
0.291 |
0.820 (0.567-1.185) |
0.243 |
0.799 (0.548-1.165) |
DNMT3A mutation |
0.008 |
0.670 (0.499-0.899) |
0.007 |
0.664 (0.495-0.892) |
0.048 |
0.725 (0.528-0.997) |
0.060 |
0.734 (0.532-1.013) |
SRSF2 mutation |
0.003 |
0.622 (0.455-0.851) |
0.004 |
0.632 (0.462-0.863) |
0.029 |
0.690 (0.493-0.964) |
0.041 |
0.704 (0.503-0.985) |
OR, odds ratio; 95% CI, 95% confidence interval; FLT3-ITD, FLT3 internal tandem duplication; MLL-PTD, MLL partial tandem duplication; RFS, relapse-free survival; OS, overall survival.
aThe patients with the age of more than 60 years vs others.
bUnfavorable cytogenetics versus others.
DISCUSSION
DNA hypermethylation, which causes transcriptional repression, has recently emerged as one of the most frequent changes occurring in cancers, and has been associated with malignant transformation, making it an intriguing new molecular marker for risk stratification [18]. The use of irreversible DNA methyltransferase inhibitors appears to be a promising option for treatment [19–21]. CTNNA1 hypermethylation in AML patients has been reported over the years, however the associations with expected gene aberrations that are frequently detected in myeloid malignancies, as well as clinical impact, has not been elaborated [16].
With regard to our findings, we concluded that DNA hypermethylation of the CTNNA1 promoter was a frequent genetic event in AML that may be a hopeful marker for molecular diagnosis. We confirmed similar results by using bisulfite sequencing at the time of the initial diagnosis and reduced after hematological complete remission in five patients, indicating that CTNNA1 hypermethylation accounting for functional genetic abnormality may contribute to leukemic transformation. However further studies that aberrant methylation levels of the CTNNA1 promoter contributing to leukemogenesis need to execute future.
In our series, we adopted qMSP for detecting CTNNA1 hypermethylation, that being the first report to study methylation levels of the CTNNA1 gene. The patients with aberrant methylation levels demonstrated the lower 1-year complete remission rate and 5-year overall survival rate, indicating that CTNNA1 hypermethylation may be an anticipated molecular marker for molecular prognosis. Meanwhile, close associations were found between CTNNA1 hypermethylation and unfavorable karyotypes, which are recognized as poor markers in AML [22–25]. These findings further suggested that CTNNA1 hypermethylation could be further considered a novel probable prognostic marker for AML.
In the present study, mutation status were in addition examined in cases with CTNNA1 hypermethylation and non-methylation. It was worth pointing that ASXL1 and RUNX1 mutations were more frequently present in patients with CTNNA1 hypermethylation. Recent studies demonstrated that ASXL1 or RUNX1 mutations were reliable markers indicating for inferior outcome in AML [26–28]. However, the mechanism of conceivable connection of CTNNA1 hypermethylation with ASXL1 or RUNX1 mutations is not clear, that would prompt deep researches. It is to be observed that with the frequent detection of these mutations in our patient groups, a broader view may be further admitted that epigenetic regulation, RNA editing and maturation, as well as transcript factors regulation of hematological development have complex connections that contribute to occurrence and progression of leukemia.
Notably, patients with CTNNA1 hypermethylation were investigated having poor survival compared with those with non-methylation. In addition, our comprehensive analysis of CTNNA1 methylation copy numbers provided insights into our understanding of clinical findings in AML patients with different methylation levels. AML patients with the higher methylation levels had inferior RFS and OS, that was the first report that assessment of correlation between methylation copy number and clinical outcome. In multivariate analyses, CTNNA1 hypermethylation indicated shorter RFS, but not OS, in the entire AML cohort. It is worth mentioning that Chen XX et al demonstrated that hypermethylation of CTNNA1 promoter was not an adverse prognostic factor for OS in acute myeloid leukemia using methylation-specific PCR [16]. In the present study, qMSP was used for CTNNA1 methylation levels, that may be one main reason for having a positive survival difference about RFS. Besides, we selected AML patients with more than 50% blasts in bone marrow mainly for reducing experimental error. As for those samples with less than 50% blasts in bone marrow, selection of marrow aspiration site, specimen transporting way, frozen storage time, repeated freezing and thawing cycles may bring immeasurable error for assay data. Thus, that could be another reason for finding decreased RFS in cases with CTNNA1 hypermethylation.
Recent advances in the field of epigenetic regulations have revealed aberrant methylation levels of gene promoter in addition to abnormal mutation status make leukemogenesis more diversified, thus furnishing more accurate breakthrough for individualized therapy [29, 30]. CTNNA1, shown to act as a leukemia-suppressor gene, played a vital role in normal hematological cell development and differentiation [15]. Hence, our analysis of CTNNA1 methylation levels and associations with clinical, cytogenetic, molecular characteristics revealed important insights into the involvement of prognostic molecular model.
MATERIALS AND METHODS
Patient samples
A total of 319 newly diagnosed AML patients and 30 healthy donors attending Chinese PLA General Hospital and China-Japan Friendship Hospital from July 2006 to March 2015 were enrolled in this study. The study was approved by the ethics committees of the participating institutions. Written informed consent was obtained from each subject for sample preservations and genetic analyses. Bone marrow (BM) samples were taken during routine clinical care, and the samples were determined to contain more than 50% blasts by morphologic assessment. Available clinical characteristics were age, sex, French-American-British (FAB) subtype, white blood cell and platelet counts, the amount of BM blasts, and hemoglobin levels. All non-M3 AML patients received intensive induction therapy with DA (daunorubicin and cytarabine) or MA (mitoxantrone and cytarabine) or Decitabine (demethylating treatment) followed by consolidation therapy with cytarabine-based therapy. For M3 patients with t(15;17), all-trans retinoic acid and arsenic trioxide-based treatment was given for induction and consolidation therapy, of which five patients were treated with cytarabine-based therapy as part of consolidation for high-risk diagnosis. Fifty-six patients underwent allogeneic hematopoietic stem cell transplantation (allo-HSCT) and thirty-one cases received autologous hematopoietic stem cell transplantation (auto-HSCT). The clinical characteristics of the patients are described in Table 1.
Clinical end points
Complete remission (CR) was defined as recovery of morphologically normal BM and blood counts and no circulating leukemic blasts or evidence of extramedullary leukemia. Relapse was defined as 5% or more BM blasts, circulating leukemic blasts, or development of extramedullary leukemia. OS was calculated from date of diagnosis until date of death, censoring patients alive at last follow-up. RFS was calculated from the date of CR until date of relapse or death, regardless of cause, censoring patients alive at last follow-up.
DNA isolation and bisulfite modification
DNA was isolated from bone marrow using a Genomic DNA Purification Kit (Promega, Madison, WI), and 1 μg of genomic DNA was treated with sodium bisulfite by using a EpiTect Kit (Qiagen, Hilden, Germany) according to the manufacturer’s protocols. Modified DNA was resuspended in TE buffer and used immediately or stored at -80°C until use. Bisulfite treatment was used to convert unmethylated cytosines into uracils while leaving the methylated cytosines unaffected.
Bisulfite sequencing
Bisulfite-treated DNA was amplified with sequencing primers targeting the CTNNA1 promoter: CTNNA1-F, 5′-TTTAGTTTATTTAGAGGAAGTT-3’, and CTNNA1-R, 5′-ACTCTCTCAAAACTCCAAAAAAACC-3’. PCR amplified region was shown in Supplementary Figure. Polymerase chain reaction (PCR) products were gel purified and cloned into the pCR2.1-TOPO vector (Life Technologies). Plasmids from single colonies were purified using a QIAprep Spin Miniprep Kit (Qiagen, Germany) and sequenced. Ten cones were selected randomly for sequencing from one patients.
Quantitative methylation-specific PCR(qMSP)
Bisulfite-treated DNA was amplified using quantitative methylation-specific polymerase chain reaction (qMSP) with CTNNA1 and MYOD1 (reference gene) specific primers and probes (Supplementary Table S1). PCR amplified region was shown in Supplementary Figure. Quantitative PCR was carried out in a 40-μL volume with Methylight Master Mix (Qiagen), 0.25 μM appropriate primers and probes, and 20 ng bisulfite-treated DNA. The PCR protocol included 40 cycles of denaturation for 15 second at 95°C and annealing for 60 second at 61°C. A standard curve was produced for CTNNA1 and MYOD1 by 10-fold serial dilutions of 5 different plasmid concentrations. The standard curve was saved in a standard curve file. Relative methylation level of CTNNA1 was calculated by the ratio of copies of CTNNA1 and MYOD1. In all PCR assays, a reference dilution was analyzed, and the standard curve was loaded over this reference sample.
The quantitative range and the sensitivity of the assay were assessed by serially diluting HL60 (fully methylated for CTNNA1) into 293 cells (fully unmethylated cell line). Sensitivity was defined as 10-5 because it was the lowest dilution with the highest Ct value (Ct 39.2). Furthermore, in the present study, the mean highest Ct value of normal BM was 39.4. In the qMSP assay, CTNNA1 hypermethylation was defined as a mean Ct value <39.2, and the detectable levels were defined as methylation levels of the CTNNA1 gene >0.007. The efficiency of our standard curves in all experiments ranged between 95% and 99%. The intra- and interassay coefficients of variation of our qMSP were <0.2.
Karyotype analysis and fluorescence in situ hybridization (FISH)
Cytogenetic analysis was carried out on BM samples obtained at diagnosis using a direct method or short-term culturing. The cytogenetic reports were reviewed independently by two expert cytogeneticists blinded to patient clinicopathological information. Metaphase chromosomes were banded by G-banding, and chromosomal abnormalities were described according to the International System for Human Cytogenetic Nomenclature [31]. Complex cytogenetic abnormalities were defined as the presence of at least three unrelated cytogenetic abnormalities in one clone. Cytogenetic abnormalities were grouped according to published criteria adopted by Southwest Oncology Group (SWOG) as favorable, intermediate, and unfavorable [32]. Patients with chromosome 5 or 7 abnormalities, inv(16)/t(16;16) and 11q23 abnormalities were confirmed by FISH.
Real-time quantitative PCR (qPCR)
Bone marrow mononuclear cells were purified by density centrifugation using the standard Ficoll-Hypaque method. Total RNA was isolated from bone marrow mononuclear cells using Qiazol isolation reagent (Qiagen) and was subsequently reverse transcribed to cDNA using a reverse transcription kit (Promega). We performed qPCR to quantify CTNNA1 transcripts in samples from all patients. The primers and probes specific to CTNNA1 and ABL1 are shown in Supplementary Table S2. RT-qPCR was carried out in a 40-μL volume with TaqMan Universal Master Mix (Life Technologies), 0.25 μM appropriate primers and probes, and 20 ng cDNA. The PCR protocol included 40 cycles of denaturation for 15 second at 95°C and annealing for 60 second at 60°C. A standard curve was produced for the CTNNA1 gene by 10-fold serial dilutions of 5 different plasmid concentrations. The standard curve was saved in a standard curve file. Relative expression of CTNNA1 was calculated by the ratio of copies of CTNNA1 and ABL1. For all RT-qPCR assays, a reference dilution was analyzed, and the standard curve was loaded over this reference dilution range.
Detection of gene mutations
IDH1, ASXL1, NPM1, FLT3-ITD, MLL-ITD, CEBPA, NRAS, TET2, DNMT3A, KIT, TP53, UTX, SF3B1, SRSF2, SETBP1, RUNX1 and EZH2 mutations were detected using DNA sequencing for hyper-frequency-mutation sequences as previously reported [33–40], and the primers used for sequencing are shown in Supplementary Table S3.
Statistical analysis
Statistical analysis was performed using the SPSS 18.0 software (SPSS, Chicago, IL). The chi-square and Fisher’s exact (for categorical variables) tests were used to compare patient groups. The correlation between frequency of CTNNA1 promoter methylation and clinical parameters was analyzed with Pearson’s and Spearman’s rank correlations. Overall survival curves were plotted using the Kaplan-Meier method and compared using the log-rank test. The median time between visits was 36 months (range: 5 to 100 months). A cox model was used to identify prognostic variables. In addition to CTNNA1 methylation levels, age, chromosome abnormalities, and mutational status were included as explanatory variables in the regression analyses. For all analyses, P-values were two-tailed, and a P-value of less than 0.05 was considered statistically significant.
ACKNOWLEDGMENTS
This study was supported by the National Natural Science Foundation of China (No. 81300425), the Major National Scientific Instrument and Equipment Development Projects of China (2012YQ03026107), the Clinical Scientific Research Support Funds of the PLA General Hospital (2012FC-TSYS-3051) and the Key Program of Capital Development Foundation (No. 2007-2040).
CONFLICTS OF INTEREST
No potential conflicts of interest were disclosed.
REFERENCES
1. Ferrara F, Schiffer CA. Acute myeloid leukaemia in adults. Lancet. 2013;381:484-495.
2. Levine RL. Molecular pathogenesis of AML: translating insights to the clinic. Best Pract Res Clin Haematol. 2013;26:245-248.
3. Chung SS. Genetic mutations in acute myeloid leukemia that influence clinical decisions. Curr Opin Hematol. 2014;21:87-94.
4. Yang J, Schiffer CA. Genetic biomarkers in acute myeloid leukemia: will the promise of improving treatment outcomes be realized? Expert Rev Hematol. 2012;5:395-407.
5. Murati A, Brecqueville M, Devillier R, Mozziconacci MJ, Gelsi-Boyer V, Birnbaum D. Myeloid malignancies: mutations, models and management. BMC Cancer. 2012;12:304.
6. Shih AH, Abdel-Wahab O, Patel JP, Levine RL. The role of mutations in epigenetic regulators in myeloid malignancies. Nat Rev Cancer. 2012;12:599-612.
7. Jabbour E, Cortes J, Ravandi F, O’Brien S, Kantarjian H. Targeted therapies in hematology and their impact on patient care: chronic and acute myeloid leukemia. Semin Hematol. 2013;50:271-283.
8. Jeong M, Goodell MA. New answers to old questions from genome-wide maps of DNA methylation in hematopoietic cells. Exp Hematol. 2014;42:609-617.
9. Lamba G, Zaidi SK, Luebbers K, Verschraeqen C, Stein GS, Rosmarin A. Epigenetic landscape of acute myelogenous leukemia-moving toward personalized medicine. J Cell Biochem. 2014;115:1669-1672.
10. Hennessy BT, Garcia-Manero G, Kantarjian HM, Giles FJ. DNA methylation in haematological malignancies: the role of decitabine. Expert Opin Investig Drugs. 2003;12:1985-1993.
11. Schoofs T, Müller-Tidow C. DNA methylation as a pathogenic event and as a therapeutic target in AML. Cancer Treat Rev. 2011;37:S13-18.
12. Gao L, Liu F, Zhang H, Sun J, Ma Y. CHFR hypermehtylation, a frequent event in acute myeloid leukemia, is independently associated with an adverse outcome. Genes Chromosomes Cancer. 2016;55:158-168.
13. Li Y, Gao L, Luo X, Wang L, Gao X, Wang W, Sun J, Dou L, Li J, Xu C, Wang L, Zhou M, Jiang M, Zhou J, Caligiuri MA, Nervi C, Bloomfield CD, Marcucci G, Yu L. Epigenetic silencing of microRNA-913a contributes to leukemogenesis in t(8;21) acute myeloid leukemia by activating the PTEN/PI3K signal pathway. Blood. 2013;121:499-509.
14. Fu CT, Zhu KY, Mi JQ, Liu YF, Murray ST, Fu YF, Ren CG, Dong ZW, Liu YJ, Dong M, Jin Y, Chen Y, Deng M, Zhang W, Chen B, Breslin P, Chen SJ, Chen Z, Becker MW, Zhu J, Zhang JW, Liu TX. An evolutionarily conserved PTEN-C/EBPalpha-CTNNA1 axis controls myeloid development and transformation. Blood. 2010;115:4715-4724.
15. Ye Y, McDevitt MA, Guo M, Zhang W, Galm O, Gore SD, Karp JE, Maciejewski JP, Kowalski J, Tsai HL, Gondek LP, Tsai HC, Wang X, Hooker C, Smith BD, Carraway HE, Herman JG. Progressive chromatin repression and promoter methylation of CTNNA1 associated with advanced myeloid malignancies. Cancer Res. 2009;69:8482-8490.
16. Chen XX, Lin J, Qian J, Qian W, Yang J, Ma JC, Deng ZQ, An C, Tang CY, Qian Z, Liu Q. Methylation of CTNNA1 promoter: frequent but not an adverse prognostic factor in acute myeloid leukemia. Leuk Res. 2014;38:613-618.
17. Liu TX, Becker MW, Jelinek J, Wu WS, Deng M, Mikhalkevich N, Hsu K, Bloomfield CD, Stone RM, DeAngelo DJ, Galinsky IA, Issa JP, Clarke MF, Look AT. Chromosome 5q deletion and epigenetic suppression of the gene encoding alpha-catenin (CTNNA1) in myeloid cell transformation. Nat Med. 2007;13:78-83.
18. Gautrey HE, van Otterdijk SD, Cordell HJ; Newcastle 85+ Study Core Team, Mathers JC, Strathdee G. DNA methylation abnormalities at gene promoters are extensive and variable in the elderly and phenocopy cancer cells. FASEB J. 2014;28:3261-3272.
19. Szmigielska-Kapłon A, Robak T. Hypomethylating agents in the treatment of myelodysplastic syndromes and myeloid leukemia. Curr Cancer Drug Targets. 2011;11:837-848.
20. Müller-Thomas C, Rudelius M, Rondak IC, Haferlach T, Schanz J, Huberle C, Schmidt B, Blaser R, Kremer M, Peschel C, Germing U, Platzbecker U, Götze K. Response to azacitidine is independent of p53 expression in higher-risk myelodysplastic syndromes and secondary acute myeloid leukemia. Haematologica. 2014;99:e179-181.
21. Smith BD, Beach CL, Mahmoud D, Weber L, Henk HJ. Survival and hospitalization among patients with acute myeloid leukemia treated with azacitidine ordecitabine in a large managed care population: a real-world, retrospective, claims-based, comparative analysis. Exp Hematol Oncol. 2014;3:10.
22. Estey EH. Acute myeloid leukemia: 2013 update on risk-stratification and management. Am J Hematol. 2013;88:318-327.
23. Morrissette JJ, Bagg A. Acute myeloid leukemia: conventional cytogenetics, FISH, and moleculocentric methodologies. Clin Lab Med. 2011;31:659-686.
24. Hong WJ, Medeiros BC. Unfavorable-risk cytogenetics in acute myeloid leukemia. Expert Rev Hematol. 2011;4:173-184.
25. Estey E. High cytogenetic or molecular genetic risk acute myeloid leukemia. Hematology Am Soc Hematol Educ Program. 2010;2010:474-480.
26. Gelsi-Boyer V, Brecqueville M, Devillier R, Murati A, Mozziconacci MJ, Birnbaum D. Mutations in ASXL1 are associated with poor prognosis across the spectrum of malignant myeloid disesease. J Hematol Oncol. 2012:5:12.
27. Mendler JH, Maharry K, Radmacher MD, Mrózek K, Becker H, Metzeler KH, Schwind S, Whitman SP, Khalife J, Kohlschmidt J, Nicolet D, Powell BL, Carter TH, Wetzler M, Moore JO, Kolitz JE, Baer MR, Carroll AJ, Larson RA, Caligiuri MA, Marcucci G, Bloomfield CD. RUNX1 mutations are associated with poor outcome in younger and older patients with cytogenetically normal acute myeloid leukemia and with distinct gene and MicroRNA expression signatures. J Clin Oncol. 2012;30:3109-3118.
28. Thol F, Kade S, Schlarmann C, Löffeld P, Morgan M, Krauter J, Wlodarski MW, Kölking B, Wichmann M, Görlich K, Göhring G, Bug G, Ottmann O, Niemeyer CM, Hofmann WK, Schlegelberger B, Ganser A, Heuser M. Frequency and prognostic impact of mutations in SRSF2, U2AF1, and ZRSR2 in patients with myelodysplastic syndromes. Blood. 2012;119:3578-3584.
29. Odenike O, Thirman MJ, Artz AS, Godley LA, Larson RA, Stock W. Gene mutations, epigenetic dysregulation, and personalized therapy in myeloid neoplasia: are we there yet? Semin Oncol. 2011;38:196-214.
30. Takahashi S. Current findings for recurring mutations in acute myeloid leukemia. J Hematol Oncol. 2011;4:36.
31. Simons A, Shaffer LG, Hastings RJ. Cytogenetic Nomenclature: Changes in the ISCN 2013 compared to the 2009 Edition. Cytogenet Genome Res. 2013; 141:1-6.
32. Slovak ML, Kopecky KJ, Cassileth PA, Harrington DH, Theil KS, Mohamed A, Paietta E, Willman CL, Head DR, Rowe JM, Forman SJ, Appelbaum FR. Karyotypic analysis predicts outcome of preremission and postremission therapy in adult acute myeloid leukemia: a Soutwest Oncology Group/Eastern Cooperative Oncology Group Study. Blood. 2000; 96:4075-4083.
33. Liu F, Gao L, Jing Y, Xu YY, Ding Y, Zhou MH, Ma C, Li MY, Sun JZ, Wang LL, Yu L. Detection and clinical significance of gene rearrangements in Chinese patients with adult acute lymphoblastic leukemia. Leuk Lymphoma. 2013;54:1521-1526.
34. Shen Y, Zhu YM, Fan X, Shi JY, Wang QR, Yan XJ, Gu ZH, Wang YY, Chen B, Jiang CL, Yan H, Chen FF, Chen HM, Chen Z, Jin J, Chen SJ. Gene mutation patterns and their prognostic impact in a cohort of 1185 patients with acute myeloid leukemia. Blood. 2011;118:5593-5603.
35. Guan L, Gao L, Wang L, Li M, Yin Y, Yu L, Gao C. The Frequency and clinical significance of IDH1 mutations in Chinese acute myeloid leukemia patients. PLoS One. 2013;8:e83334.
36. Schnittger S, Eder C, Jeromin S, Alpermann T, Fasan A, Grossmann V, Kohlmann A, lllig T, Klopp N, Wichmann HE, Kreuzer KA, Schmid C, Staib P, Peceny R, Schimitz N, Kem W, Haferlach C, Haferlanch T. ASXL1 exon12 mutations are frequenct in AML with intermediate risk karyotype and are independently associated with an adverse outcome. Leukemia. 2013;27:82-91.
37. Haferlach T, Nagata Y, Grossmann V, Okuno Y, Bacher U, Nagae G, Schnittger S, Sanada M, Kon A, Alpermann T, Yoshida K, Roller A, Nadarajah N, Shiraishi Y, Shiozawa Y, Chiba K, Tanaka H, Koeffler HP, Klein HU, Dugas M, Aburatani H, Kohlmann A, Miyano S, Haferlach C, Kern W, Ogawa S. Landscape of genetic lesions in 944 patients with myelodysplastic syndromes. Leukemia. 2014;28:241-247.
38. Itzykson R, Kosmider O, Renneville A, Gelsi-Boyer V, Meggendorfer M, Morabito M, Berthon C, Adès L, Fenaux P, Beyne-Rauzy O, Vey N, Braun T, Haferlach T, Dreyfus F, Cross NC, Preudhomme C, Bernard OA, Fontenay M, Vainchenker W, Schnittger S, Birnbaum D, Droin N, Solary E. Prognostic score including gene mutations in chronic myelomonocytic leukemia. J Clin Oncol. 2013 1;31:2428-2436.
39. Mok MM, Du L, Wang CQ, Tergaonkar V, Liu TC, Yin Kham SK, Sanda T, Yeoh AE, Osato M. RUNX1 point mutations potentially identify a subset of early immature T-cell acute lymphoblasticleukaemia that may originate from differentiated T-cells. Gene. 2014;545:111-116.
40. Im AP, Sehgal AR, Carroll MP, Smith BD, Tefferi A, Johnson DE, Boyiadzis M. DNMT3A and IDH mutations in acute myeloid leukemia and other myeloid malignancies: associations with prognosis and potential treatment strategies. Leukemia. 2014;28:1774-1783.