
INTRODUCTION
Osteoporosis is a common human complex disease [1–2]. It is mainly characterized by low bone mineral density (BMD) and/or low-trauma osteoporotic fractures (OF), both of which have strong genetic determination [1–2]. However, the specific genes influencing these phenotypic are largely unknown [1–2]. Much effort has been put into identifying the genetic determinants of this disease, especially the genome-wide association studies (GWAS), which have recently provided rapid insights into genetics of osteoporosis [1–3].
In 2012, Estrada et al. performed the largest meta-analysis to date on lumbar spine BMD (LS-BMD; n = 31,800 cases) and femoral neck BMD (FN-BMD; n = 32,961), including 17 GWAS datasets from individuals of European and East Asian ancestry [3]. They replicated the top BMD-associated markers in 50,933 independent subjects and the risk of low-trauma fracture in 31,016 individuals with a history of fracture (cases) and 102,444 controls [3]. They identified 56 loci (32 new) associated with BMD at genome-wide significance [3]. In 2015, Zheng et al. reported novel non-coding genetic variants with large effects on BMD (n = 53,236) and fracture (n = 508,253) individuals of European ancestry from the general population, and identified EN1 as a determinant of bone density and fracture by whole-genome sequencing [4]. However, these newly identified susceptibility loci exert very small risk effects and cannot fully explain the underlying genetic risk. A large proportion of heritability has yet to be explained.
Pathway analyses of GWAS have been widely conducted in human complex diseases or phenotypes, such as Alzheimer’s disease [5–8], rheumatoid arthritis [9–10] and body mass index [11]. The existing large-scale GWAS datasets provide strong support for the investigation of osteoporosis mechanisms using pathway analysis methods. Zhang et al. used a novel pathway-based analysis approach in wrist ultradistal radius BMD GWAS, examining approximately 500,000 single nucleotide polymorphisms (SNPs) from 984 unrelated whites [12]. They identified the regulation-of-autophagy pathway to be the most significant signal for association with wrist ultradistal radius BMD. They confirmed the regulation-of-autophagy pathway to be significantly associated with arm BMD in the Framingham Heart Study sample containing 2187 subjects [12].
Lee et al. performed a pathway analysis of hip BMD GWAS in 5,715 Europeans [13]. They identified eight significant pathways including gamma-hexachlorocyclohexane degradation, regulation of the smoothened signaling pathway, transmembrane activator and CAML-interactor and B cell maturation antigen stimulation of B cell immune response, endonuclease activity, regulation of defense response to virus, serine type endopeptidase inhibitor_activity, endoribonuclease activity, and myeloid leukocyte differentiation.
All these above findings show different risk pathways may be involved in BMD in different tissues. Here, we conducted multiple pathway analyses of a large-scale lumbar spine BMD GWAS using two published gene-based analysis methods including roxyGeneLD [14] and PLINK [15].
RESULTS
Pathway analysis of BMD genes from the ProxyGeneLD
Using ProxyGeneLD, these 2,468,080 SNPs are assigned to 16898 genes, which include at least one adjusted SNP. Using the 1236 significant genes (unadjusted P<0.05), we performed a pathway analysis. We identified 51 significant KEGG pathways (adjusted P<0.01). Based on the classifications of the KEGG pathways, these 51 pathways can be mainly divided into immune system and diseases (n=10), environmental information processing (n=10), cellular processes (n=8), cancers (n=6), and infectious diseases (n=3). These significant pathways were described in Table 1. All p-values of individual gene from ProxyGeneLD are described in Supplementary Table 1. The detailed gene information in significant KEGG pathways is described in Supplementary Table 2.
Table 1: Significant pathways with P<0.01 by pathway analysis of BMD genes using the “best SNP per gene” method
Classifications |
Pathway ID |
Pathway Name |
C |
O |
E |
R |
rawP |
adjP |
|---|---|---|---|---|---|---|---|---|
Immune diseases |
hsa05323 |
Rheumatoid arthritis |
91 |
16 |
2.61 |
6.14 |
6.45E-09 |
3.50E-07 |
Environmental Information Processing |
hsa04310 |
Wnt signaling pathway |
150 |
20 |
4.3 |
4.66 |
1.26E-08 |
4.16E-07 |
Immune diseases |
hsa04940 |
Type I diabetes mellitus |
43 |
11 |
1.23 |
8.93 |
2.52E-08 |
6.24E-07 |
Environmental Information Processing |
hsa04350 |
TGF-beta signaling pathway |
84 |
14 |
2.41 |
5.82 |
1.14E-07 |
1.88E-06 |
Cardiovascular diseases |
hsa05416 |
Viral myocarditis |
70 |
12 |
2 |
5.99 |
6.63E-07 |
9.38E-06 |
Immune diseases |
hsa05330 |
Allograft rejection |
37 |
9 |
1.06 |
8.49 |
7.60E-07 |
9.41E-06 |
Endocrine system |
hsa04916 |
Melanogenesis |
101 |
14 |
2.89 |
4.84 |
1.17E-06 |
1.29E-05 |
Cellular Processes |
hsa04510 |
Focal adhesion |
200 |
20 |
5.73 |
3.49 |
1.46E-06 |
1.45E-05 |
Immune diseases |
hsa05332 |
Graft-versus-host disease |
41 |
9 |
1.17 |
7.67 |
1.93E-06 |
1.74E-05 |
Cancers: Specific types |
hsa05217 |
Basal cell carcinoma |
55 |
10 |
1.57 |
6.35 |
3.24E-06 |
2.47E-05 |
Infectious diseases: Bacterial |
hsa05150 |
Staphylococcus aureus infection |
55 |
10 |
1.57 |
6.35 |
3.24E-06 |
2.47E-05 |
Cellular Processes |
hsa04114 |
Oocyte meiosis |
112 |
14 |
3.21 |
4.37 |
4.10E-06 |
2.71E-05 |
Environmental Information Processing |
hsa04340 |
Hedgehog signaling pathway |
56 |
10 |
1.6 |
6.24 |
3.85E-06 |
2.71E-05 |
Infectious diseases: Parasitic |
hsa05140 |
Leishmaniasis |
72 |
11 |
2.06 |
5.34 |
6.21E-06 |
3.84E-05 |
Cardiovascular diseases |
hsa05412 |
Arrhythmogenic right ventricular cardiomyopathy (ARVC) |
74 |
11 |
2.12 |
5.19 |
8.15E-06 |
4.75E-05 |
Environmental Information Processing |
hsa04060 |
Cytokine-cytokine receptor interaction |
265 |
22 |
7.59 |
2.9 |
9.53E-06 |
5.18E-05 |
Cancers: Specific types |
hsa05210 |
Colorectal cancer |
62 |
10 |
1.78 |
5.63 |
9.94E-06 |
5.18E-05 |
Immune diseases |
hsa05320 |
Autoimmune thyroid disease |
52 |
9 |
1.49 |
6.04 |
1.53E-05 |
7.57E-05 |
Immune diseases |
hsa05310 |
Asthma |
30 |
7 |
0.86 |
8.15 |
1.77E-05 |
8.01E-05 |
Nervous system |
hsa04722 |
Neurotrophin signaling pathway |
127 |
14 |
3.64 |
3.85 |
1.78E-05 |
8.01E-05 |
Immune system |
hsa04062 |
Chemokine signaling pathway |
189 |
17 |
5.41 |
3.14 |
3.48E-05 |
1.00E-04 |
Infectious diseases: Parasitic |
hsa05145 |
Toxoplasmosis |
132 |
14 |
3.78 |
3.7 |
2.75E-05 |
1.00E-04 |
Immune system |
hsa04672 |
Intestinal immune network for IgA production |
48 |
8 |
1.37 |
5.82 |
6.03E-05 |
2.00E-04 |
Cellular Processes |
hsa04520 |
Adherens junction |
73 |
10 |
2.09 |
4.78 |
4.33E-05 |
2.00E-04 |
Circulatory system |
hsa04270 |
Vascular smooth muscle contraction |
116 |
12 |
3.32 |
3.61 |
1.00E-04 |
3.00E-04 |
Cardiovascular diseases |
hsa05410 |
Hypertrophic cardiomyopathy (HCM) |
83 |
10 |
2.38 |
4.21 |
1.00E-04 |
3.00E-04 |
Cellular Processes |
hsa04530 |
Tight junction |
132 |
13 |
3.78 |
3.44 |
1.00E-04 |
3.00E-04 |
Cellular Processes |
hsa04145 |
Phagosome |
153 |
14 |
4.38 |
3.2 |
1.00E-04 |
3.00E-04 |
Genetic Information Processing |
hsa03040 |
Spliceosome |
127 |
13 |
3.64 |
3.57 |
7.62E-05 |
3.00E-04 |
Cancers: Specific types |
hsa05221 |
Acute myeloid leukemia |
57 |
8 |
1.63 |
4.9 |
2.00E-04 |
6.00E-04 |
Cellular Processes |
hsa04110 |
Cell cycle |
124 |
12 |
3.55 |
3.38 |
2.00E-04 |
6.00E-04 |
Immune system |
hsa04612 |
Antigen processing and presentation |
76 |
9 |
2.18 |
4.14 |
3.00E-04 |
8.00E-04 |
Cardiovascular diseases |
hsa05414 |
Dilated cardiomyopathy |
90 |
10 |
2.58 |
3.88 |
3.00E-04 |
8.00E-04 |
Genetic Information Processing |
hsa03013 |
RNA transport |
151 |
13 |
4.32 |
3.01 |
4.00E-04 |
1.10E-03 |
Cellular Processes |
hsa04810 |
Regulation of actin cytoskeleton |
213 |
16 |
6.1 |
2.62 |
5.00E-04 |
1.30E-03 |
Environmental Information Processing |
hsa04514 |
Cell adhesion molecules (CAMs) |
133 |
12 |
3.81 |
3.15 |
5.00E-04 |
1.30E-03 |
Endocrine system |
hsa04910 |
Insulin signaling pathway |
138 |
12 |
3.95 |
3.04 |
6.00E-04 |
1.50E-03 |
Environmental Information Processing |
hsa04512 |
ECM-receptor interaction |
85 |
9 |
2.43 |
3.7 |
7.00E-04 |
1.60E-03 |
Cancers: Specific types |
hsa05213 |
Endometrial cancer |
52 |
7 |
1.49 |
4.7 |
7.00E-04 |
1.60E-03 |
Cellular Processes |
hsa04144 |
Endocytosis |
201 |
15 |
5.76 |
2.61 |
7.00E-04 |
1.60E-03 |
Environmental Information Processing |
hsa04010 |
MAPK signaling pathway |
268 |
18 |
7.67 |
2.35 |
8.00E-04 |
1.80E-03 |
Cancers: Specific types |
hsa05215 |
Prostate cancer |
89 |
9 |
2.55 |
3.53 |
1.00E-03 |
2.30E-03 |
Cancers: Specific types |
hsa05220 |
Chronic myeloid leukemia |
73 |
8 |
2.09 |
3.83 |
1.10E-03 |
2.40E-03 |
Development |
hsa04380 |
Osteoclast differentiation |
128 |
11 |
3.67 |
3 |
1.20E-03 |
2.60E-03 |
Genetic Information Processing |
hsa03050 |
Proteasome |
44 |
6 |
1.26 |
4.76 |
1.50E-03 |
3.20E-03 |
Environmental Information Processing |
hsa04070 |
Phosphatidylinositol signaling system |
78 |
8 |
2.23 |
3.58 |
1.80E-03 |
3.70E-03 |
Immune diseases |
hsa05322 |
Systemic lupus erythematosus |
136 |
11 |
3.89 |
2.82 |
1.90E-03 |
3.80E-03 |
Neurodegenerative diseases |
hsa05016 |
Huntington’s disease |
183 |
13 |
5.24 |
2.48 |
2.50E-03 |
5.00E-03 |
Endocrine system |
hsa04914 |
Progesterone-mediated oocyte maturation |
86 |
8 |
2.46 |
3.25 |
3.30E-03 |
6.40E-03 |
Environmental Information Processing |
hsa04150 |
mTOR signaling pathway |
52 |
6 |
1.49 |
4.03 |
3.60E-03 |
6.90E-03 |
Environmental Information Processing |
hsa04020 |
Calcium signaling pathway |
177 |
12 |
5.07 |
2.37 |
5.20E-03 |
9.70E-03 |
C, the number of reference genes in the category; O, the number of genes in the gene set and also in the category; E, expected number in the category; R, the ratio of enrichment, rawP, the p value from hypergeometric test; adjP, the p value adjusted by the multiple test adjustment.
Pathway analysis of BMD genes from the PLINK
Using PLINK, these 2,468,080 SNPs are assigned to 16543 genes, which include at least one SNP. Using the 824 significant genes (unadjusted P<0.05), we performed a pathway analysis and identified 38 significant KEGG pathways (adjusted P<0.01). These 38 pathways can be mainly divided into immune system and diseases (n=10), cellular processes (n=8), environmental information processing (n=7), genetic and environmental information processing (n=3), infectious diseases (n=4). These significant pathways were described in Table 2. All p-values of individual gene from PLINK are described in Supplementary Table 3. The detailed gene information in significant KEGG pathways is described in Supplementary Table 4.
Table 2: Significant pathways with P<0.01 by pathway analysis of BMD genes using the meta-analysis method
Classifications |
Pathway ID |
Pathway Name |
C |
O |
E |
R |
rawP |
adjP |
Shared |
|---|---|---|---|---|---|---|---|---|---|
Immune diseases |
hsa05323 |
Rheumatoid arthritis |
91 |
12 |
1.61 |
7.45 |
7.60E-08 |
2.43E-06 |
Y |
Environmental Information Processing |
hsa04060 |
Cytokine-cytokine receptor interaction |
265 |
19 |
4.69 |
4.05 |
3.31E-07 |
5.30E-06 |
Y |
Immune diseases |
hsa04940 |
Type I diabetes mellitus |
43 |
8 |
0.76 |
10.52 |
7.77E-07 |
9.95E-06 |
Y |
Immune diseases |
hsa05320 |
Autoimmune thyroid disease |
52 |
8 |
0.92 |
8.7 |
3.50E-06 |
3.73E-05 |
Y |
Environmental Information Processing |
hsa04010 |
MAPK signaling pathway |
268 |
17 |
4.74 |
3.59 |
7.08E-06 |
6.47E-05 |
Y |
Cellular Processes |
hsa04145 |
Phagosome |
153 |
12 |
2.71 |
4.43 |
1.97E-05 |
1.00E-04 |
Y |
Cellular Processes |
hsa04510 |
Focal adhesion |
200 |
14 |
3.54 |
3.96 |
1.50E-05 |
1.00E-04 |
Y |
Environmental Information Processing |
hsa04310 |
Wnt signaling pathway |
150 |
12 |
2.65 |
4.52 |
1.61E-05 |
1.00E-04 |
Y |
Cardiovascular diseases |
hsa05416 |
Viral myocarditis |
70 |
8 |
1.24 |
6.46 |
3.32E-05 |
2.00E-04 |
Y |
Cellular Processes |
hsa04810 |
Regulation of actin cytoskeleton |
213 |
14 |
3.77 |
3.72 |
3.03E-05 |
2.00E-04 |
Y |
Immune diseases |
hsa05330 |
Allograft rejection |
37 |
6 |
0.65 |
9.17 |
4.38E-05 |
2.00E-04 |
Y |
Infectious diseases: Parasitic |
hsa05140 |
Leishmaniasis |
72 |
8 |
1.27 |
6.28 |
4.08E-05 |
2.00E-04 |
Y |
Immune diseases |
hsa05332 |
Graft-versus-host disease |
41 |
6 |
0.73 |
8.27 |
7.98E-05 |
3.00E-04 |
Y |
Infectious diseases: Parasitic |
hsa05145 |
Toxoplasmosis |
132 |
10 |
2.34 |
4.28 |
1.00E-04 |
4.00E-04 |
Y |
Immune diseases |
hsa05310 |
Asthma |
30 |
5 |
0.53 |
9.42 |
2.00E-04 |
6.00E-04 |
Y |
Immune system |
hsa04672 |
Intestinal immune network for IgA production |
48 |
6 |
0.85 |
7.07 |
2.00E-04 |
6.00E-04 |
Y |
Immune system |
hsa04062 |
Chemokine signaling pathway |
189 |
12 |
3.34 |
3.59 |
2.00E-04 |
6.00E-04 |
Y |
Metabolism |
hsa00250 |
Alanine, aspartate and glutamate metabolism |
32 |
5 |
0.57 |
8.83 |
2.00E-04 |
6.00E-04 |
N |
Cellular Processes |
hsa04142 |
Lysosome |
121 |
9 |
2.14 |
4.2 |
3.00E-04 |
9.00E-04 |
N |
Immune system |
hsa04612 |
Antigen processing and presentation |
76 |
7 |
1.34 |
5.21 |
4.00E-04 |
1.10E-03 |
Y |
Infectious diseases: Bacterial |
hsa05150 |
Staphylococcus aureus infection |
55 |
6 |
0.97 |
6.17 |
4.00E-04 |
1.10E-03 |
Y |
Nervous system |
hsa04722 |
Neurotrophin signaling pathway |
127 |
9 |
2.25 |
4.01 |
4.00E-04 |
1.10E-03 |
Y |
Environmental Information Processing |
hsa04514 |
Cell adhesion molecules (CAMs) |
133 |
9 |
2.35 |
3.82 |
6.00E-04 |
1.50E-03 |
Y |
Environmental Information Processing |
hsa04350 |
TGF-beta signaling pathway |
84 |
7 |
1.49 |
4.71 |
7.00E-04 |
1.70E-03 |
Y |
Environmental Information Processing |
hsa04512 |
ECM-receptor interaction |
85 |
7 |
1.5 |
4.65 |
8.00E-04 |
1.90E-03 |
Y |
Cellular Processes |
hsa04144 |
Endocytosis |
201 |
11 |
3.56 |
3.09 |
1.00E-03 |
2.20E-03 |
Y |
Genetic Information Processing |
hsa03050 |
Proteasome |
44 |
5 |
0.78 |
6.42 |
1.00E-03 |
2.20E-03 |
Y |
Immune system |
hsa04670 |
Leukocyte transendothelial migration |
116 |
8 |
2.05 |
3.9 |
1.10E-03 |
2.30E-03 |
N |
Cancers: Specific types |
hsa05220 |
Chronic myeloid leukemia |
73 |
6 |
1.29 |
4.65 |
1.90E-03 |
3.80E-03 |
Y |
Cellular Processes |
hsa04520 |
Adherens junction |
73 |
6 |
1.29 |
4.65 |
1.90E-03 |
3.80E-03 |
Y |
Development |
hsa04380 |
Osteoclast differentiation |
128 |
8 |
2.26 |
3.53 |
2.10E-03 |
4.10E-03 |
Y |
Cellular Processes |
hsa04530 |
Tight junction |
132 |
8 |
2.34 |
3.43 |
2.50E-03 |
4.70E-03 |
Y |
Infectious diseases: Viral |
hsa05160 |
Hepatitis C |
134 |
8 |
2.37 |
3.37 |
2.70E-03 |
4.90E-03 |
N |
Cancers: Specific types |
hsa05217 |
Basal cell carcinoma |
55 |
5 |
0.97 |
5.14 |
2.90E-03 |
5.20E-03 |
Y |
Environmental Information Processing |
hsa04340 |
Hedgehog signaling pathway |
56 |
5 |
0.99 |
5.05 |
3.10E-03 |
5.40E-03 |
Y |
Cellular Processes |
hsa04114 |
Oocyte meiosis |
112 |
7 |
1.98 |
3.53 |
3.90E-03 |
6.60E-03 |
Y |
Genetic Information Processing |
hsa03013 |
RNA transport |
151 |
8 |
2.67 |
2.99 |
5.60E-03 |
9.00E-03 |
Y |
Genetic Information Processing |
hsa03010 |
Ribosome |
92 |
6 |
1.63 |
3.69 |
5.90E-03 |
9.20E-03 |
N |
C, the number of reference genes in the category; O, the number of genes in the gene set and also in the category; E, expected number in the category; R, the ratio of enrichment, rawP, the p value from hypergeometric test; adjP, the p value adjusted by the multiple test adjustment. Y, this pathway is shared in pathway analysis of BMD genes using the “best SNP per gene” method; N, this pathway is not shared in pathway analysis of BMD genes using the “best SNP per gene” method;
Shared KEGG pathways using both ProxyGeneLD and PLINK
We identified 33 pathways shared in pathway analyses of BMD genes using the “best SNP per gene” method and the meta-analysis method. These 33 pathways are related with immune system and diseases (n=9), cellular processes (n=7), environmental information processing (n=7), infectious diseases (n=3), genetic and environmental information processing (n=2). These shared pathways are highlighted in Table 2.
DISCUSSION
Osteoporosis is a major public health problem. However, the specific genes or pathways influencing these phenotypic are largely unknown. Recently, two pathway analyses of MBD GWAS datasets have been conducted in wrist ultradistal radius and hip. Zhang et al. highlighted the regulation-of-autophagy pathway in wrist ultradistal radius BMD GWAS dataset [12]. Lee et al. identified eight significant pathways in hip BMD GWAS [13]. However, no shared pathway was identified in both studies. We think that different risk pathways may be involved in BMD in different tissues. Here, we conducted multiple pathway analyses of a large-scale lumbar spine BMD GWAS using the BMD genes from ProxyGeneLD [14] and PLINK [15]. Using BMD genes from ProxyGeneLD, we identified 51 significant KEGG pathways. Using BMD genes from PLINK, we identified 38 significant KEGG pathways. Interestingly, 33 pathways are shared in both methods.
We further searched the PubMed and Google Scholar databases to verify our findings. Interestingly, evidence further supports the involvement of these pathways in MBD. Take the Wnt signaling (hsa04310) for example. We identified it to be the most significant pathway (P = 3.26E-09) and 7th significant pathway (P = 1.00E-04) using genes from the “best SNP per gene” method and the meta-analysis method, respectively. It is reported that Wnt signaling plays major roles in almost all aspects of skeletal development and homeostasis. Promising effective therapeutic agents for bone diseases are being developed by targeting the Wnt signaling pathway [16]. Wnt signaling regulates BMD through the lipoprotein receptor-related protein 5 (LRP5), a receptor of this signaling. Genetic variations at the LRP5 gene locus are associated with osteoporosis, which suggests that genetic variations in Wnt signaling genes may affect the pathogenesis of osteoporosis [17].
We further compared our results with previous GWAS [3, 18]. In 2008, Styrkarsdottir et al. also reported the involvement of RANK-RANKL-OPG pathway in BMD [18]. In 2012, Estrada et al. identified 56 loci associated with BMD at genome-wide significance (P < 5.00E-08) [3]. They applied the Gene Relationships Across Implicated Loci (GRAIL) text-mining algorithm to investigate connections between genes in 55 autosomal BMD-associated loci, and revealed significant (P < 0.01) connections between genes in 18 loci in three key biological pathways: the RANK-RANKL-OPG pathway (TNFRSF11A, TNFSF11 and TNFRSF11B); mesenchymal stem cell differentiation (RUNX2, SP7 and SOX9); and Wnt signaling (LRP5, CTNNB1, SFRP4, WNT3, WNT4, WNT5B, WNT16 and AXIN1) [3].
In addition to the Wnt signaling, there is also some literature evidence supporting the involvement of other risk pathways in BMD. More detailed information is described in Table 3.
Table 3: Literature evidences supporting that genes in measles pathway are associated with bone mineral density or osteoporosis
Pathway |
Supporting evidence |
Ref |
|---|---|---|
Rheumatoid arthritis |
BMD data of patients with low to moderately active RA demonstrated an association between high radiological RA damage and low BMD at the hip, which suggests an association between the severity of RA and the risk of generalised bone loss, which also occurred in corticosteroid naive patients [27]. There is a significant negative relationship between femoral neck BMD and disease duration in RA. The value of OR increases proportionately with lengthening of disease duration which can be reduced significantly by methotrexate therapy [28]. |
|
TGF-beta signaling pathway |
TGF-beta is the possible Link between loss of bone mineral density and chronic inflammation [29]. TGF-β/BMPs have widely recognized roles in bone formation during mammalian development and exhibit versatile regulatory functions in the body [30]. |
|
Focal adhesion |
Proline-rich tyrosine kinase 2 (PYK2), a member of the focal adhesion kinase family, plays a key role in the regulation of bone formation, and so inhibitors of this kinase might represent potential bone-building therapies for osteoporotic disease [31]. The focal adhesion, the actin cytoskeleton and cell-cycle are connected pathways and their genes are implicated in the pathogenesis of low BMD [32]. |
|
Type I diabetes mellitus |
The lower BMD in type 1 versus type 2 diabetic patients and control subjects probably results from more rapid bone loss after the onset of type 1 diabetes [33]. patients with type 1 diabetes have a 6.9-fold increased incidence of hip fracture compared to controls [34]. |
|
Regulation of actin cytoskeleton |
The focal adhesion, the actin cytoskeleton and cell-cycle are connected pathways [32]. Genes in these three pathways are implicated in the pathogenesis of low BMD [32]. Genome-wide linkage studies have highlighted the chromosomal region 3p14-p22 as a quantitative trait locus for BMD [35]. The FLNB gene, which is thought to have a role in cytoskeletal actin dynamics, is located within this chromosomal region and presents as a strong candidate for BMD regulation [35]. Mullin et al. identified significant associations between SNPs in the FLNB gene and BMD in Caucasian women [35]. |
Until now, there are kinds of software tools for pathway analysis of the GWAS dataset [19]. Some tools including SNP ratio test [20], GenGen [21], GRASS [22], accept raw genotype datasets as input data. Other tools including ProxyGeneLD [14], ALIGATOR [19], i-GSEA4GWAS [19], and PLINK set-test [23], MAGENTA [24], and GESBAP [19] accept the summary results to subsequent pathway analysis. Here, we selected ProxyGeneLD and PLINK for gene-based test, as we did not have access to raw BMD genotype data. Both the ProxyGeneLD and PLINK have different approaches, assumptions regarding genomic architecture of risk variants in pathways, and different methods for the correction of LD and gene size effects. ProxyGeneLD produces a gene-wide p-value using the lowest p-value of the SNPs (the best SNP), or the lowest p-value in a cluster with multiple SNPs and clusters that fall within the gene boundaries [25]. The P value was adjusted for the LD patterns in the human genome and gene length. PLINK SET SCREEN TEST is a meta-analysis method that combines P values across all the SNPs in genes and adjusts for the LD [15].
Based on these different software tools for pathway analysis, we recognize some limitations using ProxyGeneLD and PLINK. First, the multiple testing corrections may not be sufficient to account for all biases in pathway analysis. The results from the BMD GWAS should be adjusted using a permutation test. However, the original SNP genotype data for each individual are not available to us now. When we get the SNP genotype data, we will further perform a pathway analysis using some available software such as SNP ratio test [20], GenGen [21], and GRASS [22]. These pathway analysis methods or software can be used to analyze the SNP genotype data, and can conduct a permutation test. Future replication studies using genotype data are required to replicate our findings.
In summary, we not only identified the known risk pathway such as Wnt signaling, in which the top GWAS SNPs are significantly enriched, but also highlight some new risk pathways. Interestingly, evidence from further supports the involvement of these pathways in MBD. We believe that our results advance our understanding of BMD mechanisms and will be very informative for future genetic studies in BMD. Further functional evaluation of this pathway to determine the mechanism by which it regulates BMD should be pursued to provide new insights into the pathogenesis of osteoporosis.
MATERIALS AND METHODS
The BMD GWAS dataset
The second lumbar spine BMD GWAS dataset used here comes from the summary results of a large-scale BMD GWAS conducted by Estrada et al [3], which is part of the GEnetic Factors for OSteoporosis consortium (GEFOS). Estrada et al. performed a meta-analysis of GWAS for BMD of the lumbar spine (LS-BMD; n=31,800) including ~2.5 million autosomal genotyped or imputed SNPs from 17 GWAS datasets from North America, Europe, East Asia and Australia [3]. BMD of the lumbar spine (LS-BMD) was measured in all cohorts using dual-energy X-ray absorptiometry following standard manufacturer protocols [3]. GWAS genotyping was followed by imputation to ~2.5 million SNPs from HapMap37 Phase II release 22 using Genome Build 36 [3]. Association between each SNP and BMD in each study was analyzed using sex-specific, age- weight- and principal components-adjusted standardized residuals under an additive genetic model [3]. In the end, we got the association results about 2,468,080 SNPs and BMD [3]. More detailed information is described in the original study [3].
Gene-based testing for GWAS dataset by ProxyGeneLD
ProxyGeneLD assigns SNPs to specific genes [14]. This software flexibly takes into consideration the complex linkage disequilibrium (LD) patterns in the human genome and corrects for the inflation of significance caused by gene length. The LD information comes from the HapMap phase II CEU samples (release 22) [14]. Using the lowest p-value of the SNPs (the best SNP), or the lowest p-value in a cluster with multiple SNPs and clusters that fall within the gene boundaries, ProxyGeneLD produces a gene-wide p-value [25]. Intergenic SNPs, which is in high LD with the mapped genes, will have been mapped to genes for the next analysis.
Gene-based testing for GWAS dataset by PLINK
PLINK is used to test for the GWAS dataset by a meta-analysis of all the SNPs in genes [15]. The set screen test uses an approximate Fisher’s test to combine P values across all the SNPs in genes and adjusts for LD [15]. It is reported that Fisher’s method is asymptotically optimal to get the overall significance by combining a set of P-values obtained from independent tests of the same null hypothesis (each SNP is not associated with disease) [15]. We applied this method to the BMD GWAS dataset using the LD information from the HapMap CEU population.
Pathway-based testing for BMD GWAS dataset
The KEGG pathways in WebGestalt were used for pathway analysis (June 16, 2015) [26]. For a given pathway, a hypergeometric test was used to detect the overrepresentation of BMD-related genes among all of the genes in the pathway [26]. The p-value of K BMD-related genes in the pathway was calculated using
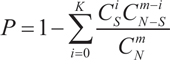
where N is the total number of genes of interest, S is the number of all of the BMD-related genes, m is the number of genes in the pathway and K is the number of BMD-related genes in the pathway.
In order to avoid testing overly narrow or broad pathways, we select WebGestalt KEGG pathways that contain at least 20 and at most 300 genes for subsequent analysis. The reference gene list is the entire entrez gene set. The minimum number of genes for a category is 5. The false discovery rate (FDR) method was used to correct for multiple testing. KEGG pathways with an adjusted P<0.01 are considered to be significantly associated with BMD.
ACKNOWLEDGMENTS
This work was supported by funding from the National Nature Science Foundation of China (Grant No. 81300945, 81471294 and 81271213).
CONFLICTS OF INTEREST
The authors declare that they have no conflicts of interest.
REFERENCES
1. Richards JB, Zheng HF, Spector TD. Genetics of osteoporosis from genome-wide association studies: advances and challenges. Nat Rev Genet. 2012; 13:576-588.
2. Guo Y, Tan LJ, Lei SF, Yang TL, Chen XD, Zhang F, Chen Y, Pan F, Yan H, Liu X, Tian Q, Zhang ZX, Zhou Q, Qiu C, Dong SS, Xu XH, et al. Genome-wide association study identifies ALDH7A1 as a novel susceptibility gene for osteoporosis. PLoS Genet. 2010; 6:e1000806.
3. Estrada K, Styrkarsdottir U, Evangelou E, Hsu YH, Duncan EL, Ntzani EE, Oei L, Albagha OM, Amin N, Kemp JP, Koller DL, Li G, Liu CT, Minster RL, Moayyeri A, Vandenput L, et al. Genome-wide meta-analysis identifies 56 bone mineral density loci and reveals 14 loci associated with risk of fracture. Nat Genet. 2012; 44:491-501.
4. Zheng HF, Forgetta V, Hsu YH, Estrada K, Rosello-Diez A, Leo PJ, Dahia CL, Park-Min KH, Tobias JH, Kooperberg C, Kleinman A, Styrkarsdottir U, Liu CT, Uggla C, Evans DS, Nielson CM, et al. Whole-genome sequencing identifies EN1 as a determinant of bone density and fracture. Nature. 2015; 526:112-117.
5. Liu G, Jiang Y, Wang P, Feng R, Jiang N, Chen X, Song H, Chen Z. Cell adhesion molecules contribute to Alzheimer’s disease: multiple pathway analyses of two genome-wide association studies. J Neurochem. 2012; 120:190-198.
6. Liu G, Yao L, Liu J, Jiang Y, Ma G, Chen Z, Zhao B, Li K. Cardiovascular disease contributes to Alzheimer’s disease: evidence from large-scale genome-wide association studies. Neurobiol Aging. 2014; 35:786-792.
7. Bao X, Liu G, Jiang Y, Jiang Q, Liao M, Feng R, Zhang L, Ma G, Zhang S, Chen Z, Zhao B, Wang R, Li K. Cell adhesion molecule pathway genes are regulated by cis-regulatory SNPs and show significantly altered expression in Alzheimer’s disease brains. Neurobiol Aging. 2015; 36:2904 e2901-2907.
8. Xiang Z, Xu M, Liao M, Jiang Y, Jiang Q, Feng R, Zhang L, Ma G, Wang G, Chen Z, Zhao B, Sun T, Li K, Liu G. Integrating Genome-Wide Association Study and Brain Expression Data Highlights Cell Adhesion Molecules and Purine Metabolism in Alzheimer’s Disease. Mol Neurobiol. 2015; 52:514-521.
9. Eleftherohorinou H, Hoggart CJ, Wright VJ, Levin M, Coin LJ. Pathway-driven gene stability selection of two rheumatoid arthritis GWAS identifies and validates new susceptibility genes in receptor mediated signalling pathways. Hum Mol Genet. 2011; 20:3494-3506.
10. Liu G, Jiang Y, Chen X, Zhang R, Ma G, Feng R, Zhang L, Liao M, Miao Y, Chen Z, Zeng R, Li K. Measles contributes to rheumatoid arthritis: evidence from pathway and network analyses of genome-wide association studies. PLoS One. 2013; 8:e75951.
11. Zhao X, Gu J, Li M, Xi J, Sun W, Song G, Liu G. Pathway analysis of body mass index genome-wide association study highlights risk pathways in cardiovascular disease. Sci Rep. 2015; 5:13025.
12. Zhang L, Guo YF, Liu YZ, Liu YJ, Xiong DH, Liu XG, Wang L, Yang TL, Lei SF, Guo Y, Yan H, Pei YF, Zhang F, Papasian CJ, Recker RR, Deng HW. Pathway-based genome-wide association analysis identified the importance of regulation-of-autophagy pathway for ultradistal radius BMD. J Bone Miner Res. 2010; 25:1572-1580.
13. Lee YH, Choi SJ, Ji JD, Song GG. Pathway analysis of genome-wide association study for bone mineral density. Mol Biol Rep. 2012; 39:8099-8106.
14. Hong MG, Pawitan Y, Magnusson PK, Prince JA. Strategies and issues in the detection of pathway enrichment in genome-wide association studies. Hum Genet. 2009; 126:289-301.
15. Moskvina V, O’Dushlaine C, Purcell S, Craddock N, Holmans P, O’Donovan MC. Evaluation of an approximation method for assessment of overall significance of multiple-dependent tests in a genomewide association study. Genet Epidemiol. 2011; 35:861-866.
16. Regard JB, Zhong Z, Williams BO, Yang Y. Wnt signaling in bone development and disease: making stronger bone with Wnts. Cold Spring Harb Perspect Biol. 2012; 4.
17. Perez-Castrillon JL, Olmos JM, Nan DN, Castillo J, Arozamena J, Montero A, Perez-Nunez MI, Riancho JA. Polymorphisms of the WNT10B gene, bone mineral density, and fractures in postmenopausal women. Calcif Tissue Int. 2009; 85:113-118.
18. Styrkarsdottir U, Halldorsson BV, Gretarsdottir S, Gudbjartsson DF, Walters GB, Ingvarsson T, Jonsdottir T, Saemundsdottir J, Center JR, Nguyen TV, Bagger Y, Gulcher JR, Eisman JA, Christiansen C, Sigurdsson G, Kong A, et al. Multiple genetic loci for bone mineral density and fractures. N Engl J Med. 2008; 358:2355-2365.
19. Wang K, Li M, Hakonarson H. Analysing biological pathways in genome-wide association studies. Nat Rev Genet. 2010; 11:843-854.
20. O’Dushlaine C, Kenny E, Heron EA, Segurado R, Gill M, Morris DW, Corvin A. The SNP ratio test: pathway analysis of genome-wide association datasets. Bioinformatics. 2009; 25:2762-2763.
21. Wang K, Li M, Bucan M. Pathway-based approaches for analysis of genomewide association studies. Am J Hum Genet. 2007; 81:1278-1283.
22. Chen LS, Hutter CM, Potter JD, Liu Y, Prentice RL, Peters U, Hsu L. Insights into colon cancer etiology via a regularized approach to gene set analysis of GWAS data. Am J Hum Genet. 2010; 86:860-871.
23. Purcell S, Neale B, Todd-Brown K, Thomas L, Ferreira MA, Bender D, Maller J, Sklar P, de Bakker PI, Daly MJ, Sham PC. PLINK: a tool set for whole-genome association and population-based linkage analyses. Am J Hum Genet. 2007; 81:559-575.
24. Segre AV, Groop L, Mootha VK, Daly MJ, Altshuler D. Common inherited variation in mitochondrial genes is not enriched for associations with type 2 diabetes or related glycemic traits. PLoS Genet. 2010; 6.
25. Yaspan BL, Bush WS, Torstenson ES, Ma D, Pericak-Vance MA, Ritchie MD, Sutcliffe JS, Haines JL. Genetic analysis of biological pathway data through genomic randomization. Hum Genet. 2011; 129:563-571.
26. Zhang B, Kirov S, Snoddy J. WebGestalt: an integrated system for exploring gene sets in various biological contexts. Nucleic Acids Res. 2005; 33:W741-748.
27. Lodder MC, de Jong Z, Kostense PJ, Molenaar ET, Staal K, Voskuyl AE, Hazes JM, Dijkmans BA, Lems WF. Bone mineral density in patients with rheumatoid arthritis: relation between disease severity and low bone mineral density. Ann Rheum Dis. 2004; 63:1576-1580.
28. Heidari. B, Firouzjahi. A, Mirghssemi. MH, Heidar. P, Hakimi. N and Hajian-Tilaki. K. Relationship between bone mineral density and duration of rheumatoid arthritis Indian Journal of Rheumatology. 2015; 10:10-15.
29. Ehnert S, Baur J, Schmitt A, Neumaier M, Lucke M, Dooley S, Vester H, Wildemann B, Stockle U, Nussler AK. TGF-beta1 as possible link between loss of bone mineral density and chronic inflammation. PLoS One. 2010; 5:e14073.
30. Chen G, Deng C, Li YP. TGF-beta and BMP signaling in osteoblast differentiation and bone formation. Int J Biol Sci. 2012; 8:272-288.
31. Buckbinder L, Crawford DT, Qi H, Ke HZ, Olson LM, Long KR, Bonnette PC, Baumann AP, Hambor JE, Grasser WA, 3rd, Pan LC, Owen TA, Luzzio MJ, Hulford CA, Gebhard DF, Paralkar VM, et al. Proline-rich tyrosine kinase 2 regulates osteoprogenitor cells and bone formation, and offers an anabolic treatment approach for osteoporosis. Proc Natl Acad Sci U S A. 2007; 104:10619-10624.
32. Zintzaras E, Doxani C, Ziogas DC, Mprotsis T, Rodopoulou P, Karachalios T. Bone mineral density and genetic markers involved in three connected pathways (focal adhesion, actin cytoskeleton regulation and cell cycle): the CUMAGAS-BMD information system. Biomarkers. 2011; 16:698-708.
33. Tuominen JT, Impivaara O, Puukka P, Ronnemaa T. Bone mineral density in patients with type 1 and type 2 diabetes. Diabetes Care. 1999; 22:1196-1200.
34. Khan TS, Fraser LA. Type 1 diabetes and osteoporosis: from molecular pathways to bone phenotype. J Osteoporos. 2015; 2015:174186.
35. Mullin BH, Mamotte C, Prince RL, Spector TD, Dudbridge F, Wilson SG. Conditional testing of multiple variants associated with bone mineral density in the FLNB gene region suggests that they represent a single association signal. BMC Genet. 2013; 14:107.