
Introduction
Oncogenic perturbation of cell-cell interactions and hierarchical, three-dimensional (3D) tissue organization characterizes cancer development [1] and progression [2]. Cribriform morphology (CM) is commonly viewed as a histopathological correlate of malignant transformation in human colon [3], detectable in malignant polyps [4] and early invasive colorectal cancer (CRC) [5]. CM has a “Swiss-cheese - like” histological appearance, characterized by multiple abnormal lumens surrounded by stratified malignant epithelium [6]. While CM pathobiology remains unclear, lumen formation and epithelial configuration are governed by mitotic spindle orientation [7, 8].
Spindle alignment is controlled by the apical polarity complex including PTEN, CDC42, PRKC and PARD genes [9, 10]. PTEN is a tumor suppressor that coordinates the CDC42-PRKCZ-PARD complex [11, 12] and regulates spindle orientation in nonpolarized cultured cells [13]. PRKCZ spatially regulates PARD3 that cooperates with the heterotrimeric G protein subunit GNAI3 (guanine nucleotide binding protein alpha inhibiting activity polypeptide 3; also known as Gαi3) to localize the spindle orientation protein, G-protein signalling modulator 2 (GPSM2; also known as LGN) [14]. PARD3 directs the orientation of pulling forces linked through GPSM2 to spindle microtubules for appropriate spindle alignment [14]. Perturbation of this machinery drives transition to dysplasia in Drosophila [15] but effects on colorectal glandular architecture remain unclear.
Components of the apical polarity complex including PTEN [16] and PRKCZ [17] can be enhanced by vitamin D (Vit-D) treatment. This secosteroid also promotes rapid calcium (Ca2+) signalling [18] that activates CDC42 [19, 20] and controls spindle microtubule dynamics [21]. Vit-D influences molecular to multicellular scales of tissue organization [22-24] and suppresses CRC progression [25, 26]. Conversely, mutationally-activated KRAS may inhibit Vit-D growth control [27, 28] by unclear mechanisms.
In this study, we investigated CM pathobiology using three-dimensional (3D) organotypic CRC culture model systems. We tested 1,25(OH)2D3 treatment and investigated effects of mutationally-activated KRAS. To investigate translational relevance of our experimental findings, we conducted histologic, immunohistochemical and/or RNA in situ hybridization assays in murine and human tumors.
Results
PTEN deficiency induces mitotic spindle misorientation, epithelial stratification and cribriform morphology
The tumor suppressor PTEN regulates CDC42 and apical PRKCZ activity [11, 12] that have a mechanistic role in spindle orientation, lumen formation and 3D epithelial morphology [7, 9, 29]. Downstream of PTEN, CDC42 promotes recruitment and activation of PRKCZ at the apical domain that localizes PARD3 [30] to a nascent apical junctional complex required for spindle alignment [14]. Here we show that PTEN-deficiency induces spindle misorientation (Figure 1A, 1B), epithelial stratification and multilumen formation in Caco-2 ShPTEN glandular structures [glands] (Figure 1C [i-iii]) consistent with CRC cribriform morphology [CM] (Figure 1C [iv]). Epithelial stratification was typically focal in early developing glands, becoming organised around multiple abnormal lumens at later stages (Figure 1C [i-iii]). Focal stratification without multilumen formation was observed in some late stage Caco-2 ShPTEN glands (Supplementary Figure S1A). Schematics for epithelial stratification and cribriform morphogenesis are shown (Figure 1D, 1E). Epithelial stratification in Caco-2 and Caco-2 ShPTEN glands is summarised in Figure 1F.
Functional readout of PRKCZ activity at the apical domain can be provided by signal intensity of apical phospho-PRKCZ (p-PRKCZ) [9] or SLC9A3R1 [Solute carrier family 9, subfamily A (NHE3, cation proton antiporter 3), member 3 regulator 1; also known as NHERF-1 (Na+/H+ exchange regulatory factor 1)] [12]. In accord with PTEN regulation of the CDC42/PRKCZ/PARD complex, we show low CDC42-GTP (guanine triphosphate) immunofluorescence, reduced apical p-PRKCZ signal intensity (Figure 1G, 1H) and displacement of PARD3 from the subapical domain in PTEN-deficient Caco-2 ShPTEN glands (Figure 1G). Caco-2 shPTEN glands were more cellular (Supplementary Figure S1B) with greater maximum surface area (Supplementary Figure S1C) than Caco-2 glands, consistent with impairment of PTEN antiproliferative activity. SiRNA knockdown of PTEN in SK-CO-15 CRC cells (Supplementary Figure S1D) also induced cribriform architecture with multiple aberrant lumens (Supplementary Figure S1E, S1F) and increased cellularity, in 3D cultures (Supplementary Figure S1G).
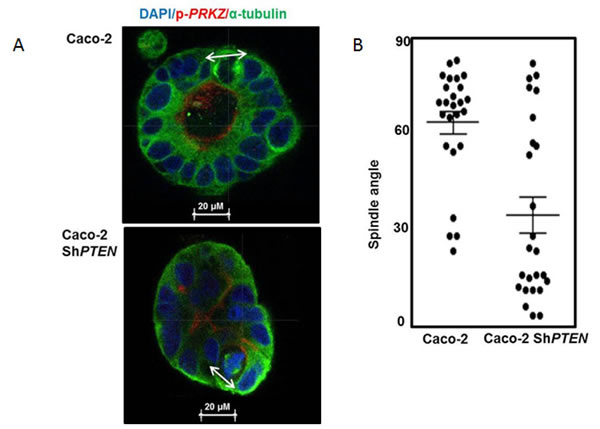
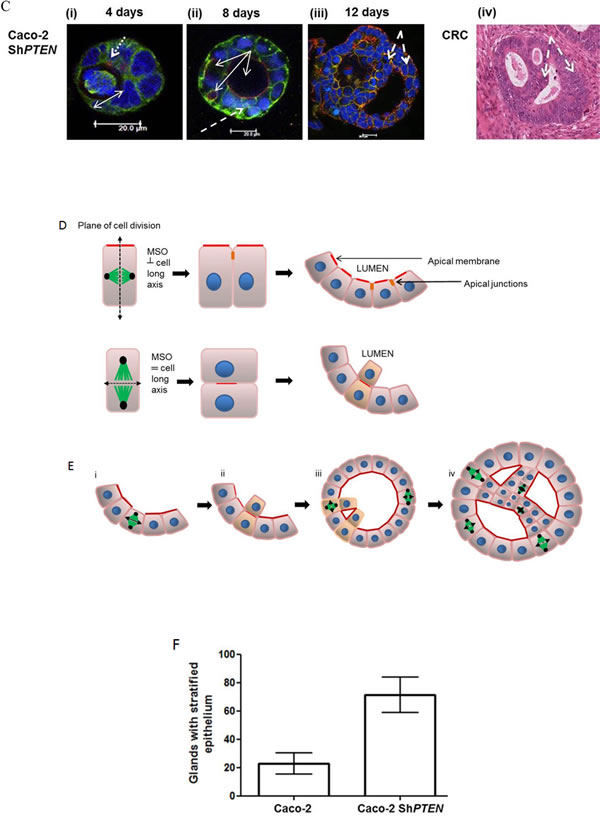
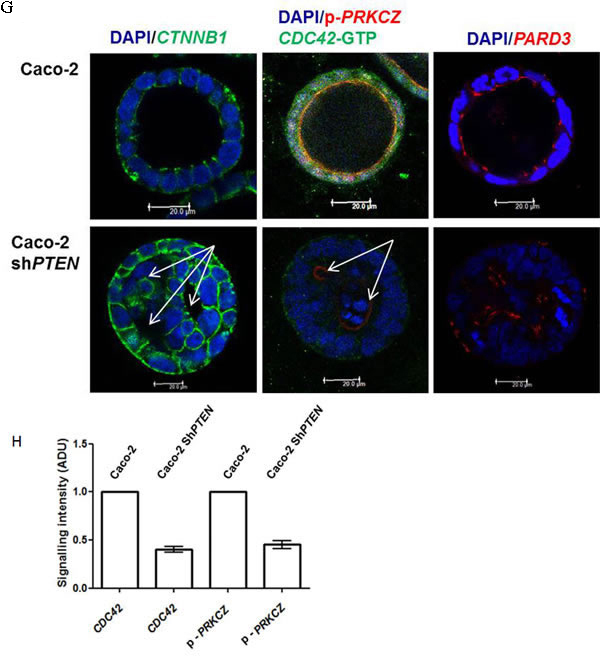
Figure 1: A. PTEN knockdown misorientates the mitotic spindle. Caco-2 and Caco-2 ShPTEN gland cultures at 4 days. DAPI (blue), p-PRKCZ (red) and anti-α -tubulin (green) were used as markers of nuclear DNA, apical PRKCZ activity and spindle microtubules respectively. Mitotic spindle orientation (double headed solid white arrow) is positioned approximately perpendicular to the Caco-2 gland lumen but is misorientated in Caco-2 ShPTEN glands. Scale bar 20 μm. B. Summary angles between spindle midpoints and gland lumens. Caco-2 - 65.5 ± 3.70 vs Caco-2 ShPTEN - 34.9 ± 5.90; (p < 0.01; ANOVA). C. CM evolution in Caco-2 ShPTEN glands. At (i) 4 days, the mitotic spindle (anti-α-tubulin; green) is misorientated relative to gland centres (double headed white arrow), accompanied by misalignment of the apical membrane (AM; red; fine interrupted white arrows). At (ii) 8 days, secretion-driven expansion of ectopic AM forms multiple abnormal lumens (solid white arrows), accompanied by epithelial stratification (broad interrupted white arrows). These phenomena induce well-formed cribriform morphology at (iii) 12 days, characterized by multiple gland lumens surrounded by stratified epithelium (broad interrupted white arrows). Scale bar 20 μm. These glandular architecture alterations are evocative of cribriform morphology in human CRC (iv; H&E section of human CRC showing a glandular structure with multiple aberrant lumens, surrounded by abnormal stratified epithelium [broad interrupted white arrows]). D. Schematic of spindle orientation and epithelial configuration. During mitosis, the plane of cell cleavage (double headed black arrow - interrupted line) lies perpendicular to the spindle midpoint. The mitotic spindle is orientated (MSO) (green microtubules/black centrosomes) approximately perpendicular (┴) to the cell long axis. With this configuration, cell division generates an epithelial monolayer within glands, with cells linked by apical junctions (orange). Apical membranes (AM; red) face a central lumen. When mitotic spindle orientation (MSO) is parallel (═) to the cell long axis cell division generates stratified epithelium (light brown). E. Schematic of CM evolution. Spindle misorientation (i) induces epithelial stratification (light brown) and AM (red) misalignment. (ii) Secretion driven expansion of ectopic AM leads to multilumen formation [7]. (iii) Collectively, these phenomena induce CM (iv). F. Summary effects of PTEN knockdown on epithelial stratification. Values shown indicate % glands with any stratification (Caco-2 - 22.7 ± 7.5% vs Caco-2ShPTEN - 71.3 ± 12.6%; p < 0.03; ANOVA). G. PTEN knockdown suppresses CDC42/PRKCZ and promotes PARD3 mislocalization. CDC42-GTP, apical p-PRKCZ immunofluorescence and PARD3 localization are shown. PARD3 localizes to apical junction regions in Caco-2 glands. In Caco-2 ShPTEN glands low CDC42 activity, low apical p-PRKCZ and PARD3 mislocalization associate with CM. Multilumen formation indicated by solid white arrows. Scale bar 20 μm. H. Summary effects of PTEN knockdown on CDC42 and p-PRKCZ. Values represent fold differences in CDC42-GTP and apical p-PRKCZ intensities respectively in Caco-2 ShPTEN vs Caco-2 glands; CDC42-GTP - 0.40 ± 0.03; p-PRKCZ - 0.45 ± 0.04; p < 0.01 ANOVA).
1,25(OH)2D3 upregulates PTEN/CDC42/ PRKCZ signalling to control gland morphology
1,25(OH)2D3 treatment enhanced vitamin D receptor (VDR) expression, perinuclear and nuclear VDR localization in Caco-2 and Caco-2ShPTEN cells, indicating biological responsiveness of the model system (Figure 2A; Supplementary Figure S2A, S2B). Treatment also increased PTEN expression (Figure 2B) and activation of CDC42 (Figure 2B). 1,25(OH)2D3 treatment enhanced apical p-PRKCZ and SLC9A3R1 signal intensities in Caco-2 glands (Figure 2C, 2D) and restored spindle orientation (Figure 2E, 2F), formation of epithelial monolayers within glands (Figure 2G, 2H) and single lumen formation at progressive stages of Caco-2 ShPTEN gland development (Supplementary Figure S2C, S2D). Continuous 1,25(OH)2D3 treatment sustained long term (20 days) rescue of Caco-2 ShPTEN gland morphology (Supplementary Figure S2E, S2F) while cessation of treatment at 4 days induced reversal to CM (Supplementary Figure S2G, S2H). 1,25(OH)2D3 treatment also suppressed Caco-2 ShPTEN gland cellularity (Supplementary Figure S2I). Hence, 1,25(OH)2D3 targets spindle regulatory machinery to control 3D colorectal gland morphology.
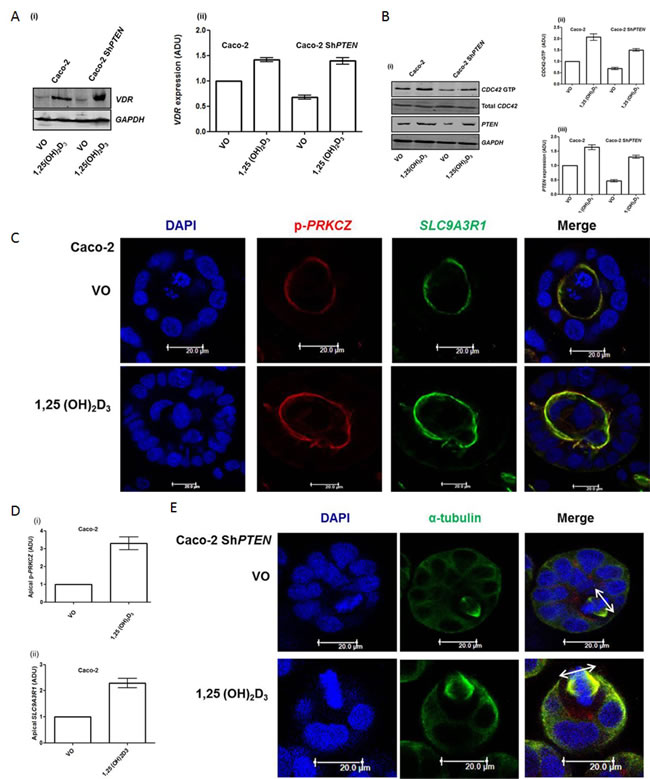
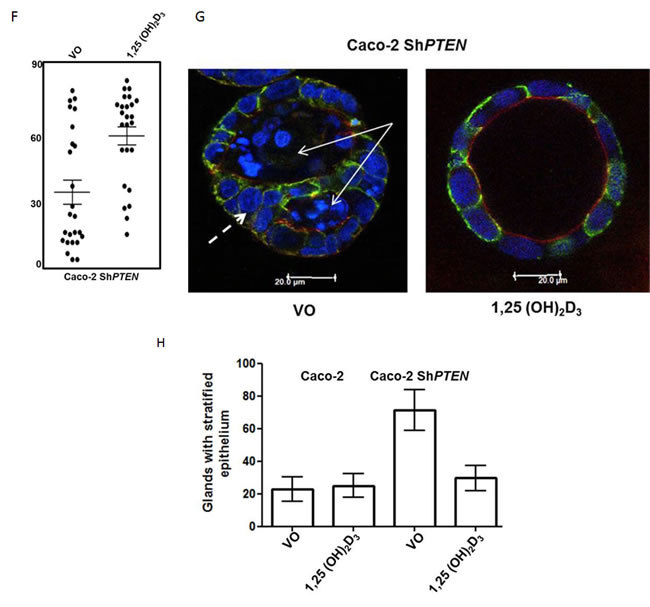
Figure 2: A. Effects of 1,25(OH)2D3 treatment on VDR expression. (i) Treatment effects on vitamin D receptor (VDR) expression in Caco-2 and Caco-2 ShPTEN cells. (ii) Summary densitometry values represent fold expression changes relative to VO treated Caco-2 cells (Caco-2 1,25(OH)2D3 - 1.47 ± 0.04; Caco-2 ShPTEN VO - 0.68 ± 0.04; Caco-2 ShPTEN 1,25(OH)2D3 1.40 ± 0.6; p < 0.01; ANOVA). B. Effects of 1,25(OH)2D3 treatment on PTEN and CDC42-GTP. (i) Treatment effects on CDC42-GTP and PTEN in Caco-2 and Caco-2 ShPTEN cells. Summary densitometry values for (ii) CDC42-GTP and (iii) PTEN represent fold expression changes relative to VO treated Caco-2 cells (CDC42-GTP - Caco-2 1,25(OH)2D3 - 2.0 ± 0.14;Caco-2 ShPTEN VO - 0.68 ± 0.04; Caco-2 ShPTEN; 1,25(OH)2D3 - 1.50 ± 0.06; Caco-2 1,25(OH)2D3 - 1.67 ± 0.09; Caco-2 ShPTEN VO - 0.47 ± 0.044; Caco-2 ShPTEN 1,25(OH)2D3 - 1.3 ± 0.06; p < 0.01; ANOVA). C. 1,25(OH)2D3 treatment upregulates apical polarity signalling (p-PRKCZ and SLC9A3R1). Apical p-PRKCZ (red) and SLC9C3R1 (green) signal intensities in Caco-2 glands after treatment (VO - top row vs 1,25(OH)2D3 - bottom row). Scale bar 20 μm. D. Summary treatment effects on (i) apical p-PRKCZ and (ii) SLC9A3R1. Values represent fold changes of apical p-PRKCZ (3.3 ± 0.37) and SLC9A3R1 (2.29 ± 0.18) signal intensities after 1,25(OH)2D3 vs VO control; p < 0.01; ANOVA). E. 1,25(OH)2D3 treatment restores spindle orientation in Caco-2 ShPTEN glands . Treatment by vehicle only (VO; top panel) or 1,25(OH)2D3 (bottom panel). Imaging by DAPI (blue) and anti-α-tubulin (green). Spindle orientation indicated by double-headed white arrows in Merge images. Scale bar 20 μm. F. Summary effects of 1,25(OH)2D3 treatment on spindle orientation. Summary spindle angles in Caco-2-ShPTEN glands after treatment (VO - 35 ± 5.90 vs 1,25(OH)2D3 - 63 ± 4.50; p < 0.01; ANOVA). G. 1,25(OH)2D3 treatment suppresses development of cribriform morphology. Epithelial stratification (broad interrupted white arrow) and multiple lumens (solid white arrows) in Caco-2ShPTEN glands after treatment by VO vs 1,25(OH)2D3. Scale bar 20 μm. H. 1,25(OH)2D3 treatment suppresses epithelial stratification. Caco-2 - VO - 22.6 ± 7.5%; 1,25(OH)2D3 - 25.0 ± 7.0%; Caco-2 ShPTEN - VO - 71.3 ± 12.6%; 1,25(OH)2D3 - 29.6 ± 7.6%; Two way ANOVA - p < 0.02 for effects of cell type and p < 0.04 for cell type-treatment interaction.
1,25(OH)2D3 rescues defective morphology of PTEN-deficient glands by targeting CDC42/PRKCZ crosstalk
1,25(OH)2D3 initiates rapid nongenomic biological responses, in addition to transcriptional effects on target genes [31].To identify principal 1,25(OH)2D3 - responsive effectors within the PTEN/CDC42/PRKCZ complex, we conducted timescale, transfection and treatment studies. We found that 1,25(OH)2D3 treatment activated CDC42 within 5 minutes but only upregulated PTEN by 24 hrs (Figure 3A-3D). Furthermore, we showed that 1,25(OH)2D3 upregulated CDC42-GTP in both PTEN +/+ and PTEN -/- HCT116 cells (Figure 3D, 3E). Hence, 1,25(OH)2D3 upregulates PTEN but can also activate CDC42 by PTEN-independent mechanisms. To disrupt morphogenesis of Caco-2 glands, we stably transfected cells with dominant negative (DN) CDC42 (Supplementary Figure S3A, S3B) or treated cultures with a PRKCZ pseudosubstrate inhibitor (PRKCZI) (Supplementary Figure S3C, S3D). Aberrant gland morphology resulting from DN CDC42 transfection or PRKCZI treatment could not be reversed by 1,25(OH)2D3 treatment (Supplementary Figure S3A-S3D). Furthermore, rescue of Caco-2 ShPTEN gland morphology by 1,25(OH)2D3 treatment was blocked by PRKCZI treatment (Figure 3F, 3G). These findings show that 1,25(OH)2D3 can rescue aberrant morphology of Caco-2 ShPTEN glands by targeting CDC42/PRKCZ crosstalk.
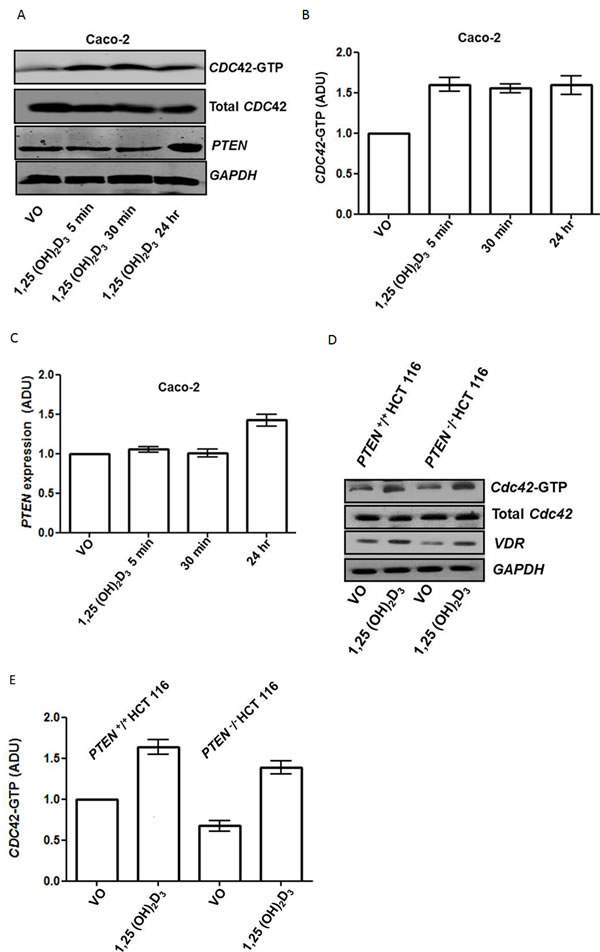
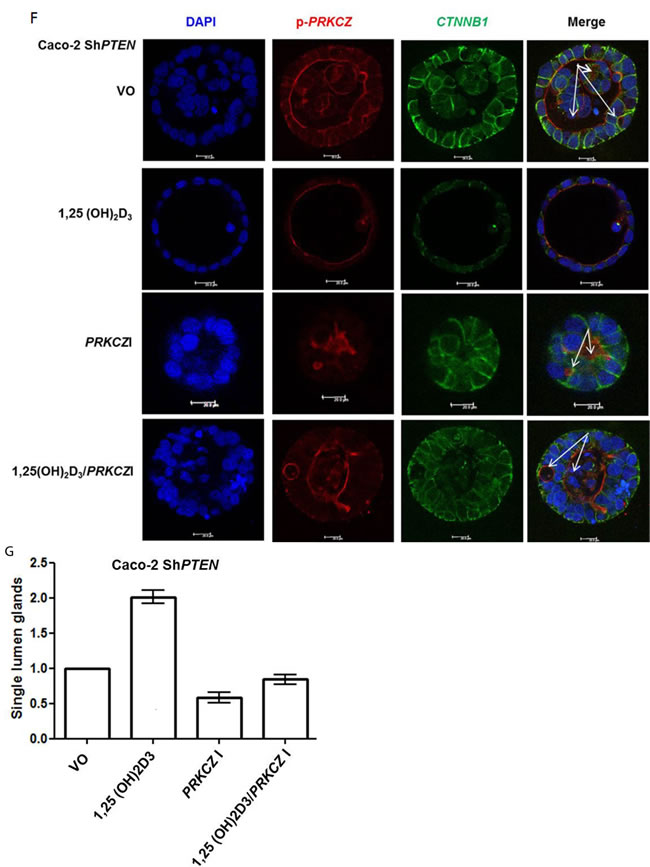
Figure 3: A. Timecourse of 1,25(OH)2D3 modulation of CDC42-GTP and PTEN. GAPDH loading control. B. Summary effects of 1,25(OH)2D3 on CDC42-GTP. Densitometry values are fold differences of CDC42-GTP levels in Caco-2 cells over VO control (1,25(OH)2D3 - 5 mins - 1.6 ± 0.09; 30 mins - 1.55 ± 0.05; 24h - 1.59 ± 0.12; p<0.01; ANOVA). C. Summary effects of 1,25(OH)2D3 on PTEN. Densitometry values are fold differences of PTEN levels in Caco-2 cells over VO control (1,25(OH)2D3 5 mins - 1.05 ± 0.03; 30 mins - 1.0 ± 0.05; 24h - 1.46 ± 0.07; p<0.01 for 24hr ; ANOVA). D. 1,25(OH)2D3 activation of CDC42 is PTEN-independent. Effects of 1,25(OH)2D3 treatment on CDC42-GTP levels in PTEN+/+ and PTEN-/- HCT116 cells. VDR indicates biological responsiveness and GAPDH used as loading control. E. Summary effects of 1,25(OH)2D3 on CDC42-GTP in PTEN+/+ and PTEN-/- HCT116 cells. Values shown are fold differences over VO control (PTEN +/+ HCT116 1,25(OH)2D3 - 1.63 ± 0.09; PTEN -/- HCT116 VO - 0.67 ± 0.07; PTEN -/- HCT116 1,25(OH)2D3 - 1.41 ± 0.04; p<0.01 ANOVA). F. Inhibition of PRKCZ suppresses 1,25(OH)2D3 rescue of Caco-2 ShPTEN gland morphology. Apical p-PRKCZ and CTNNB1 were used as apical and basolateral membrane markers respectively. Multilumen formation indicated by white solid arrows in Merge images. Top row - VO; Second row -1,25(OH)2D3; Third row PRKCZ pseudosubstrate inhibitor (PRKCZI); Bottom row combined 1,25(OH)2D3/PRKCZI treatment. Scale bar 20 μm. G. Summary treatment effects on single lumen formation in Caco-2 ShPTEN glands. Values shown are fold differences over VO control (1,25(OH)2D3 - 2.01 ± 0.1; PRKCZI - 0.59 ± 0.07; 1,25(OH)2D3/PRKCZI - 0.84 ± 0.07; p<0.01 for 1,25(OH)2D3 vs VO; ANOVA).
1,25(OH)2D3 activates CDC42/PRKCZ signalling through Ca2+ flux
1,25(OH)2D3 promotes rapid VDR-dependent Ca2+ flux [18], mediated through L-type voltage-dependent calcium channels (LTVDCCs) [32] and CaM-KII activity [32]. Ca2+ flux and/or calcium-calmodulin dependent protein kinase (CaM-KII) activity can enhance CDC42-GTP polarity signalling [19, 20]. In this study, Caco-2 glands expressed LTVDCCs predominantly at basolateral membranes (Figure 4A). 1,25(OH)2D3 treatment increased intracellular Ca2+ concentration in Caco-2 cells (Figure 4BI, 4BII) and was compared against the Ca2+-ionophore, ionomycin as positive control (Figure 4BIII). SiRNA knockdown of VDR inhibited 1,25(OH)2D3-mediated CDC42 activation (Supplementary Figure S4A). Treatment of cells with the LTVDCC inhibitor nifedipine (NF) or the CaM-KII inhibitor KN-93 also suppressed 1,25(OH)2D3-mediated CDC42 activation but did not affect PTEN levels (Supplementary Figure S4B, S4C). Treatment of developing Caco-2 glands with NF or KN-93 suppressed p-PRKCZ enrichment at apical domains, induced apical membrane misalignment and formation of multiple poorly formed lumens. These phenotypes in Caco-2 glands were not rescued by 1,25(OH)2D3 treatment (Figure 4C, 4D). Furthermore, 1,25(OH)2D3 rescue of morphogenesis in Caco-2 ShPTEN glands was blocked by transfection with VDR SiRNA (Figure 4E, 4F) or cotreatment with NF (Figure 4G, 4H) or KN-93 (Supplementary Figure S4D, S4E). Taken together, these findings implicate VDR and Ca2+/CaM-KII signalling in 1,25(OH)2D3-mediated upregulation of CDC42/PRKCZ and reversal of cribriform morphology in PTEN-deficient colorectal glands.
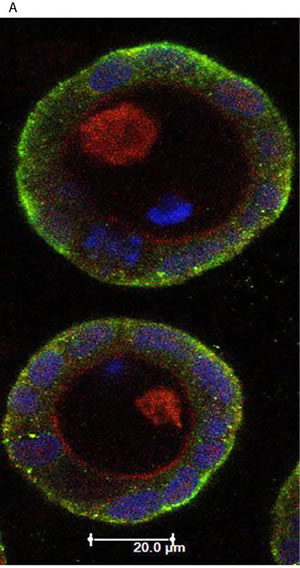
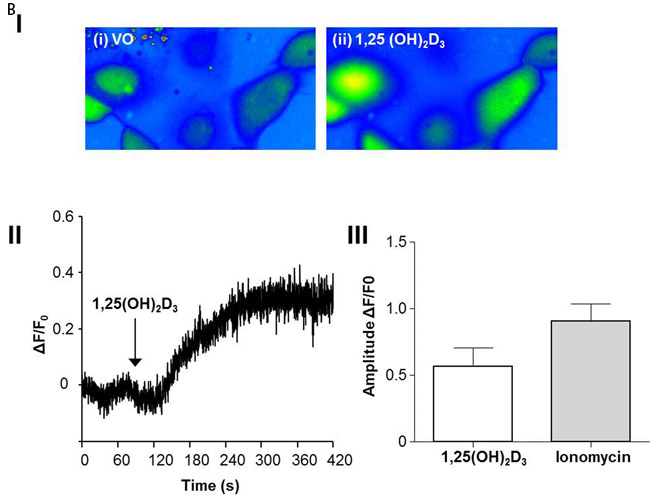
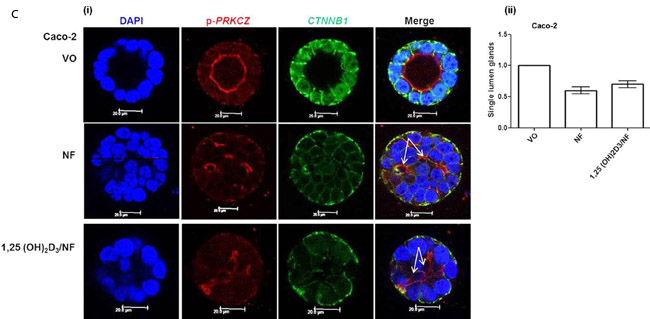
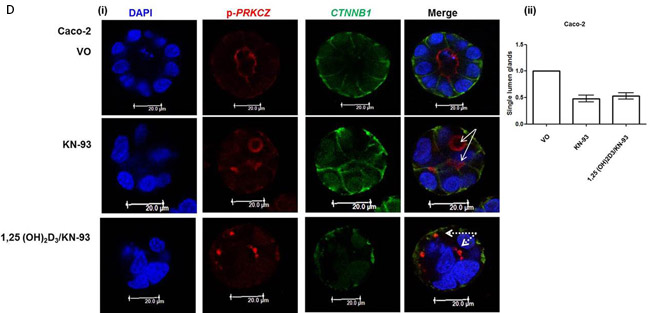
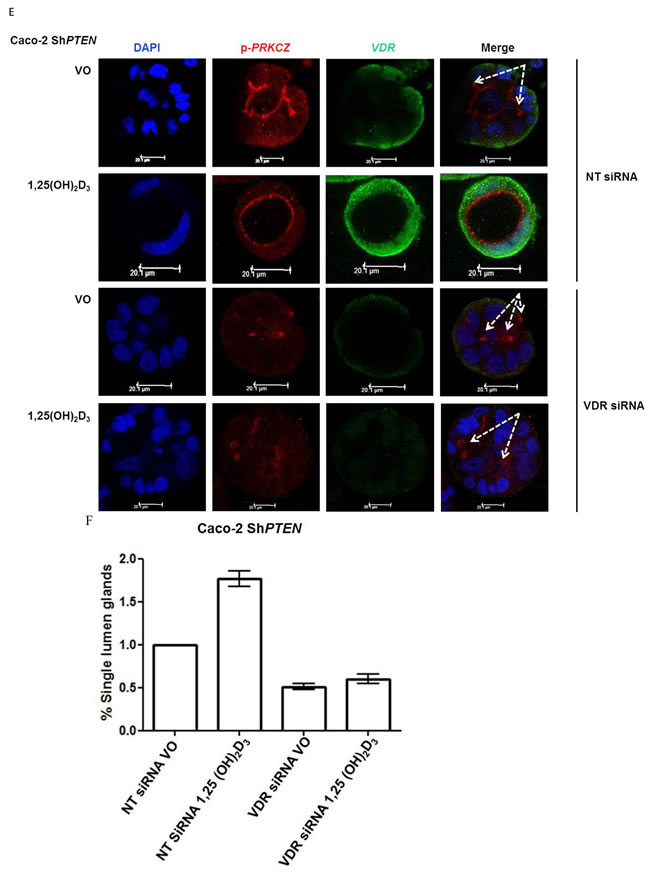
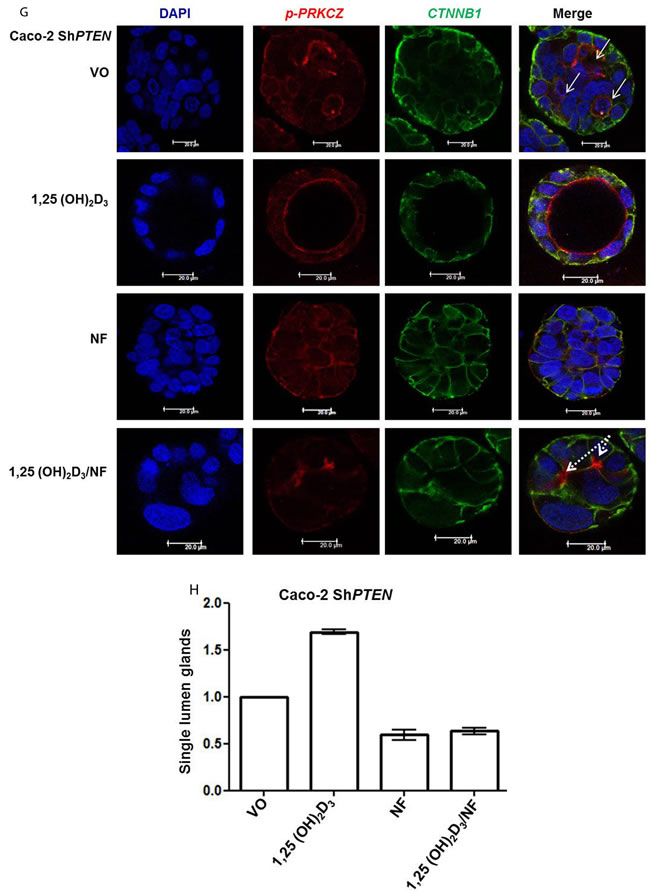
Figure 4: A. Expression of L-type voltage-dependent Ca2+ channels (LTVDCC) in Caco-2 glands. DAPI, p-PRKCZ and Cav 1.3 were used as markers of nuclear DNA, apical PRKCZ activity and the β-subunit of the L-type voltage-dependent Ca2+ channel, respectively. Expression of the β-subunit of LTVDCCs is predominantly basolateral in polarized epithelium [46]. B. 1,25 (OH)2D3 promotes Ca2+ flux I. Representative fluorescence images of Caco-2 cells loaded with fluo-4AM before (i) and after (ii) exposure to 1,25 (OH)2D3 (100nM). An increase in intracellular Ca2+ is shown by an increase in fluorescence intensity.II. Intensity-time plot of the effect of 1,25 (OH)2D3.III. Summary bar chart of fluorescence amplitude evoked by 1,25 (OH)2D3 (n = 13 cells) or the Ca2+-ionophore, ionomycin (1µM, n = 27 cells; positive control). C. Calcium channel blockade impedes morphogenesis. (i) Caco-2 gland morphogenesis at 4 days after VO (top row), NF (second row) or 1,25(OH)2D3/NF combined treatment (bottom row). Multiple lumen formation indicated by solid white arrows in Merge images. Scale bar - 20 μM.(ii) Summary values represent fold change of single lumen formation relative to VO control (NF - 0.60 ± 0.06; 1,25(OH)2D3/NF in combination - 0.70 ± 0.054; p < 0.01 ANOVA). D. CaM-KII inhibition impedes morphogenesis. (i) Caco-2 gland morphogenesis at 4 days after VO (top row), KN-93 (second row) or 1,25(OH)2D3/KN-93 combined treatment (bottom row). Aberrant lumens or ectopic AM foci (indicated by solid or fine interrupted white arrows respectively in Merge). Scale bar - 20 μM. (ii) Summary values represent single lumen formation relative to VO control (KN-93 - 0.50 ± 0.06; 1,25(OH)2D3/KN-93 - 0.60 ± 0.062; p < 0.01 ANOVA). E. VDR knockdown suppresses 1,25(OH)2D3 rescue of morphogenesis. Images show Caco-2 ShPTEN gland morphogenesis after SiRNA transfection and treatment, at 4 days of culture. Top 2 panels show effects of VO or 1,25(OH)2D3 treatment combined with non-targeting (NT) SiRNA; bottom 2 panels - VO or 1,25(OH)2D3 treatment combined with VDR SiRNA. DAPI, p-PRKCZ and VDR imaging. Ectopic AM foci indicated by fine interrupted white arrows in Merge images. Scale bar 20 μM. F. Summary effects of VDR knockdown on 1,25(OH)2D3 rescue of Caco-2 ShPTEN gland morphogenesis. Values shown represent fold differences of single lumen formation against Caco-2 ShPTEN glands treated by VO and transfected by NT SiRNA. NT SiRNA + 1,25(OH)2D3 - 1.77 ± 0.09; VDR SiRNA +VO = 0.51 ± 0.04; VDR SiRNA + 1,25(OH)2D3 = 0.6 ± 0.06; p < 0.01; ANOVA. G. Calcium channel blockade impedes 1,25(OH)2D3 rescue of Caco-2 ShPTEN gland morphogenesis. Treatments were VO (top panel), 1,25(OH)2D3 (second panel), NF (third panel), NF/1,25(OH)2D3 (fourth panel). Multiple lumens and ectopic AM without lumens indicated by solid and fine interrupted white arrows respectively in Merge images. Scale bar 20 μM. H. Summary treatment effects on single lumen formation in Caco-2 ShPTEN glands. Values are expressed as fold changes over VO control (1,25(OH)2D3 - 1.69 ± 0.03; NF - 0.59 ± 0.05; 1,25(OH)2D3/NF - 0.63 ± 0.03; p < 0.01 ANOVA).
Mutationally-activated KRAS suppresses 1,25(OH)2D3 rescue of gland morphology
Because KRAS can suppress 1,25(OH)2D3 growth control [27], we investigated effects of mutationally-activated KRAS V12 in our 3D Caco-2 and Caco-2 ShPTEN model systems. Transfection with KRAS V12 inhibited lumen formation to yield glands that were cell-filled and solid in appearance (Figure 5A, 5B), in accord with previous findings [33]. Furthermore, KRAS V12 transfection suppressed apical localization of PRKCZ in Caco-2 glands (Figure 5A, 5C) and inhibited 1,25(OH)2D3 rescue of Caco-2 ShPTEN gland morphology (Figure 5D, 5E). Collectively, these findings show that mutationally-activated KRAS perturbs apical PRKCZ, impairs multicellular organization and suppresses 1,25(OH)2D3 rescue of Caco-2 ShPTEN gland morphology.
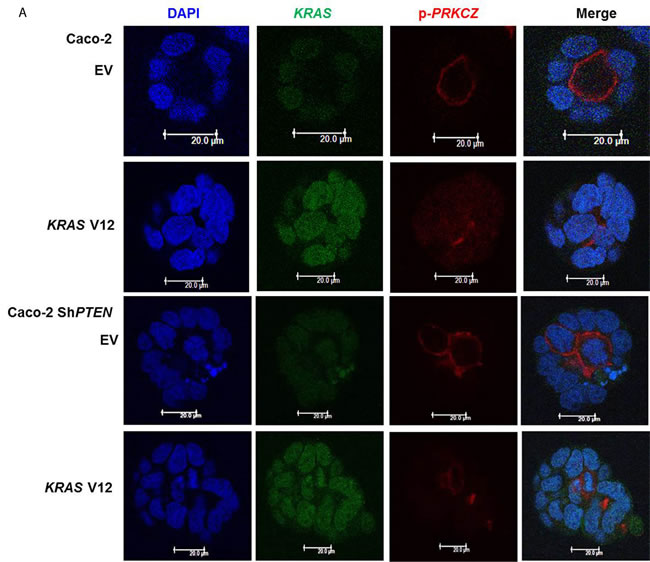
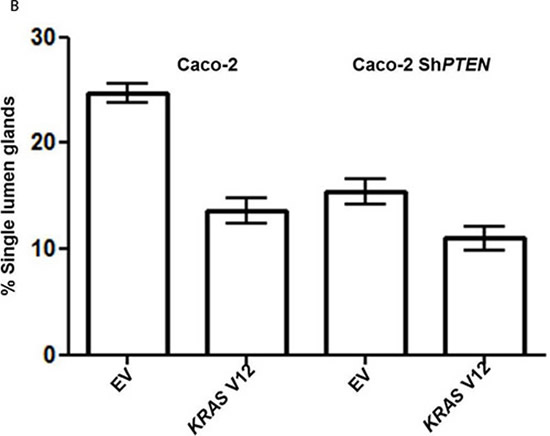
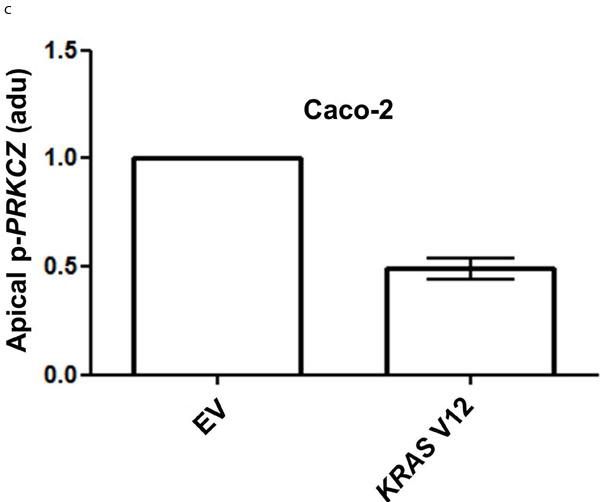
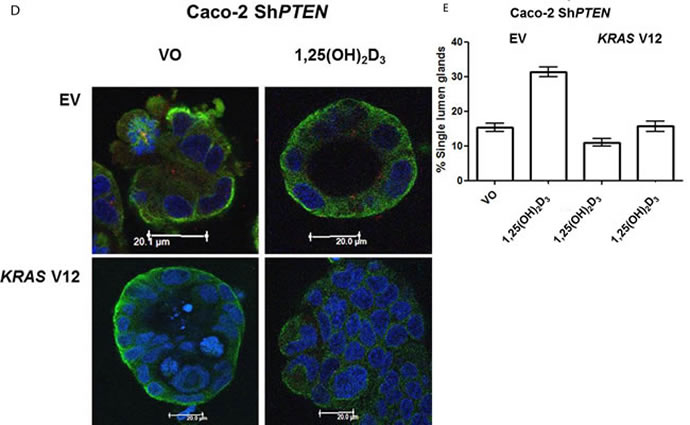
Figure 5: A. KRASV12 impedes morphogenesis. Caco-2 (top 2 rows) or Caco-2 ShPTEN glands (bottom 2 rows) were transfected with empty vector (EV) or mutationally-activated KRAS (KRAS V12) and imaged for DAPI (blue), KRAS (green) and phospho-PRKCZ (red). KRAS V12 transfections in both cell types induced increased KRAS immunoreactivity and perturbed gland morphology, leading to solid cell-filled glands lacking a central lumen. Multilumen formation is observed in EV transfected Caco-2 ShPTEN glands, although this phenotype is suppressed by KRAS V12 transfection. B. Summary effects of KRAS V12 transfection on gland morphogenesis. Values shown represent % single lumen formation in Caco-2 vs Caco-2ShPTEN glands after EV or KRAS V12 transfection at 4 days of culture (Caco-2 - 24.6 ± 0.88 (EV) vs 13.6 ± 1.2 (KRASV12); Caco-2 ShPTEN -15.3 ± 1.3 (EV) vs 11.0 ± 1.5 (KRASV12 ; p < 0.01;ANOVA). C. Summary effects of KRAS V12 transfection on apical p-PRKCZ intensity in Caco-2 glands. Results shown represent fold differences against EV transfected Caco-2 glands. KRAS V12 transfectants = 0.495 ± 0.1; p < 0.01; Student’s t test. D. KRAS V12 suppresses 1,25(OH)2D3 rescue of gland morphology. Top panel - transfection by empty vector (EV) only and treatment by VO or 1,25(OH)2D3. Bottom panel - transfection with KRASV12, combined with VO or 1,25(OH)2D3 treatment. E. Summary effects of KRAS V12 vs EV transfection on 1,25(OH)2D3 rescue of Caco-2 ShPTEN gland morphology. Values shown represent single lumen formation after transfection and treatment at 4 days of culture, namely EV/VO - 15.3 ± 1.2 (VO); EV/1,25(OH)2D3 - 31.3 ± 1.46; KRAS/VO - 11.0 ± 1.15; KRAS/1,25(OH)2D3 - 15.67 ± 1.45; p < 0.001; Two Way ANOVA).
Translational and human studies
To investigate relationships between polarity signalling and tumor morphology, we conducted histologic, immunohistochemical or RNAscope in situ hybridization studies in murine or human intestinal tumors. We used an intestinal epithelial-specific PTEN knockdown murine model [34] to investigate morphology of intestinal cancers driven purely by PTEN-deficiency. Two small intestinal cancers developed after a long latency and showed cribriform morphology (Figure 6A). In whole sections of 35 human CRCs in cohort (i), CM was heterogeneously distributed and affected > 50% glandular structures in 11.3 ± 8.5/40 fields per tumor. CM involved < 20% CRC surface area and was detected at low power (LP) (x3) magnification in 19/35 CRC whole tumor sections (54%). In TMA studies of cohort (ii), CM was detected at LP microscopy in 131/306 CRC cores (43%) from 92 CRCs. CM was more frequent in grade I and II CRCs in both study cohorts (Supplementary Figure S6A). Thirty six CRCs were mutated at KRAS exons 12 or 13 while 56 had wt KRAS. PTEN mRNA and protein expression were assayed by RNAScope [35] and immunohistochemistry (IHC) respectively. SLC9A3R1 IHC assays were also conducted as readout of apical PRKCZ activity [36]. We found that log-transformed PTEN RNAscope values (Supplementary Figure S6B), PTEN IHC and SLC9A3R1 IHC scores all correlated in human CRC (PTEN RNA vs PTEN IHC, r = 0.33; p < 0.01; PTEN RNA vs SLC9A3R1 apical intensity r = 0.36; p < 0.01; PTEN IHC vs SLC9A3R1 apical intensity r = 0.28; p < 0.01 Figure 6B). Apical SLC9A3R1 intensity directly associated with CM in all CRCs (Figure 6C) but PTEN RNA expression associated with CM only in the KRAS wt subset (Figure 6D). Apical SLC9A3R1 intensity had prognostic significance and inversely associated with histological grade (Figure 6E) and lymph node metastasis (Figure 6F).
Collectively, the above translational studies support the utility of 3D organotypic models for investigation of multiscale development of cancer morphology. As a manifestation of well- and moderately-differentiated CRC, CM associates with defective AP signalling and may represent an early or intermediate stage in a trajectory of cancer dedifferentiation (Supplementary Figure S6C).
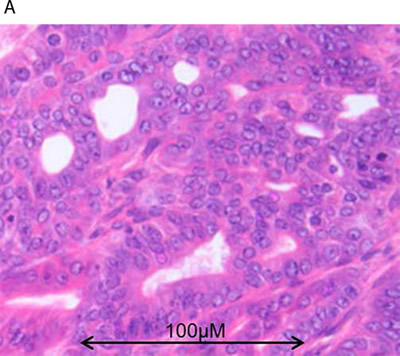
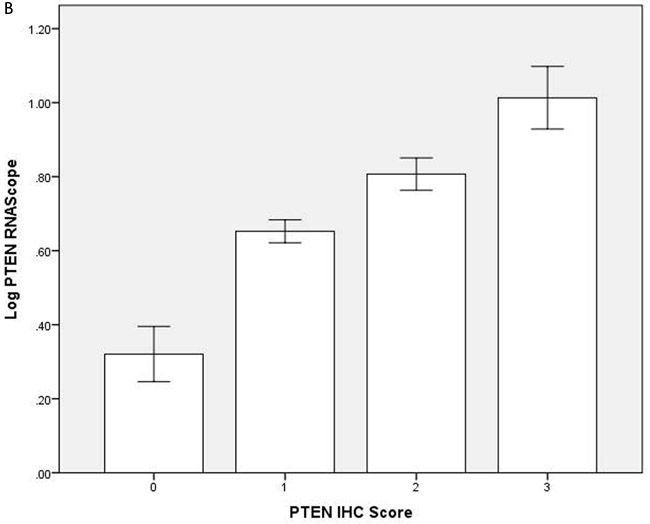
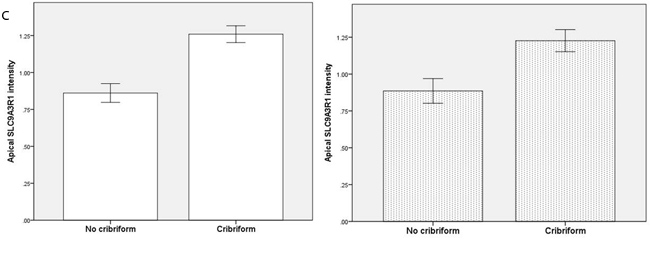
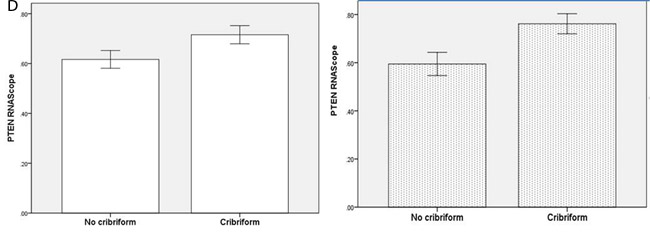
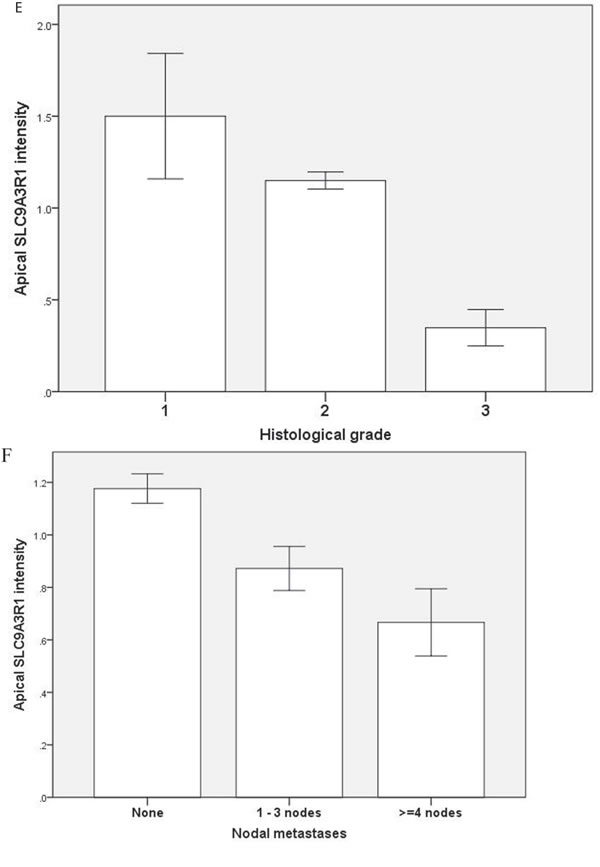
Figure 6: A. PTEN-deficient intestinal tumors show cribriform morphology. A H&E section of a small intestinal carcinoma driven purely by PTEN-deficiency, shows CM. Scale bar 100 µM. B. Relationship between log transformed PTEN RNA levels and IHC scores in 309 cores from 92 human CRCs (r = 0.325; p < 0.01; Pearson’s test). C. Apical SLC9A3R1 and cribriform morphology. Apical SLC9A3R1 intensity and CM in all CRC cores (open bars; p < 0.01) and in the wt KRAS CRC subset (shaded bars; p = 0.014 ANOVA). D. PTEN RNA and cribriform morphology. PTEN RNA levels (log values) and CM in all CRC cores (open bars; p = 0.056) and in the KRAS wt CRC subset (shaded bars; p < 0.01) ANOVA. E. Apical SLC9A3R1 intensity and histological grade in all second cohort CRCs (n = 92). Grade I - 1.50 ± 0.34; Grade II - 1.15 ± 0.05; Grade III - 0.35 ± 0.1;p < 0.01;ANOVA. F. Apical SLC9A3R1 intensity and lymph node metastases in all second cohort CRCs (n = 92). No nodal involvement - 1.18 ± 0.06; invasion of 1-3 nodes - 0.87 ± 0.08; invasion of ≥ 4 nodes - 0.67 ± 0.13; p < 0.01; ANOVA.
Discussion
PTEN modulates the highly conserved apical CDC42-PRKCZ-PARD polarity complex [11, 12] that has a pivotal role in mitotic spindle orientation [7, 10, 29, 37], organization of epithelial architecture and tissue homeostasis [38]. PTEN regulates spindle orientation in nonpolarized cultured cells [13] and in this study we show PTEN regulation of spindle alignment in polarized Caco-2 cells during formation of simple colorectal glandular structures. Conversely, PTEN-deficiency induced spindle misorientation, epithelial stratification, apical membrane misalignment and formation of multiple abnormal lumens characteristic of cribriform morphology (CM). Furthermore, development of CM in Caco-2 ShPTEN glands associated with increased gland cellularity and size, in accord with loss of PTEN antiproliferative activity [39]. SiRNA knockdown of PTEN also induced cribriform architecture in a different CRC cell type (SK-CO-15) that has the capacity for 3D organotypic growth [40]. Our findings thus provide a mechanistic template for PTEN regulation of mitotic spindle alignment, growth of simple or stratified epithelium, AM dynamics and organization of colorectal multicellular architecture.
Downstream of PTEN, the CDC42-PRKCZ-PARD apical complex [11] tightly orchestrates spindle dynamics [9] and cell polarization [10]. PARD3 is essential for recruitment of PRKCZ to the apical surface, formation of the PARD3-PRKCZ-PARD6 complex and for CDC42 activation of PRKCZ [38]. These molecular interactions are implicated in multiple processes of epithelial organization [10]. Robust functional readouts of apical PRKCZ activity are provided by signal intensities of phospho-PRKCZ [9] or SLC9A3R1 [36] at the apical domain. In this study, high apical p-PRKCZ or SLC9A3R1 intensities in wt Caco-2 glands associated with appropriate subapical PARD3 localization, correct spindle alignment and regular gland morphology. Conversely in PTEN-deficient Caco-2 ShPTEN glands, we found reduced apical p-PRKCZ and SLC9A3R1 intensities, PARD3 mislocalization, spindle misalignment and aberrant multicellular glandular architecture. Hence, PTEN regulates components of the CDC42/PRKCZ/PARD apical polarity complex to control spindle orientation and 3D gland morphology.
Spindle microtubule regulatory kinases are controlled by nuclear PTEN [41] and nuclear import of PTEN is Ca2+-dependent [42]. Because 1,25(OH)2D3 may enhance PTEN expression [16] and promotes rapid Ca2+ signalling in a VDR-dependent manner [18], we tested effects of this secosteroid upon spindle regulatory machinery and gland morphology. 1,25(OH)2D3 upregulated VDR expression and enhanced VDR nuclear localization in Caco-2 and Caco-2 ShPTEN cells, indicating Vit-D responsiveness of the model system. In Caco-2 ShPTEN cells, 1,25(OH)2D3 treatment enhanced PTEN expression, increased CDC42-GTP levels, enhanced apical p-PRKCZ intensity and restored mitotic spindle orientation to levels comparable with wt Caco-2 cultures. 1,25(OH)2D3 treatment suppressed CM by restoring formation of epithelial monolayers and single lumens in Caco-2 ShPTEN glands for the total sustainable interval of 3D culture growth (20 days). Conversely, cessation of 1,25(OH)2D3 treatment enabled rapid reappearance of CM. Vit-D has antiproliferative properties [43] and in this study, 1,25(OH)2D3 treatment also suppressed Caco-2 ShPTEN gland cellularity. While previous studies of 1,25(OH)2D3 regulation of cribriform morphology are lacking, this secosteroid has been shown previously to suppress epithelial stratification in a human epidermis culture model [24] and promoted a symmetrical, circular shape of MCF10DCIS mammospheres [23].
The PTEN/CDC42-PRKCZ-PARD apical complex regulates a repertoire of morphogenic processes [10, 11, 29, 38]. We functionally dissected this signal transduction cascade to identify principal 1,25(OH)2D3-dependent effectors. While 1,25(OH)2D3 upregulated PTEN, it also rapidly activated CDC42 by PTEN-independent mechanisms and enhanced apical p-PRKCZ and SLC9A3R1 signal intensities. Disruption of Caco-2 glandular morphogenesis by DN CDC42 transfection or treatment with an allosteric PRKCZ pseudosubstrate inhibitor (PRKCZ I), as described previously [7, 29, 36], could not be reversed by 1,25(OH)2D3. Furthermore, restorative effects of 1,25(OH)2D3 on Caco-2 ShPTEN gland morphology were blocked by PRKCZI treatment. Collectively, these findings implicate CDC42 and/or PRKCZ signalling in 1,25(OH)2D3 regulation of gland morphology.
Mitotic spindle machinery is governed in part by steroid hormone signalling [44]. 1,25(OH)2D3 is a multipotent secosteroid that regulates gene transcription and also induces rapid Ca2+ flux through L-type voltage-dependent Ca2+ channels (LTVDCCs) [31] and CaM-KII mediated release of Ca2+ from intracellular stores [32]. Ca2+ flux and CaM-KII signalling initiate juxtamembrane signal transduction [45], activate CDC42 [19, 20] and modulate microtubule dynamics [21]. In this study, 1,25(OH)2D3 treatment enhanced intracellular Ca2+ concentration in Caco-2 cells that expressed LTVDCCs in basolateral membranes, as previously described [46]. 1,25(OH)2D3 treatment upregulated CDC42 activity within minutes but took up to 24 hrs to enhance PTEN expression in Caco-2 cells. Furthermore, 1,25(OH)2D3 treatment upregulated CDC42-GTP in both PTEN +/+ and PTEN -/- HCT116 colorectal cells. SiRNA VDR knockdown, blockade of LTVDCCs by NF treatment or inhibition of CaM-KII by KN-93 all suppressed 1,25(OH)2D3-mediated activation of CDC42. SiRNA knockdown of VDR or treatment with NF or KN-93 also blocked 1,25(OH)2D3-mediated activation of CDC42 and reversal of CM in Caco-2 ShPTEN glands. Taken together, these data implicate VDR, LTVDCC - and CaM-KII -mediated Ca2+ flux in Vit-D control of multicellular morphology, through CDC42/PRKCZ signalling.
Because mutant KRAS can impede Vit-D growth control [27, 47] and can modulate VDR signalling [29], we investigated its effects on 1,25(OH)2D3 pro-morphogenic activity. Transfection of KRAS wt Caco-2 cells [48, 49], with mutationally-activated KRAS V12 suppressed uniform localization of active PRKCZ at the apical membrane interface and induced formation of solid, cell-filled Caco-2 glands that lack a central lumen, as previously reported [33]. Furthermore, KRAS V12 antagonized 1,25(OH)2D3 rescue of Caco-2 ShPTEN gland morphology. Hence, mutationally-activated KRAS impedes PRKCZ apical localization, disrupts CRC multicellular architecture and inhibits Vit-D promorphogenic activity, in 3D models.
To explore the translational relevance of our findings, we investigated tumor formation in an intestinal-epithelial specific PTEN-deficient murine model [34] and assessed polarity signalling against CM in 2 human CRC cohorts. In the murine model, small intestinal cancers driven purely by PTEN-deficiency [34] developed CM. These findings accord with previous reports of CM in various cancers of PTEN-haploinsufficient mice [50]. In human studies of cohort (i), we found CM on low power microscopy in 54% CRCs and heterogenous CM distribution whole tumor sections. Because PTEN deficiency and mutationally-activated KRAS can synergistically co-regulate tumor morphology in transgenic mice [51], we studied a larger series of 92 KRAS genotyped CRCs (cohort ii) and found CM on low power microscopy in 43% CRCs. CM associated with grade I and II CRCs in both cohorts, consistent with an early transition state during a trajectory of CRC dedifferentiation. In accord with previous findings [52], we found no relationship between PTEN expression and KRAS mutational status in human CRC. However, PTEN RNA directly associated with CM in KRAS wt tumors but not in the KRAS mutant CRC subgroup, nor in the total CRC series of cohort (ii). These findings suggest that PTEN-KRAS epistatic interactions may influence human CRC morphology.
Downstream of PTEN, apical PRKCZ represents a central morphogenic effector within the apical polarity complex [11, 36]. Apical SLC9A3R1 intensity provides a robust readout of apical PRKCZ activity in 3D models [36] and can be reliably assessed in human formalin-fixed paraffin embedded (FFPE) colorectal specimens [36,53]. In cohort (ii) human CRCs, we found positive correlations between PTEN RNAscope, PTEN IHC and apical SLC9A3R1 IHC intensity. We and others have shown that apical SLC9A3R1 intensity [36, 53] and PTEN expression [54, 55] are substantively higher in normal colonic mucosa than in CRC [36, 53-55]. In CRCs of the present study, we found higher expression of apical SLC9A3R1 intensity in cribriform as opposed to non-cribriform CRCs, consistent with CM as an early or intermediate stage in a trajectory of cancer dedifferentiation. A similar rationale may explain the higher PTEN RNA expression in cribriform CRC than in non-cribriform KRAS wt CRCs.
Compelling experimental, epidemiological and clinical data show that Vit-D controls inception and progression of CRC [25, 26]. However, there is a fundamental gap between discovery of Vit-D anticancer activity and identification of mechanistic biomarkers needed to exploit its full clinical potential. Strikingly, our findings show that 1,25(OH)2D3 controls subcellular, cellular and multicellular scales of tissue assembly to suppress CM. Hence, 1,25(OH)2D3 anticancer effects may be mediated in part by Ca2+/CaM-KII-dependent reprogramming of polarization machinery to suppress oncogenic disruption of homeostatic multicellular architecture. Our study shows that KRAS mutation indicates Vit-D-resistance. Conversely, apical SLC9A3R1 intensity provides readout of PRKCZ [36] a key morphogenic effector of the PTEN/CDC42/PRKCZ pathway [11], has prognostic relevance in human CRC and predicts 1,25(OH)2D3 control of gland morphology. Apical SLC9A3R1 intensity is suppressed by mutationally-activated KRAS in 3D models and associates with CM in both KRAS mutant and wt human CRCs.
Globally, cancer affects over 12 million new patients each year [56]. Cancer morphology has been a gold-standard for diagnosis and outcome prediction since the time of Virchow [57] but has remained a mechanistic “black box” with few advances and almost no literature exploring its pathobiology. Our MS now untangles the molecular framework of cribriform morphology in 3D CRC models, shows Vit-D suppression of CM evolution via core polarization machinery and conducts translational and clinical studies that support model predictions. We also identify biomarkers of Vit-D resistance (KRAS mutation) and promorphogenic effects (apical SLC9A3R1) for use in future clinical trials.
Materials and methods
Reagents and antibodies
Laboratory chemicals were purchased from Sigma-Aldrich, Dorset, England unless otherwise stated. Antibodies included mouse anti-PTEN (Cell Signaling, Danvers, MA, USA and Dako anti-PTEN clone 6H2.1), mouse anti-SLC9A3R1, Lifespan Biosciences, Seattle, WA, USA), anti-CDC42 and anti-CTNNB1 (also known as β-catenin - Cell Signaling, Danvers, MA, USA), anti-CaV1.3 antibody against the α subunit of LTVDCCs [58], anti-GAPDH (glyceraldehyde-3-phosphate dehydrogenase (ab8245); anti-VDR (ab54373) and rabbit anti-phospho-PRKCZ [Thr 560] (all from Abcam Cambridge, MA, USA). For confocal microscopy, primary antibodies were used in conjunction with Alexa Fluor 568 (anti-rabbit) and Alexa Fluor 488 (anti-mouse; Molecular probes, Invitrogen, Carslbas, CA, USA).
Cell lines
Stable PTEN-deficient Caco-2 ShPTEN cells were generated by transfection of parental Caco-2 cells with replication-defective retroviral vectors encoding PTEN short hairpin RNA (shRNA), using the Phoenix™ retroviral expression system (Orbigen, San Diego, CA USA), as previously described [12, 36]. Transient SiRNA PTEN knockdown was conducted in SK-CO-15 colorectal cells (gift from Dr F Real, Madrid) that have the capacity for 3D organotypic growth [40]. PTEN +/+ and PTEN -/- HCT116 cells were used in signalling assays, as previously described [59]. Caco-2 clones and SK-CO-15 cells were propagated in two-dimensional (2D) cell culture flasks in MEM (modified Eagle’s medium) supplemented with 10% FCS, 1mM non- essential amino acids and 1mM L-glutamine at 37°C in 5% CO2. PTEN +/+ and PTEN -/- HCT116 cells were cultured in McCoys 5A media supplemented with 10% FCS, 1mM L-glutamine and 1mM sodium pyruvate, as previously described [12, 36].
Three-dimensional (3D) cultures
Development of multicellular architecture was assessed in PTEN-expressing Caco-2, PTEN-deficient Caco-2 ShPTEN cells, parental PTEN-expressing SK-CO-15 cells and a subclone rendered PTEN-deficient by SiRNA knockdown, in organotypic cultures. Cells were cultured and embedded in Matrigel matrix (BD Biosciences, Oxford, UK), then imaged by confocal microscopy during progressive development of multicellular glandular architecture, as previously described [12, 36]. SK-CO-15 cells express apical membrane markers at low level [60] and apical SLC9A3R1, PRKCZ or p-PRKCZ were undetected in these cells, in this study. Cribriform morphology (CM) was defined as multiple aberrant lumens surrounded by abnormal stratified epithelium in 3D multicellular structures in culture and in tumors [6]. Effects of transfections or treatments on glandular morphology of 3D cultures were assessed against endpoints of CM or individual features of epithelial configuration (columnar or stratified) or single central lumen formation.
Transfections and treatments
Caco-2 and/or Caco-2ShPTEN 3D cultures were transfected with mutant CDC42 constructs, as previously described [12, 36] and/or treated by 1,25(OH)2 D3 (10-7M), inhibitors of L-type calcium channels (nifedipine) [61], calcium calmodulin-dependent protein kinase II (CaMKII) [KN-93] [62] or a myristoylated PRKCZ pseudosubstrate peptide containing a membrane-targeting myristoylation tag that functions as an effective PRKCZ pseudosubstrate inhibitor (PRKCZI) [63].
Intestinal-epithelial specific PTEN-deficient murine model
All animal procedures were conducted in accordance with local and national regulations. Mice were generated, housed, and genotyped, and Cre activity was induced as previously described [34]. A total of 30 Ah::CreERTT+/0;PtenF/F mice and 29 Ah::CreERTT+/0;Pten+/+ mice were enrolled into cohorts for prolonged follow up. Tissues were harvested, fixed, and processed according to standard protocols, as previously described. [34].Animals were monitored closely for symptoms of disease, and were then necropsied as previously described [34]. The morphology of tumors arising in PTEN-deficient murine intestinal epithelium was assessed by H&E histology. Cribriform morphology was assayed as previously defined [6].
Human colorectal cancer studies
We conducted 2 separate studies of polarity signalling against cribriform morphology (CM) in human colorectal cancer (CRC). We used anonymised formalin fixed, paraffin embedded (FFPE) samples from (i) 35 patients with non-genotyped CRCs and (ii) 92 patients with KRAS-genotyped CRCs. We assessed CM at low power microscopy according to previously defined criteria [6] in both study cohorts. To assess CM heterogeneity, we scored CM in 40 fields per tumor at 20x magnification across whole tumor sections in cohort (i). Scores of 0, 1 and 2 were given for CM involvement of < 10%, 11-50% and > 50% CRC epithelium per field. In cohort (ii), specimens were arranged in tissue microarrays (TMAs). To assess polarity signalling in CRC FFPE specimens, we assessed PTEN RNA expression by RNAscope in situ hybridization [35]. We assessed apical SLC9A3R1 intensity by immunohistochemistry (IHC) as readout of apical PRKCZ activity as outlined previously [36], in FFPE specimens of both study cohorts. To assess PTEN protein expression, PTEN IHC was also assessed in cohort (ii) TMAs. Samples used in this research were released from the Northern Ireland Biobank (NIB13-0090), approved by the Office of Research Ethics Committees Northern Ireland (Reference number 11/NI/0013/-/NIB13-0090).
Data analysis
Descriptive statistics were expressed as the mean ± sem. Statistical analyses were by one or two-way ANOVA or Student’s t test using SPSS for Windows release 22.0 (IBM Corp, NY, USA) or Graphpad Prism software (v4.02; Graphpad CA 92037 USA). Scatterplots and bar charts were used for display of quantitative numerical or categorical data. PTEN RNA values were log transformed to provide a normal distribution.
Acknowledgments
We thank Dr Todd Waldman (Georgetown Q34 University) for supply of PTEN +/+ and −/− HCT116 cells, Dr Francisco Real, Madrid for supply of SK-CO-15 cells, to Dr C Eng and Dr T Plesec, Cleveland Clinic Ohio for helpful discussions about Cowden’s tumors, Dr Stephen McQuaid and Victoria Bingham, Northern Ireland Biobank for assistance with IHC and PTEN RNAscope assays.
Financial support
We gratefully acknowledge Cancer Research UK (Grant Number C9136/A15342) and the Tom Simms Memorial Bequest to FCC. The Northern Ireland Biobank (NIB) released study human tissue samples is funded by HSC Research and Development Division of the Northern Ireland Public Health Agency and Cancer Research UK through the Belfast CR- UK Centre and the Northern Ireland Experimental Cancer Medicine Centre; additional support was from the Friends of the Cancer Centre. The Northern Ireland Molecular Pathology Laboratory created NIB resources has been funded by Cancer Research UK, the Friends of the Cancer Centre and the Sean Crummey Foundation.
Conflicts of Interest
None.
Authors’ contributors
RKD conducted 3D cultures and confocal microscopy. JMcC, RH and MBL conducted histopathology analyses. KMcC conducted Ca2+ imaging studies. AF and DT conducted transfections. AJ carried out Westerns. VMD, MJ and AC conducted mouse studies. FCC was overall coordinator.
Editorial note
This paper has been accepted based in part on peer-review conducted by another journal and the authors’ response and revisions as well as expedited peer-review in Oncotarget.
References
1. Cagan RL and Aguirre-Ghiso JA. A local view of cancer. Dev Cell. 2012; 22:472-474.
2. Hanahan D and Weinberg RA. Hallmarks of cancer: the next generation. Cell. 2011; 144:646-674.
3. Dixon MF. Gastrointestinal epithelial neoplasia: Vienna revisited. Gut. 2002; 51:130-131.
4. Brown IS, Bettington ML, Bettington A, Miller G and Rosty C. Adverse histological features in malignant colorectal polyps: a contemporary series of 239 cases. J Clin Pathol. 2016; 69:292-9.
5. Egashira Y, Yoshida T, Hirata I, Hamamoto N, Akutagawa H, Takeshita A, Noda N, Kurisu Y and Shibayama Y. Analysis of pathological risk factors for lymph node metastasis of submucosal invasive colon cancer. Mod Pathol. 2004; 17:503-511.
6. Fletcher C. (2013). Chapter 9 Tumors of the Small and Large Intestines, Including Anal Canal Diagnostic histopathology; Fourth Edition (Boston: Elsevier).
7. Jaffe AB, Kaji N, Durgan J and Hall A. Cdc42 controls spindle orientation to position the apical surface during epithelial morphogenesis. J Cell Biol. 2008; 183:625-633.
8. Lechler T and Fuchs E. Asymmetric cell divisions promote stratification and differentiation of mammalian skin. Nature. 2005; 437:275-280.
9. Durgan J, Kaji N, Jin D and Hall A. Par6B and atypical PKC regulate mitotic spindle orientation during epithelial morphogenesis. J Biol Chem. 2011; 286:12461-12474.
10. Rodriguez-Boulan E and Macara IG. Organization and execution of the epithelial polarity programme. Nat Rev Mol Cell Biol. 2014; 15:225-242.
11. Martin-Belmonte F, Gassama A, Datta A, Yu W, Rescher U, Gerke V and Mostov K. PTEN-mediated apical segregation of phosphoinositides controls epithelial morphogenesis through Cdc42. Cell. 2007; 128:383-397.
12. Jagan I, Fatehullah A, Deevi RK, Bingham V and Campbell FC. Rescue of glandular dysmorphogenesis in PTEN-deficient colorectal cancer epithelium by PPARgamma-targeted therapy. Oncogene. 2013; 32:1305-1315.
13. Toyoshima F, Matsumura S, Morimoto H, Mitsushima M and Nishida E. PtdIns(3,4,5)P3 regulates spindle orientation in adherent cells. Dev Cell. 2007; 13:796-811.
14. Williams SE, Ratliff LA, Postiglione MP, Knoblich JA and Fuchs E. Par3-mInsc and Galphai3 cooperate to promote oriented epidermal cell divisions through LGN. Nat Cell Biol. 2014; 16:758-769.
15. Nakajima Y, Meyer EJ, Kroesen A, McKinney SA and Gibson MC. Epithelial junctions maintain tissue architecture by directing planar spindle orientation. Nature. 2013; 500:359-362.
16. Pan L, Matloob AF, Du J, Pan H, Dong Z, Zhao J, Feng Y, Zhong Y, Huang B and Lu J. Vitamin D stimulates apoptosis in gastric cancer cells in synergy with trichostatin A /sodium butyrate-induced and 5-aza-2’-deoxycytidine-induced PTEN upregulation. Febs J. 2010; 277:989-999.
17. Sylvia VL, Schwartz Z, Ellis EB, Helm SH, Gomez R, Dean DD and Boyan BD. Nongenomic regulation of protein kinase C isoforms by the vitamin D metabolites 1 alpha,25-(OH)2D3 and 24R,25-(OH)2D3. J Cell Physiol. 1996; 167:380-393.
18. Ordonez-Moran P, Larriba MJ, Palmer HG, Valero RA, Barbachano A, Dunach M, de Herreros AG, Villalobos C, Berciano MT, Lafarga M and Munoz A. RhoA-ROCK and p38MAPK-MSK1 mediate vitamin D effects on gene expression, phenotype, and Wnt pathway in colon cancer cells. J Cell Biol. 2008; 183:697-710.
19. Kholmanskikh SS, Koeller HB, Wynshaw-Boris A, Gomez T, Letourneau PC and Ross ME. Calcium-dependent interaction of Lis1 with IQGAP1 and Cdc42 promotes neuronal motility. Nat Neurosci. 2006; 9:50-57.
20. Murakoshi H, Wang H and Yasuda R. Local, persistent activation of Rho GTPases during plasticity of single dendritic spines. Nature. 2011; 472:100-104.
21. Rauh NR, Schmidt A, Bormann J, Nigg EA and Mayer TU. Calcium triggers exit from meiosis II by targeting the APC/C inhibitor XErp1 for degradation. Nature. 2005; 437:1048-1052.
22. Brackman D, Trydal T, Lillehaug JR and Aarskog D. Reorganization of the cytoskeleton and morphological changes induced by 1,25-dihydroxyvitamin D3 in C3H/10T1/2 mouse embryo fibroblasts: relation to inhibition of proliferation. Exp Cell Res. 1992; 201:485-493.
23. Wahler J, So JY, Cheng LC, Maehr H, Uskokovic M and Suh N. Vitamin D compounds reduce mammosphere formation and decrease expression of putative stem cell markers in breast cancer. J Steroid Biochem Mol Biol. 2015; 148:148-155.
24. Regnier M and Darmon M. 1,25-Dihydroxyvitamin D3 stimulates specifically the last steps of epidermal differentiation of cultured human keratinocytes. Differentiation. 1991; 47:173-188.
25. Freedman DM, Looker AC, Chang SC and Graubard BI. Prospective study of serum vitamin D and cancer mortality in the United States. J Natl Cancer Inst. 2007; 99:1594-1602.
26. Zgaga L, Theodoratou E, Farrington SM, Din FV, Ooi LY, Glodzik D, Johnston S, Tenesa A, Campbell H and Dunlop MG. Plasma vitamin D concentration influences survival outcome after a diagnosis of colorectal cancer. J Clin Oncol. 2014; 32:2430-2439.
27. Zhang Z, Kovalenko P, Cui M, Desmet M, Clinton SK and Fleet JC. Constitutive activation of the mitogen-activated protein kinase pathway impairs vitamin D signaling in human prostate epithelial cells. J Cell Physiol. 2010; 224:433-442.
28. Zhang Q, Kanterewicz B, Shoemaker S, Hu Q, Liu S, Atwood K and Hershberger P. Differential response to 1alpha,25-dihydroxyvitamin D3 (1alpha,25(OH)2D3) in non-small cell lung cancer cells with distinct oncogene mutations. J Steroid Biochem Mol Biol. 2013; 136:264-270.
29. Qin Y, Meisen WH, Hao Y and Macara IG. Tuba, a Cdc42 GEF, is required for polarized spindle orientation during epithelial cyst formation. J Cell Biol. 2010; 189:661-669.
30. Morais-de-Sa E, Mirouse V and St Johnston D. aPKC phosphorylation of Bazooka defines the apical/lateral border in Drosophila epithelial cells. Cell. 2010; 141:509-523.
31. Sitrin MD, Bissonnette M, Bolt MJ, Wali R, Khare S, Scaglione-Sewell B, Skarosi S and Brasitus TA. Rapid effects of 1,25(OH)2 vitamin D3 on signal transduction systems in colonic cells. Steroids. 1999; 64(1-2):137-142.
32. Vazquez G, de Boland AR and Boland RL. 1alpha,25-dihydroxy-vitamin-D3-induced store-operated Ca2+ influx in skeletal muscle cells. Modulation by phospholipase c, protein kinase c, and tyrosine kinases. J Biol Chem. 1998; 273:33954-33960.
33. Magudia K, Lahoz A and Hall A. K-Ras and B-Raf oncogenes inhibit colon epithelial polarity establishment through up-regulation of c-myc. J Cell Biol. 2012; 198:185-194.
34. Marsh Durban V, Jansen M, Davies EJ, Morsink FH, Offerhaus GJ and Clarke AR. Epithelial-specific loss of PTEN results in colorectal juvenile polyp formation and invasive cancer. Am J Pathol. 2014; 184:86-91.
35. Wang F, Flanagan J, Su N, Wang LC, Bui S, Nielson A, Wu X, Vo HT, Ma XJ and Luo Y. RNAscope: a novel in situ RNA analysis platform for formalin-fixed, paraffin-embedded tissues. J Mol Diagn. 2012; 14:22-29.
36. Jagan IC, Deevi RK, Fatehullah A, Topley R, Eves J, Stevenson M, Loughrey M, Arthur K and Campbell FC. PTEN phosphatase-independent maintenance of glandular morphology in a predictive colorectal cancer model system. Neoplasia. 2013; 15:1218-1230.
37. Zheng Z, Zhu H, Wan Q, Liu J, Xiao Z, Siderovski DP and Du Q. LGN regulates mitotic spindle orientation during epithelial morphogenesis. J Cell Biol. 2010; 189:275-288.
38. McCaffrey LM, Montalbano J, Mihai C and Macara IG. Loss of the Par3 polarity protein promotes breast tumorigenesis and metastasis. Cancer Cell. 2012; 22:601-614.
39. Saito Y, Swanson X, Mhashilkar AM, Oida Y, Schrock R, Branch CD, Chada S, Zumstein L and Ramesh R. Adenovirus-mediated transfer of the PTEN gene inhibits human colorectal cancer growth in vitro and in vivo. Gene Ther. 2003; 10:1961-1969.
40. Ivanov AI, Hopkins AM, Brown GT, Gerner-Smidt K, Babbin BA, Parkos CA and Nusrat A. Myosin II regulates the shape of three-dimensional intestinal epithelial cysts. J Cell Sci. 2008; 121:1803-1814.
41. Song MS, Carracedo A, Salmena L, Song SJ, Egia A, Malumbres M and Pandolfi PP. Nuclear PTEN regulates the APC-CDH1 tumor-suppressive complex in a phosphatase-independent manner. Cell. 2011; 144:187-199.
42. Minaguchi T, Waite KA and Eng C. Nuclear localization of PTEN is regulated by Ca(2+) through a tyrosil phosphorylation-independent conformational modification in major vault protein. Cancer Res. 2006; 66:11677-11682.
43. Thomas MG, Tebbutt S and Williamson RC. Vitamin D and its metabolites inhibit cell proliferation in human rectal mucosa and a colon cancer cell line. Gut. 1992; 33:1660-1663.
44. Corrigan AM, Shrestha RL, Zulkipli I, Hiroi N, Liu Y, Tamura N, Yang B, Patel J, Funahashi A, Donald A and Draviam VM. Automated tracking of mitotic spindle pole positions shows that LGN is required for spindle rotation but not orientation maintenance. Cell Cycle. 2013; 12:2643-2655.
45. Norman AW, Mizwicki MT and Norman DP. Steroid-hormone rapid actions, membrane receptors and a conformational ensemble model. Nat Rev Drug Discov. 2004; 3:27-41.
46. Brice NL and Dolphin AC. Differential plasma membrane targeting of voltage-dependent calcium channel subunits expressed in a polarized epithelial cell line. J Physiol. 1999; 515 ( Pt 3):685-694.
47. Desmet M and Fleet JC. The effect of activated-mitogen activated protein kinase (MAPK) activity on 1,25 dihydroxyvitamin D (1,25D)-mediated gene transcription in colon cancer cells. Faseb J. 2010; Supplement S212.6
48. Forbes SA, Bindal N, Bamford S, Cole C, Kok CY, Beare D, Jia M, Shepherd R, Leung K, Menzies A, Teague JW, Campbell PJ, Stratton MR and Futreal PA. COSMIC: mining complete cancer genomes in the Catalogue of Somatic Mutations in Cancer. Nucleic Acids Res. 2011; 39(Database issue):D945-950.
49. De Bosscher K, Hill CS and Nicolas FJ. Molecular and functional consequences of Smad4 C-terminal missense mutations in colorectal tumour cells. Biochem J. 2004; 379(Pt 1):209-216.
50. Stambolic V, Tsao MS, Macpherson D, Suzuki A, Chapman WB and Mak TW. High incidence of breast and endometrial neoplasia resembling human Cowden syndrome in pten+/- mice. Cancer Res. 2000; 60:3605-3611.
51. Davies EJ, Marsh Durban V, Meniel V, Williams GT and Clarke AR. PTEN loss and KRAS activation leads to the formation of serrated adenomas and metastatic carcinoma in the mouse intestine. J Pathol. 2014; 233:27-38.
52. Naguib A, Cooke JC, Happerfield L, Kerr L, Gay LJ, Luben RN, Ball RY, Mitrou PN, McTaggart A and Arends MJ. Alterations in PTEN and PIK3CA in colorectal cancers in the EPIC Norfolk study: associations with clinicopathological and dietary factors. BMC Cancer. 2011; 11:123.
53. Hayashi Y, Molina JR, Hamilton SR and Georgescu MM. NHERF1/EBP50 is a new marker in colorectal cancer. Neoplasia. 2010; 12:1013-1022.
54. Zhou XP, Loukola A, Salovaara R, Nystrom-Lahti M, Peltomaki P, de la Chapelle A, Aaltonen LA and Eng C. PTEN mutational spectra, expression levels, and subcellular localization in microsatellite stable and unstable colorectal cancers. Am J Pathol. 2002; 161:439-447.
55. Li XH, Zheng HC, Takahashi H, Masuda S, Yang XH and Takano Y. PTEN expression and mutation in colorectal carcinomas. Oncol Rep. 2009; 22:757-764.
56. Gulland A. Global cancer prevalence is growing at “alarming pace,” says WHO. Bmj. 2014; 348:g1338.
57. Virchow R. (1858). Die Cellularpathologie in ihrer Begrundung auf physiologische und pathologische Gewebelehre. In: Hirschwald A, ed. (Berlin).
58. Dolphin AC. Beta subunits of voltage-gated calcium channels. J Bioenerg Biomembr. 2003; 35:599-620.
59. Deevi R, Fatehullah A, Jagan I, Nagaraju M, Bingham V and Campbell FC. PTEN regulates colorectal epithelial apoptosis through Cdc42 signalling. Br J Cancer. 2011; 105:1313-1321.
60. Yoo BK, Yanda MK, No YR and Yun CC. Human intestinal epithelial cell line SK-CO15 is a new model system to study Na(+)/H(+) exchanger 3. Am J Physiol Gastrointest Liver Physiol. 2012; 303:G180-188.
61. Thongon N, Nakkrasae LI, Thongbunchoo J, Krishnamra N and Charoenphandhu N. Enhancement of calcium transport in Caco-2 monolayer through PKCzeta-dependent Cav1.3-mediated transcellular and rectifying paracellular pathways by prolactin. Am J Physiol Cell Physiol. 2009; 296:C1373-1382.
62. Tsukane M and Yamauchi T. Ca2+/calmodulin-dependent protein kinase II mediates apoptosis of P19 cells expressing human tau during neural differentiation with retinoic acid treatment. J Enzyme Inhib Med Chem. 2009; 24:365-371.
63. Standaert ML, Bandyopadhyay G, Kanoh Y, Sajan MP and Farese RV. Insulin and PIP3 activate PKC-zeta by mechanisms that are both dependent and independent of phosphorylation of activation loop (T410) and autophosphorylation (T560) sites. Biochemistry. 2001; 40:249-255.