
INTRODUCTION
Global incidence data for cancers of the lung, bronchus and trachea estimates the occurrence of >1.8 million new cases with >1.5 million deaths every year, worldwide [1]. In the United States, 2012 incidence data for non-small cell cancers of the lung and bronchus estimated the occurrence of 41.48/100,000 new cases with an annual death rate of 44.96/100,000 individuals. The 5-year relative survival was ~22% from 2005-2011, indicating that lung cancer remains as a leading cause of cancer death [2]. A new histopathological classification of lung cancer has been established, as treatment strategies for patients with advanced disease should rely on histology and tumor molecular genotyping. Among the two major histological types, Non-Small Cell Lung Cancer (NSCLC) comprise the majority (~85%) of cases and is divided into histological subtypes, the most common being adenocarcinoma. Invasive lung adenocarcinoma is further classified by histological subtyping analysis, to determine its predominant histological pattern of lepidic, acinar, papillary, micropapillary or solid; a micropapillary pattern has been associated with poor prognosis [3].
Advances in the treatment of patients with lung adenocarcinoma were made with the introduction of molecularly targeted approaches, such as the use of tyrosine-kinase inhibitors for patients with tumors containing activating, sensitizing EGFR mutations [4] and Crizotinib for ALK rearrangements [5]. Recent data from The Cancer Genome Atlas (TCGA) [6] and The Lung Cancer Mutation Consortium (LCMC) [7] demonstrated the importance of tumor genotyping in therapeutic decision for patients with lung adenocarcinoma. LCMC data showed that actionable mutations in genes such as EGFR, K-RAS, N-RAS, ALK, ERBB2, BRAF, PIK3CA, AKT, MEK1 and MET amplification, were found in >60% of lung adenocarcinomas and patients who received treatment guided by tumor genotyping lived longer compared to patients who did not receive targeted treatment [7]. Moreover, candidate driver mutations were found in TP53, KEAP1, NF1 and RIT1 in tumors lacking oncogene mutations [6]. Identification of genetic drivers is thus essential to establish efficient tumor genotyping at the diagnostic level, in order to tailor patient treatment.
Although several studies have identified driver mutations with a therapeutic role in lung adenocarcinoma, ~40% of such changes are yet unidentified [8-10]. As molecularly targeted approaches have benefited a fraction of patients with specific tumor histology classification and genetics, the need remains to identify new targets for further improving treatment decisions.
miRNAs are small, non-coding RNAs (~18-22 nucleotides) transcribed from DNA and with a role in gene expression regulation mainly leading to translational repression [11]. miRNAs play roles in multiple biological processes, such as embryonic development, cell proliferation and differentiation [11] and tumorigenesis, acting as oncogenes and tumor suppressor genes [12]. Deregulated miRNA expression has been associated with lung tumorigenesis [13-15]. To the best of our knowledge, ours is the first study on global transcriptome miRNA sequencing of lung adenocarcinoma from Brazilian patients, extending to validation in an independent sample set as well as across multiple high-throughput miRNA and gene expression datasets. By using stringent criteria on sample selection and data analysis, we were able to identify novel miRNAs that are deregulated exclusively in tumors and thus related to tumorigenesis.
RESULTS
Deregulated expression of miRNAs identified by miRNA-sequencing (miRNA-Seq)
miRNA-Seq generated 13,135,522 reads with an average of 547,313 reads/sample. FastQC quality test showed that 96.1% (12,623,236.642) of reads had a Q-score ≥30 and were thus considered for further analyses. Overall unpaired sample analysis showed that 11 miRNAs were statistically significantly (p ≤ 0.01 and FDR ≤ 0.1) deregulated, including miR-486 under-expression and let-7a-2, let-7g, miR-15b, miR-181b-1, miR-181b-2, miR-23b, miR-26a-1, miR-26a-2, miR-26b and miR-93 over-expression in the tumor compared to normal tissues. In addition, a paired-sample analysis (tumor and normal from same patients) showed that 22 miRNAs were statistically significantly deregulated (p ≤ 0.01; FDR ≤ 0.1); 8 miRNAs (miR-486, miR-1247, miR-218-1, miR-181a-1, miR-181a-2, miR-328, miR-574 and miR-886) were down-regulated and 14 miRNAs (let-7a-3, miR-146b, miR-26a-1, miR-200b, miR-191, miR-181c, miR-10a, miR-155, miR-99a, miR-30e, miR-21, miR-425, miR-29a and miR-421) were up-regulated in the tumor compared to the normal tissue from the same patient. Notably, deregulated expression of miR-486 and miR-26a-1 were detected in both analyses (unpaired and paired samples), considering filtering criteria of p ≤ 0.01 and FDR ≤ 0.1. Statistically significantly deregulated miRNAs identified in unpaired and paired samples are shown in Table 1.
Experimental design and data analysis steps are outlined in Figure 1.
Table 1: Deregulated miRNAs in lung adenocarcinoma compared to normal lung tissues in unpaired and paired sample analysis.
miRNA |
LogFC |
P-value |
FDR |
Unpaired samples |
|||
miR-486 |
-1.635 |
0.0004 |
0.0689 |
let-7g |
0.8879 |
0.0015 |
0.0689 |
miR-15b |
0.9831 |
0.0004 |
0.0689 |
miR-181b-2 |
0.9887 |
0.0009 |
0.0689 |
miR-23b |
0.9479 |
0.0014 |
0.0689 |
miR-26a-1 |
0.9756 |
0.0014 |
0.0689 |
miR-26a-2 |
0.9595 |
0.0013 |
0.0689 |
miR-26b |
1.0565 |
0.0009 |
0.0689 |
miR-93 |
1.203 |
0.0005 |
0.0689 |
let-7a-2 |
0.8844 |
0.0025 |
0.1052 |
miR-181b-1 |
0.9221 |
0.0027 |
0.1052 |
Paired samples |
|||
miR-486 |
-2.5430 |
8.8276E-12 |
1.805E-09 |
miR-1247 |
-2.6582 |
0.0003 |
0.0033 |
miR-218-1 |
-1.6175 |
0.0001 |
0.0043 |
miR-181a-2 |
-1.1145 |
0.0002 |
0.0079 |
miR-328 |
-1.4708 |
0.0004 |
0.0108 |
miR-181a-1 |
-1.1444 |
0.0006 |
0.0147 |
miR-574 |
-1.1719 |
0.0036 |
0.0503 |
miR-886 |
-1.3187 |
0.0046 |
0.0575 |
let-7a-3 |
0.4856 |
3.2638E-264 |
5.1692E-262 |
miR-146b |
0.7012 |
0.0005 |
0.0147 |
miR-26a-1 |
0.7382 |
0.0043 |
0.0551 |
miR-200b |
1.0898 |
0.0072 |
0.0864 |
miR-191 |
1.0935 |
0.0018 |
0.0307 |
miR-181c |
1.1230 |
0.0041 |
0.0551 |
miR-10a |
1.2858 |
0.0009 |
0.0208 |
miR-155 |
1.3089 |
0.0029 |
0.0418 |
miR-99a |
1.4447 |
0.0028 |
0.0418 |
miR-30e |
1.4926 |
0.00002 |
0.0011 |
miR-21 |
1.5219 |
0.0028 |
0.0418 |
miR-425 |
1.6206 |
0.0076 |
0.0005 |
miR-29a |
1.6488 |
0.0001 |
0.0043 |
miR-421 |
1.7648 |
0.0085 |
0.0993 |
LogFC = log (base 2)fold change; FDR = false discovery rate. FDR ≤ 0.1, p ≤ 0.01.
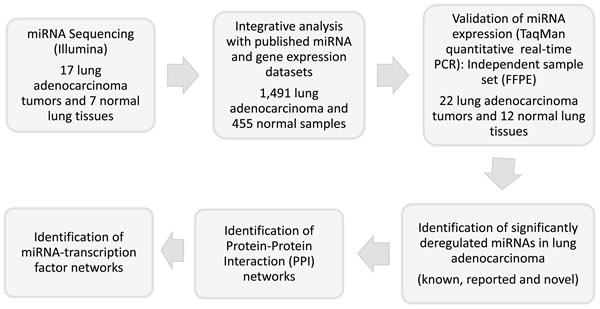
Figure 1: Experimental design.
Integrative analyses of our data with published datasets
Differentially expressed miRNAs identified herein were integrated with previously published datasets. We found deregulated miRNAs that were also consistently reported by previous studies (we refer to these as “known”): 2 over-expressed: miR-21, miR-191 and 2 under-expressed: miR-218 and miR-486. Additionally, we identified deregulated miRNAs that were previously reported by at least one study (we refer to these as “reported”): 5 over-expressed: let-7g, miR-93, miR-155, miR-200b and miR-425, and 1 under-expressed: miR-328. The remaining deregulated miRNAs we identified have not been previously reported in lung adenocarcinoma compared to normal lung tissue (we refer to these as “novel”): 13 over-expressed: let-7a, miR-10a, miR-15b, miR-23b, miR-26a, miR-26b, miR-29a, miR-30e, miR-99a, miR-146b, miR-181b, miR-181c, miR-421 and 3 under-expressed: miR-181a, miR-574 and miR-1247. Statistical significance of overlap between our findings and consistently appearing miRNA reports was evaluated by hypergeometric test, resulting in p = 7.46E-5 and p = 1.48E-6 for over- and under-expressed miRNAs, respectively.
miRNA-gene targets network
Next, we analyzed deregulated miRNAs and validated consistency of differential expression of their targets. Comparison of our data with multiple publicly available gene expression datasets allowed us to identify consistently deregulated genes in lung adenocarcinoma compared to normal lung tissues. We then assembled an interaction network between deregulated miRNAs and their target genes, including transcription factors participating on these interactions. We then analyzed statistical significance of enrichment of the downstream/upstream neighborhoods of order 2 (n2down/n2up) of deregulated miRNAs/genes by deregulated genes/miRNAs. Since miRNAs act mainly as inhibitors, for down-regulated miRNAs only up-regulated genes were taken into consideration and for up-regulated miRNAs only down-regulated genes were considered.
Recently, it has been shown that biological pathways, or Gene Ontology (GO) terms may be falsely identified as significantly enriched even by target genes of randomly selected miRNAs [16, 17]. This effect originates from knowledge bias, due to which miRNA-target pairs are discovered (e.g. computationally predicted) with a higher rate if the miRNA or target gene is known to be associated with specific biological processes (e.g. cell cycle) or diseases (e.g. cancer). Therefore, the rates of false positive and false negative (missing) miRNA-target predictions are not distributed equally among the genes/miRNAs and depend on their biological properties, leading to accumulation of false predictions within certain biological contexts [16]. We assume that this problem is not affecting the results of the two enrichment analyses described above, since rates of false predictions are presumably equal among the deregulated vs. non-deregulated miRNAs/target genes, which were identified experimentally and validated in independent sample cohorts.
We identified 11 miRNAs whose n2down is significantly enriched (p < 0.05) by deregulated genes; deregulation of these miRNAs may play an important role in lung adenocarcinoma, leading to gene expression changes. Some of these miRNAs are consistently reported (miR-21, miR-191), or have been reported at least once (miR-200b, miR-93). The remaining miRNAs: miR-15b, miR-23b, miR-29a, miR-30e, miR-146b, miR-181c are novel. We have applied two thresholds for statistical significance in order to identify genes whose upstream neighborhood was significantly enriched by deregulated miRNAs. Interestingly, we identified 705 genes whose n2up was significantly enriched (p < 0.05) by deregulated miRNAs. Out of these 705 genes, we identified 148 genes whose n2up was significantly enriched (p < 0.001), involving at least two deregulated miRNAs. It is therefore reasonable to assume that deregulation of these 148 genes may be due to the differential expression of their regulating miRNAs. The list of 148 genes is provided in Supplementary Table S1. Next, in order to construct the physical protein-protein interaction PPI network (as described below), we enforced the presence of at least two deregulated miRNAs in the upstream neighborhood of each of the 148 genes.
Protein-protein interaction networks in lung adenocarcinoma, linking deregulated miRNA target genes
Using the 148 genes (miRNA-deregulated targets; Supplementary Table S1) we constructed the corresponding physical protein-protein network (see Methods). Resulting PPI network (Supplementary Figure S1) comprised 4,324 nodes, among which 469 (p = 0.036, random network generation) comprise a list of “prognostic genes”, which are genes derived from lung prognostic signatures, downloaded from Cancer Data Integration Portal (CDIP) database (http://ophid.utoronto.ca/cdip), and used earlier in [12]. We found that 58/148 genes were directly connected by PPIs (p = 0.044, random network generation), showing that miRNA-deregulated targets are tightly connected on the PPI level. These miRNAs are highly interconnected in the PPI networks, coordinating the expression of several different proteins (Supplementary Figure S2).
Validation of deregulated expression of novel and known miRNAs in lung adenocarcinoma
TaqMan PCR validation was performed for all significantly deregulated miRNAs in an independent set of 22 lung adenocarcinoma samples and 12 normal lung tissues. Fourteen miRNAs showed concordant levels of expression between miRNA-Seq and TaqMan PCR data (Table 2). 5/14 miRNAs were under-expressed (miR-486, miR-181a-1, miR-181a-2, miR-218-1 e miR-886) and 9 were over-expressed (let-7a-2, let-7a-3, let-7g, miR-15b, miR-26b, miR-200b, miR-155, miR-21, miR-425). 6/14 miRNAs; let-7a-2, let-7a-3, miR-15b, miR-200b, miR-155 and miR-21 were statistically significantly deregulated (p ≤ 0.01; FDR ≤ 0.1) in tumor compared to normal in both miRNA-Seq and TaqMan PCR analyses (Table 2).
Statistically significant correlations were identified between female gender and over-expression of let-7a-2 (p = 0.0062), let-7a-3 (p = 0.0052) and miR-15b (p = 0.0294). Over-expression of let-7a-2, let-7a-3 and miR-15b was associated with poorly differentiated tumors (p = 0.0245). Interestingly, miR-21 levels were higher in tumors from patients who died of disease compared to patients who are alive with disease (p = 0.042) (Figure 2).
Table 2: Deregulated miRNAs in both miRNA-Seq and TaqMan PCR analyses.
|
miRNA |
miRNA-Seq logFC |
P-value |
miRNA |
TLDA logFC |
P-value |
let-7a-2 |
0.8844 |
0.0025 |
let-7a |
2.3601 |
0.000* |
let-7a-3 |
0.4856 |
3.2638E-264 |
let-7a |
2.3601 |
0.000* |
miR-15b |
0.9831 |
0.0004 |
miR-15b |
2.4022 |
0.000* |
miR-200b |
1.0898 |
0.0072 |
miR-200b |
1.9404 |
0.000* |
miR-21 |
1.5219 |
0.0028 |
miR-21 |
2.6311 |
0.001* |
miR-155 |
1.3089 |
0.0029 |
miR-155 |
1.3294 |
0.010* |
miR-486 |
-1.635 |
0.0004 |
miR-486 |
-3.9434 |
0.084 |
miR-181a-1 |
-1.1444 |
0.0006 |
miR-181a |
-0.8625 |
0.140 |
miR-181a-2 |
-1.1145 |
0.0002 |
miR-181a |
-0.8625 |
0.140 |
let-7g |
0.8879 |
0.0015 |
let-7g |
0.3918 |
0.143 |
miR-26b |
1.0565 |
0.0009 |
miR-26b |
0.5597 |
0.224 |
miR-218-1 |
-1.6175 |
0.0001 |
miR-218 |
-1.4699 |
0.386 |
miR-886 |
-1.3187 |
0.0046 |
miR-886-3p |
-1.1746 |
0.482 |
miR-425 |
1.6206 |
0.0076 |
miR-425-5p |
0.1190 |
0.906 |
Test sample set: p ≤ 0.01 and FDR ≤ 0.1, as determined by EdgeR software.
Validation sample set: p ≤ 0.01 as determined by Expression Suite software.
*Statistically significantly deregulated miRNAs identified in both test and validation sets by transcriptome sequencing and TaqMan PCR analyses.
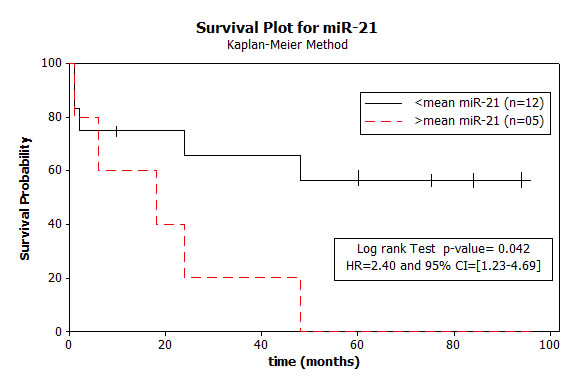
Figure 2: Kaplan-Meier survival analysis. Patients (training set) with tumors showing higher than average miR-21 expression levels had significantly poorer survival compared to patients who are alive.
DISCUSSION
Herein, by applying stringent criteria to our miRNA-Seq and TaqMan PCR analyses, we identified and validated deregulated expression of miRNAs let-7a-2, let-7a-3, miR-15b, miR-21, miR-155 and miR-200b in lung adenocarcinoma compared to histologically normal lung tissues. Integrative analyses of our results allowed us to identify consistently deregulated miRNAs in lung adenocarcinoma across different high-throughput published datasets. We identified deregulated miRNAs that have not been previously reported in lung adenocarcinoma. The identification of novel miRNAs was possible mainly due to the use of very stringent sample selection criteria, having at least 90% of tumor or normal cells in the tissues used for deep sequencing and validation analyses. Among the novel miRNAs, let-7a and miR-15b were identified and validated in an independent sample set. Deregulated miRNAs including novel, known and reported miRNAs (let-7a-2, let-7a-3, miR-15b, miR-21, miR-155 and miR-200b) act by silencing the expression of tumorigenesis-related genes.
Although validation data for other miRNAs was not statistically significant, both miRNA-Seq and TaqMan data showed concordant levels of miRNA expression in tumors compared to normal tissues. This lack of statistical significance may be due to differences in sample sources (fresh-frozen vs. formalin-fixed, paraffin embedded FFPE tissues) used for sequencing and validation analyses, respectively. FFPE tissues represent a valuable resource for cancer studies, as these samples can provide long-term patient follow-up, including information on treatment response and survival. Although formalin fixation causes nucleic acid degradation and cross linking of proteins to DNA, several studies reported useful and reproducible molecular genetic data using FFPE compared to frozen samples [18, 19]. This is likely due to improved RNA extraction protocols designed for FFPE tissues. Additionally, as miRNAs are small molecules and protected by the RISC complex, they are less susceptible to degradation [20, 21]. A previous study showed that the TaqMan Human MicroRNA Array platform is suitable for analysis of FFPE tissues with high reproducibility (r = 0.95 between duplicates, p < 1e-5) [22]. Therefore, proper use of both frozen and FFPE tissues and controls is an important sample resource to improve statistical power in discovery and validation studies.
Our results showed increased levels of let-7a variants (let-7a2 and let-7a3) in lung adenocarcinoma. As let-7 family of miRNAs (let-7a, b, c, d, e, f, g and i) has been reported as under-expressed and suggested to repress cancer cell growth and proliferation, including lung squamous cell carcinoma [23-25], it remains to be investigated whether increased expression levels of let-7 family could have a role in lung adenocarcinoma. Landi et al. [26] showed higher levels of let-7 family members in adenocarcinoma compared to squamous cell carcinoma subtype. Considering let-7 tumor suppressive functions, let-7 family members may influence mostly lung squamous cell carcinoma than adenocarcinoma. Additionally, differential expression levels of let-7 family distinguished lung adenocarcinoma from squamous cell carcinoma [26]. Our data confirmed that increased let-7a levels may be specific to the adenocarcinoma subtype.
miR-15b over-expression was detected in the blood of patients with NSCLC and deregulated expression of miR-15b and miR-27b, combined, was able to distinguish patients with NSCLC from healthy individuals [27]. Novel miRNAs identified herein, including let-7a and miR-15b were correlated with lung adenocarcinoma compared with lung squamous cell carcinoma. Interestingly, miR-15b/16-2 up-regulation was shown to activate genes involved in DNA repair pathways; PPM1D (WIP1; wild-type p53-induced phosphatase 1) was shown as a direct target of miR-15b, suggesting that DNA damage response by miR-15b may be partially modulated by PPM1D inhibition [28]. PPM1D encodes a serine/threonine phosphatase that plays a role in dephosphorylation of several DNA damage-response proteins such as ATM, ATR, p38MAPK, CHK1 and CHK2 [29]. MAPK and PI3K pathways activation was associated with known mutations in a small fraction of lung adenocarcinomas, suggesting other mechanisms of pathway activation during tumorigenesis [6], which could include post-transcriptional regulation by miRNAs.
Over-expression of miR-21 and mir-200b was detected in tumor and sputum of patients with early stage lung adenocarcinoma; a 4-miRNA signature (including miR-21 and miR-200b) distinguished patients with adenocarcinoma and squamous cell carcinoma from healthy individuals, with higher specificity and sensitivity for the adenocarcinoma subtype [30]. Interestingly, miR-21 over-expression and PTEN protein under-expression were associated with low sensibility to TKIs Gefitinib or Erlotinib and low survival of patients with NSCLC. Increased miR-21 and decreased PTEN expression was detected in Gefitinib-resistant cell lines with a reduced sensibility to Gefitinib due to PTEN inhibition and AKT/ERK activation while miR-21 inhibition was able to restore sensitivity to treatment [31]. We found that higher miR-21 levels were significantly associated with poorer patient survival. miR-21 has been identified as over-expressed in glioblastoma and to play a role in apoptosis, since suppression of miR-21 triggered activation of caspases 3 and 7 and increased programmed cell death in glioblastoma cells [32] thus demonstrating that miR-21 over-expression contributes to glioblastoma oncogenesis by silencing apoptosis-related genes.
miRNAs regulate pathways associated with disease progression and metastasis, such as TGF-β signaling, which activates transcription factors responsible for epithelial to mesenchymal transition (EMT). miR-200 family plays an important role in EMT through inhibition of CDH1, ZEB1 and ZEB2 (Zinc finger E-box binding homeobox) [33]. miR-200b over-expression inhibited the transcriptional repressor ZEB2 and CDH1 in breast carcinoma cells. ZEB2 cooperates with TGF-β signaling and EMT through CDH1 [34]. Although ZEB1/CDH1 are repressed by miR-200b, restoration of ZEB1 expression in breast cancer cells expressing miR-200b was unable to modify their metastatic potential, suggesting additional mechanisms underlying metastasis [35].
Wnt/β-catenin signaling has been associated with miR-155 in liposarcoma; CK1α (casein kinase 1α), a key regulator of Wnt/β-catenin pathway, is targeted by miR-155, leading to β-catenin signaling and CCND1 activation, cell proliferation and liposarcoma progression [36]. miR-155 up-regulation has been reported in lung adenocarcinoma [37], detected in serum from patients with advanced-stage (IV) NSCLC and associated with low patient survival [38]. miR-155 may be a potential therapeutic target in cancer, as in vitro and in vivo data showed efficient delivery of anti-miR-155 in a hepatocellular carcinoma cell line [39]. miRNAs control gene expression either directly [40] or indirectly by targeting its upstream transcription factors. We showed a complex miRNA-transcription factor regulatory network composed, in part, of novel, differentially expressed miRNAs (miR-15b, miR-23b, miR-29a, miR-30e, miR-146b, miR-181b, and miR-181c).
We identified 705 genes which have been consistently reported as deregulated in lung adenocarcinoma and whose upstream neighborhood was significantly enriched by differentially expressed miRNAs. Of these 705 genes, 148 genes may be deregulated due to the differential expression of their regulatory miRNAs, since these genes passed stringent statistical data analysis criteria. Notably, 48 of these 148 genes are found in lung cancer prognostic signatures identified through the Cancer Data Integration Portal (CDIP) database. Among the 19 transcription factors identified herein (EGR1, AP2C, FLI1, TAL1, GATA2, HMGA1, ERG, JUN, FOS, GCR, NFYA, TYY1, MEF2A, VDR, P63, JUND, NF2L2, HXA5 and EPAS1), HMGA1 (high mobility group AT-hook 1) chromatin remodeling protein is highly expressed in poorly differentiated, aggressive tumors (reviewed in [41]), and has been identified as a lung cancer prognostic gene [42]. Increased HMGA1 gene and protein expression was identified in NSCLC; HMGA1 protein over-expression was associated with disease stage, tumor grade, T category, nodal status and distant metastasis; patients with tumors over-expressing HMGA1 had lower survival [43] indicating that HMGA1 may have prognostic value in NSCLC.
miRNAs identified herein may be subjected to functional validation studies in order to assess their individual role in lung tumorigenesis. However, it is important to emphasize that functionality measures of individual miRNAs may be linked to the global functionality and coordinated actions of miRNA-regulated gene networks [44].
Our data corroborate known information on deregulated expression of miRNAs and identify novel deregulated miRNAs in lung adenocarcinoma. Novel miRNAs identified in tumors from Brazilian patients is a unique aspect of our study. Our data thus provide a distinctive and valuable contribution to the understanding of miRNA deregulation in lung adenocarcinoma. Our findings may lead to further clinical relevance by contributing to the development of novel therapeutic strategies for patients with lung adenocarcinoma.
MATERIALS AND METHODS
Ethics statement
This study was performed in accordance with the ethical standards and to the Declaration of Helsinki and according to national and international guidelines. Our study has been approved by the Research Ethics Boards of the Faculty of Medicine, UNESP, Botucatu, SP (4319/2012), AC Camargo Hospital, São Paulo, SP (1573/11) and Barretos Cancer Hospital, Barretos, SP (75907). Informed consent was obtained from all patients before sample collection.
Patient samples
Inclusion criteria were patients >18 years old, histopathological diagnosis of lung adenocarcinoma, untreated before surgery. Exclusion criteria were patients < 18 years old and with diagnosis of other diseases. Samples were selected as training and validation sets. Training set samples (N = 24) were prospectively collected from surgeries performed at AC Camargo Hospital, SP (N = 17 lung adenocarcinoma samples and 7 histologically normal lung tissues from same patients). Prospectively collected samples were immediately frozen in liquid nitrogen and kept at -80°C until RNA extraction. Validation set samples (N = 34) were retrospectively obtained (2000-2012) from the Pathology Department, Faculty of Medicine, UNESP, Botucatu, SP and Barretos Cancer Hospital, Barretos, SP. Validation set samples comprised FFPE tissue blocks from lung adenocarcinoma (N = 22) and histologically normal lung tissues from same patients (N = 12). We aimed at identifying global miRNA expression changes in lung adenocarcinoma through transcriptome sequencing followed by TaqMan quantitative real-time PCR validation. Table 3 shows the detailed clinical and histopathological data of patients.
Table 3: Clinical and histopathological data of patients (training and validation sets).
Variables |
Total Number (training) |
N (%) |
Total Number (validation) |
N (%) |
p-value |
Age (years) |
|
|
|||
Median (range) |
66.8 (43-83) |
|
58.0 (10-84) |
||
Mean |
65 |
|
60.5 |
0.30 |
|
Gender |
|
|
|||
Male |
8 |
47 |
12 |
55 |
|
Female |
9 |
53 |
10 |
45 |
0.64 |
Tobacco use |
|
||||
Yes |
10 |
59 |
15 |
68 |
|
No |
7 |
41 |
7 |
32 |
0.55 |
Alcohol use |
|
||||
Yes |
5 |
29 |
7 |
32 |
|
No |
12 |
71 |
15 |
68 |
0.87 |
Histology |
|
|
|||
Adenocarcinoma |
17 |
100 |
22 |
100 |
1.00 |
Tumor grade |
|
|
|||
Well differentiated |
2 |
12 |
1 |
4 |
|
Moderately differentiated |
11 |
65 |
14 |
64 |
|
Poorly differentiated |
4 |
23 |
7 |
32 |
0.64 |
T category |
|
|
|||
T1-T2 |
15 |
88 |
13 |
59 |
|
T3-T4 |
2 |
12 |
9 |
41 |
0.05 |
Nodal status |
|
|
|||
Negative (N0) |
12 |
71 |
11 |
50 |
|
Positive (N1, N2, N3) |
5 |
29 |
11 |
50 |
0.20 |
Distant metastasis |
|
|
|||
Yes |
4 |
24 |
2 |
9 |
|
No |
13 |
76 |
20 |
91 |
0.22 |
Tumor stage |
|
|
|||
Ia/Ib, IIa/IIb |
13 |
76 |
12 |
55 |
|
IIIa/IIIb, IV |
4 |
24 |
10 |
45 |
0.16 |
Outcome |
|
|
|||
Alive with disease |
7 |
42 |
10 |
45 |
|
Dead of disease |
10 |
58 |
12 |
55 |
0.79 |
There are no statistically significant differences between clinical characteristics of patients in the training and validation sets.
RNA extraction
Fresh-frozen tissues were subjected to frozen section analysis, performed by an expert lung pathologist (JD), in order to ensure the presence of >90% tumor or normal cells in samples collected by surgery. Fresh-frozen tissue samples were macrodissected, before RNA extraction, in order to isolate tumor or normal cells and samples were fragmented and lysed using the Precellys 24 lysing/homogenization system (Berting Technologies, Rockville, MD, USA) for 10s at 6,500 rpm. RNA extraction was performed using the miRNeasy Mini Kit (Qiagen, Hilden, Germany), following the manufacturer’s protocol. Samples obtained from FFPE tissue blocks were needle microdissected using the stereo microscope Leica EZ4 (Leica Microsystems, Wetzlar, Germany) before RNA extraction, in order to isolate the target tumor or normal cell populations. RNA from FFPE samples was isolated using the RecoverAll Total Nucleic Acid Isolation kit (Ambion/Life Technologies, Carlsbad, CA, USA), following a previously reported protocol with modifications to improve RNA yield [45]. RNA samples were quantified using NanoDrop 8000 (Thermo Fisher Scientific, Waltham, MA, USA) and quality was assessed using Bionalyzer 2100 (Agilent Technologies, Santa Clara, CA, USA), following the manufacturer´s protocol. RNA samples were stored at -80°C until use for library preparation.
miRNA transcriptome sequencing (miRNA-Seq) and bioinformatic data analysis
RNA (1µg) from training set samples (N = 24) was used for library preparation, cluster generation and miRNA-Seq using the MiSeq system (Illumina, San Diego, CA, USA) at the Laboratory of Biotechnology, University of São Paulo (USP), Piracicaba, SP. Sequencing comprised in vitro cloning of RNA fragments in a solid platform. MiSeq platform generated 50bp single-read fragments. Briefly, library preparation used the TruSeq Small RNA Sample Preparation kit (Illumina, San Diego, CA, USA); 1µg RNA was used for adaptor ligation, which contains a ligation site for the sequencing primer, used to identify samples comprising an RNA pool and another ligation site for the flow cell primers, which are used for fragment amplification by PCR. cDNA libraries were obtained by PCR amplification following 11 cycles of 98°C for 30s, 98°C for 10s; 60°C for 30s; 72°C for 15s and 72°C for 10 min. Libraries were subjected to agarose gel electrophoresis for miRNA isolation; cDNA samples were then ethanol precipitated and quantified using Qubit 2.0 Fluorometer (Invitrogen/Life Technologies, Carlsbad, CA, USA). In the clustering step, fragments ligated to adaptors were denatured for double strand separation, allowing single strand molecules to bind primers in the flow cell and to produce multiple copies of specific fragments by solid phase PCR amplification. Transcriptome sequencing was performed using the MiSeq Reagent Kit v2 (50 cycles). All steps followed the manufacturer´s instructions.
Data analysis included reads quality assessment using FastQC [46] and reads cleaning assessment by CutAdapt [47]. Reads alignment was performed based on hg19 reference genome (https://genome.ucsc.edu/cgi-bin/hgTracks?hgsid=12832096&chromInfoPage=) using Bowtie1 [48] followed by HT-Seq [49] for annotation and quantification of aligned sequences. Data normalization [50] and miRNA differential expression analysis were performed using edgeR (Bioconductor/R) v.3.0 [51-53].
Integrative bioinformatic analysis of published miRNA data sets
Our goal was to integrate our miRNA-Seq findings with miRNA expression changes in lung adenocarcinoma. We have summarized results of the 8 different studies comparing miRNA expression in lung adenocarcinoma and normal tissues [30, 37, 54-59] (Supplementary Table S2). Full text and (if applicable) Supplementary Data were carefully examined and miRNAs with significantly altered expression were extracted from each study. miRNA names were standardized according to the miRNA database miRBase (v.19) [60]. Based on data provided, all miRNAs were classified as either over- or under-expressed, and ranked according to reported statistical significance. Examining 8 studies we obtained 16 different rankings, 8 rankings for over- and 8 for under-expressed miRNAs. To identify consistently deregulated miRNAs, rankings were subjected to robust rank aggregation analysis implemented as R package RobustRankAggreg (v.1.1) [61]. This analysis detects miRNAs that are ranked consistently better than expected under null-model assuming that all studies are non-informative and input rankings thus contain only randomly ordered miRNAs. Using this analysis we assigned p-values as significance scores to each reported miRNA. The stability of resulting significance score was then assessed by the leave-one-out validation, in which the same analysis was repeated 8 times, each time excluding one of the rankings. Acquired p-values from each round were finally averaged into corrected p-value. Finally, miRNAs whose corrected p-value was less than 0.05 were further considered as consistently deregulated. Consistently reported miRNAs overlapping with those we identified herein, we referred to as “known”. miRNAs reported by at least one of the previous studies and overlapping with those we identified, we referred to as “reported”. miRNAs identified herein that were not reported by any of the studies are referred to as “novel”.
Integrative bioinformatic analysis of published gene expression data sets
We have analyzed 10 publicly available gene expression datasets [30, 62-69] and GSE31547 (Supplementary Table S3), from studies on primary human lung adenocarcinoma and containing at least one histologically normal tissue sample for comparison. To enable uniform processing and analysis and to improve comparability of results, we chose only datasets produced using Affymetrix platforms. Each dataset was first separately normalized and summarized using Bioconductor project’s package gcrma (GeneChip Robust Multiarray Averaging v.2.36.0) (http://watson.nci.nih.gov/bioc_mirror/packages/2.13/bioc/html/gcrma.html) [70]. For each individual dataset, we then evaluated differential gene expression using Bioconductor’s limma package (v.3.18.13) [71]. Based on expression fold change, genes were classified as either over- or under-expressed, and then ranked according to statistical significance, which was evaluated by q-value (adjusted p-value). Analyzing 10 datasets, we obtained 20 unique rankings, 10 for over- and 10 for under-expressed genes. To identify consistently deregulated genes, obtained rankings were subjected to the same robust rank aggregation analysis as described for miRNA expression datasets, including leave-one-out cross-validation of the results. Genes with p < 0.05 were considered as consistently deregulated.
miRNA-transcription factor (TF) regulatory network
To identify targets of differentially expressed miRNAs and relationships among them, we integrated data from multiple independent sources into miRNA-TF regulatory interactions. Knowledge of human TFs and their respective targets were obtained from four different databases, namely: ChEA (ChIP Enrichment Analysis) [72], ITFP (Integrated Transcription Factor Platform) [73], PAZAR [74], and TRED (Transcriptional Regulatory Element Database) [75]. These data were either downloaded as flat files (ITFP, PAZAR), manually collected (ITFP), or acquired from the web-based interactive application (ChEA). Additional data were obtained from TF:target pairs from human fetal lung [76]. Names of TFs and their respective targets as obtained from these databases were first standardized according to HGNC symbol checker (HUGO Gene Nomenclature Committee; http://www.genenames.org/cgi-bin/symbol_checker) and then concatenated into a single list comprising all the unique TF:target pairs. Those appearing in at least two sources were kept for further analysis, while the remaining ones were removed. We used mirDIP (microRNA Data Integration Portal, v.2.0; http://ophid.utoronto.ca/mirDIP) [77] to acquire list of targets of significantly deregulated miRNAs (p < 0.005 and False Discovery Rate (FDR) < 0.01). In our search we considered only miRNA-target relationships among the top third of all predictions and from at least three different databases. Target gene names were standardized by HGNC symbol checker. As a result we obtained molecular interactions networks among differentially regulated miRNAs and their gene targets, either direct, or affected indirectly through their upstream TFs. Next, we integrated our data with previously published gene expression profiles to identify consistently deregulated genes in lung adenocarcinoma. For each deregulated miRNA, we evaluated statistical significance of enrichment of its downstream neighborhood of order 2 by deregulated genes (p-values calculated by hypergeometric test). Similarly, for each consistently deregulated gene, we have evaluated statistical significance of enrichment of its upstream neighborhood of order 2 by deregulated miRNAs. Order 2 neighborhoods were used rather than considering only the direct neighbors, since miRNA deregulation may affect the expression of its indirect targets through targeting transcription factors, while not involving alteration of the expression of a transcription factor itself. This is due to mechanisms of miRNA-mediated gene silencing that, depending on the target mRNA sequence, involves translational repression rather than mRNA degradation [40]. Data were visualized using NAViGaTOR 2.3.2 [78, 79]. Original miRNA-TF-gene regulatory network in NAViGaTOR 2 XML file format (http://ophid.utoronto.ca/navigator) is available at http://www.cs.utoronto.ca/~juris/data/Oncotarget16).
Protein-protein interaction (PPI) network assembly and analysis
This analysis was performed to assemble PPI networks among gene targets of deregulated miRNAs. We used Interologous Interaction Database (I2D) (http://ophid.utoronto.ca/i2d) [80, 81], a database of protein-protein interactions for assembly of PPI networks among genes deregulated by differentially expressed miRNAs. Gene symbols were first converted to UNIPROT IDs by using Bioconductor’s annotation package (Carlson M. org.Hs.eg.db: Genome wide annotation for Human. R package version 3.1.2; http://www.bioconductor.org/packages/release/data/annotation/html/org.Hs.eg.db.html). We then used NAViGaTOR v.2.3.2 [79] to assemble PPI networks comprising genes and their direct neighbors as nodes, and direct physical protein interactions as edges. To test significance of the interconnectedness between the nodes of the obtained PPI network, we generated 1e+5 random PPI networks. Each random PPI network was generated using a set of 148 seed genes (same as the number of genes found deregulated by the differentially expressed miRNAs) randomly chosen from the miRNA-TF regulatory network, by the same procedure as described above. For each random network, we then measured the number of direct PPI connections between the seed genes, as found in I2D. The resulting empirical distribution of the number of direct connections was used to derive the statistical significance of interconnectedness in the actual PPI network. The same random networks were similarly used to test significance of the enrichment of the actual PPI network by the prognostic genes. Resulting network was visualized using NAVIGaTOR 2.3.2 [78,79], and is provided in NAVIGaTOR 2 XML file format (http://ophid.utoronto.ca/navigator) available at http://www.cs.utoronto.ca/~juris/data/Oncotarget16).
Validation of miRNA expression
Significantly deregulated miRNAs were validated using a TaqMan® Array Human MicroRNA platform (Life Technologies, Foster City, CA, USA), as previously described [82]. We used the QuantStudio 12K system (Life Technologies, Foster City, CA, USA). Global data normalization was performed in Expression Suite software (Life Technologies, Foster City, CA, USA) and miRNA expression profiles were determined using RQ Manager v.1.2 software (Life Technologies, Foster City, CA, USA).
Statistical analyses
Statistical analyses were performed to correlate deregulated miRNA expression with clinical and histopathological data of patients. Categorical variables were described using frequencies and percentages and continuous variables were summarized using mean and median (range) values. We used Mann-Whitney test and Fisher´s exact test for comparisons between groups. The Kaplan-Meier method was used to estimate the curves from the observed survival times. The survival curves of any two groups were compared using the log rank test. Statistical analyses were performed by statistical software SAS version 9.3 for Windows (SAS Institute Inc., Cary, NC, USA). Statistically significant difference was defined as p < 0.05.
ACKNOWLEDGMENTS
We thank the technologists at the Laboratory of Animal Biotechnology, University of São Paulo (USP), Piracicaba, SP, Brazil, for support with generating the microRNA sequencing data.
FINANCIAL SUPPORT
Research funds were obtained from São Paulo Research Foundation (FAPESP, Grant # 2011/13213-7, P. Reis). N.C. Cinegaglia was funded through Coordination for the Improvement of Higher Level Education (CAPES-DS-Master fellowship). Computational analysis was funded in part by Ontario Research Fund (GL2-01-030), Canada Foundation for Innovation (CFI #12301, #203373, #29272, #225404, #30865), Canada Research Chair Program (CRC #203373 and #225404), the University of Toronto McLaughlin Centre, and Ontario Ministry of Health and Long Term Care.
CONFLICTS OF INTEREST
All authors declare no conflicts of interest.
Author contributions
N.C.C., S.C.S.A., M.P and L.L.C. performed deep sequencing experiments and data analyses; T.T. and I.J. performed integrative bioinformatic analyses with published databases, miRNA-gene target, networks and pathways analyses, F.E.S. contributed with bioinformatics analysis for pathways identification; R.A.O. performed statistical analyses, E.N.H., D.C.C., A.J.M.C., J.D., C.P.S. and J.L.G. assisted with collection of samples and clinical data, and histopathological analyses of tumor and normal tissues; M.M.C.M. performed sample collection (validation set), RNA extraction and assisted with quantitative PCR data analysis, R.F.C. contributed with optimization and analysis of quantitative PCR validation experiments, P.P.R., S.R.R., W.L.L. and I.J. performed study design, data analyses and data interpretation. N.C.C., P.P.R., T.T. and I.J. wrote the main manuscript text. P.P.R. supervised the study. All authors reviewed the manuscript and agree to the manuscript content.
Editorial note
This paper has been accepted based in part on peer-review conducted by another journal and the authors’ response and revisions as well as expedited peer-review in Oncotarget.
REFERENCES
1. Torre LA, Bray F, Siegel RL, Ferlay J, Lortet-Tieulent J and Jemal A. Global cancer statistics 2012. CA Cancer J Clin. 2015; 65:87-108.
2. Howlader N, Noone AM, Krapcho M, Garshell J, Miller D, Altekruse SF, Kosary CL, Yu M, Ruhl J, Tatalovich Z, Mariotto A, Lewis DR, Chen HS, Feuer EJ, Cronin KA (eds). SEER Cancer Statistics Review, 1975-2012, National Cancer Institute. Bethesda, MD, http://seer.cancer.gov/csr/1975_2012/, based on November 2014 SEER data submission, posted to the SEER web site, April 2015.
3. Travis WD, Brambilla E, Riely G J. New pathologic classification of lung cancer: relevance for clinical practice and clinical trials. J Clin Oncol. 2013; 31:992-1001.
4. Lynch TJ, Bell DW, Sordella R, Gurubhagavatula S, Okimoto RA, Brannigan BW, Harris PL, Haserlat SM, Supko JG, Haluska FG, Louis DN, Christiani DC, Settleman J and Haber DA. Activating mutations in the epidermal growth factor receptor underlying responsiveness of non-small-cell lung cancer to gefitinib. N Engl J Med. 2004; 50:2129-2139.
5. Camidge DR, Bang YJ, Kwak EL, Iafrate AJ, Varella-Garcia M, Fox SB, Riely GJ, Solomon B, Ou SH, Kim DW, Salgia R, Fidias P, Engelman JA, Gandhi L, Jänne PA, Costa DB, et al. Activity and safety of crizotinib in patients with ALK-positive non-small-cell lung cancer: updated results from a phase 1 study. Lancet Oncol. 2012; 13:1011-1019.
6. The Cancer Genome Atlas Research Network. Comprehensive molecular profiling of lung adenocarcinoma. Nature. 2014; 511:543-550.
7. Kris MG, Johnson BE, Berry LD, Kwiatkowski DJ, Iafrate AJ, Wistuba II, Varella-Garcia M, Franklin WA, Aronson SL, Su P-F, Shyr Y, Camidge DR, Sequist LV, et al. Using Multiplexed Assays of Oncogenic Drivers in Lung Cancers to Select Targeted Drugs. JAMA. 2014; 311:1998-2006.
8. Alamgeer M, Ganju V, Watkins DN. Novel therapeutic targets in non-small cell lung cancer. Curr Opin Pharmacol. 2013; 13:394-401.
9. Savas P, Hughes B, Solomon B. Targeted therapy in lung cancer: IPASS and beyond, keeping abreast of the explosion of targeted therapies for lung cancer. J Thorac Dis. 2013; 5:S579-92.
10. Chan BA, Hughes BG. Targeted therapy for non-small cell lung cancer: current standards and the promise of the future. Transl Lung Cancer Res. 2015; 4:36-54.
11. Bartel DP. MicroRNAs: genomics, biogenesis, mechanism, and function. Cell. 2004; 116:281-297.
12. Iorio MV and Croce CM. MicroRNAs in cancer: small molecules with a huge impact. J Clin Oncol. 2009; 27:5848-5856.
13. Joshi P, Middleton J, Jeon YJ and Garofalo M. MicroRNAs in lung cancer. World J Methodol. 2014; 4:59-72.
14. Liu J, Lu KH, Liu ZL, Sun M, De W and Wang ZX. MicroRNA-100 is a potential molecular marker of non-small cell lung cancer and functions as a tumor suppressor by targeting polo-like kinase 1. BMC Cancer. 2012; 12:519.
15. Vucic EA, Thu KL, Pikor LA, Enfield KS, Yee J, English JC, MacAulay CE, Lam S, Jurisica I and Lam WL. Smoking status impacts microRNA mediated prognosis and lung adenocarcinoma biology. BMC Cancer. 2014; 14:778.
16. Godard P, van Eyll J. Pathway analysis from lists of microRNAs: common pitfalls and alternative strategy. Nucl Acids Res. 2015; 43:3490-3497.
17. Bleazard T, Lamb JA, Griffiths-Jones S. Bias in microRNA functional enrichment analysis. Bioinformatics. 2015; 1-7.
18. Mittempergher L, de Ronde JJ, Nieuwland M, Kerkhoven RM, Simon I, Rutgers EJT, Wessels LFA, Van’t Veer LJ. Gene expression profiles from FFPE breast cancer tissue are largely comparable to fresh frozen matched tissue. Plos One. 2011; 6:e17163.
19. Reis PP, Waldron L, Goswami R, Xu W, Xuan Y, Perez-Ordonez B, Gullane P, Irish J, Jurisica I, Kamel-Reid R. mRNA transcript quantification in archival samples using multiplexed, color-coded probes. BMC Biotechnology. 2011; 11:46.
20. Li J, Smyth P, Flavin R, Cahill S, Denning K, Aherne S, Guenther SM, O’Leary JJ, Sheils O. Comparison of miRNA expression patterns using total RNA extracted from matched samples of FFPE cells and snap frozen cells. BMC Biotechnol. 2007; 7:36.
21. Xi Y, Nakajima G, Gavin E, Morris CG, Kudo K, Hayashi K, Ju J. Systematic analysis of microRNA expression of RNA extracted from fresh frozen and FFPE samples. RNA. 2007; 13:1668-1674.
22. Goswami R, Waldron L, Machado J, Cervigne N, Xu W, Reis PP, Bailey D, Jurisica I, Crump MR, Kamel-Reid S. Optimization and analysis of a quantitative real-time PCR-based technique to determine microRNA expression in formalin fixed paraffin embedded samples. BMC Biotechnol. 2010; 10:47.
23. Kumar MS, Erkeland SJ, Pester RE, Chen CY, Ebert MS, Sharp PA and Jacks T. Suppression of non-small cell lung tumor development by the let-7 microRNA family. Proc Natl Acad Sci U S A. 2008; 105:3903-3908.
24. Roush S and Slack FJ. The let-7 family of microRNAs. Trends Cell Biol. 2008; 18:505-516.
25. Johnson SM, Grosshans H, Shingara J, Byrom M, Jarvis R, Cheng A, Labourier E, Reinert KL, Brown D and Slack FJ. RAS is regulated by the let-7 microRNA family. Cell. 2005; 120:635-647.
26. Landi MT, Zhao Y, Rotunno M, Koshiol J, Liu H, Bergen AW, Rubagotti M, Goldstein AM, Linnoila I, Marincola FM, Tucker MA, Bertazzi PA, Pesatori AC, Caporaso NE, McShane LM and Wang E. MicroRNA expression differentiates histology and predicts survival of lung cancer. Clin Cancer Res. 2010; 16:430-441.
27. Hennessey PT, Sanford T, Choudhary A, Mydlarz WW, Brown D, Adai AT, Ochs MF, Ahrendt SA, Mambo E and Califano JA. Serum microRNA biomarkers for detection of non-small cell lung cancer. PLoS One. 2012; 7:e32307.
28. Rahman M, Lovat F, Romano G, Calore F, Acunzo M, Bell EH and Nana-Sinkam P. miR-15b/16-2 regulates factors that promote p53 phosphorylation and augments the DNA damage response following radiation in the lung. J Biol Chem. 2014; 289:26406-26416.
29. Lowe J, Cha H, Lee MO, Mazur SJ, Appella E and Fornace AJ. Regulation of the Wip1 phosphatase and its effects on the stress response. Front Biosci (Landmark Ed). 2012; 17:1480-1498.
30. Yu L, Todd NW, Xing L, Xie Y, Zhang H, Liu Z, Fang H, Zhang J, Katz RL and Jiang F. Early detection of lung adenocarcinoma in sputum by a panel of microRNA markers. Int J Cancer. 2010; 127:2870-2878.
31. Shen H, Zhu F, Liu J, Xu T, Pei D, Wang R, Qian Y, Li Q, Wang L, Shi Z, Zheng J, Chen Q, Jiang B and Shu Y. Alteration in Mir-21/PTEN Expression Modulates Gefitinib Resistance in Non-Small Cell Lung Cancer. PLoS One. 2014; 9:e103305.
32. Chan JA, Krichevsky AM, Kosik KS. MicroRNA-21 is an antiapoptotic factor in human glioblastoma cells. Cancer Res. 2005; 65:6029-33.
33. Korpal M and Kang Y. The emerging role of miR-200 family of microRNAs in epithelial-mesenchymal transition and cancer metastasis. RNA Biol. 2008; 5:115-119.
34. Christoffersen NR, Silahtaroglu A, Orom UA, Kauppinen S and Lund AH. miR-200b mediates post-transcriptional repression of ZFHX1B. RNA. 2007; 13:1172-1178.
35. Li X, Roslan S, Johnstone CN, Wright JA, Bracken CP, Anderson M, Bert AG, Selth LA, Anderson RL, Goodall GJ, Gregory PA and Khew-Goodall Y. MiR-200 can repress breast cancer metastasis through ZEB1-independent but moesin-dependent pathways. Oncogene. 2014; 33:4077-4088.
36. Zhang P, Bill K, Liu J, Young E, Peng T, Bolshakov S, Hoffman A, Song Y, Demicco EG, Terrada DL, Creighton CJ, Anderson ML, Lazar AJ, Calin GG, Pollock RE and Lev D. MiR-155 is a liposarcoma oncogene that targets casein kinase-1α and enhances β-catenin signaling. Cancer Res. 2012; 72:1751-1762.
37. Yanaihara N, Caplen N, Bowman E, Seike M, Kumamoto K, Yi M, Stephens RM, Okamoto A, Yokota J, Tanaka T, Calin GA, Liu CG, Croce CM and Harris CC. Unique microRNA molecular profiles in lung cancer diagnosis and prognosis. Cancer Cell. 2006; 9:189-198.
38. Cui EH, Li HJ, Hua F, Wang B, Mao W, Feng XR, Li JY and Wang X. Serum microRNA 125b as a diagnostic or prognostic biomarker for advanced NSCLC patients receiving cisplatin-based chemotherapy. Acta Pharmacol Sin. 2013; 34:309-313.
39. Zhang M, Zhou X, Wang B, Yung BC, Lee LJ, Ghoshal K and Lee RJ. Lactosylated gramicidin-based lipid nanoparticles (Lac-GLN) for targeted delivery of anti-miR-155 to hepatocellular carcinoma. J Control Release. 2013; 168:251-261.
40. Huntzinger E, Izaurralde E. Gene silencing by microRNAs: contributions of translational repression and mRNA decay. Nat Rev Genet. 2011; 12:99-110.
41. Huso TH and Resar LM. The high mobility group A1 molecular switch: turning on cancer - can we turn it off? Expert Opin Ther Targets. 2014; 18:541-553.
42. Zhu CQ, Strumpf D, Li CY, Li Q, Liu N, Der S, Shepherd FA, Tsao MS and Jurisica I. Prognostic gene expression signature for squamous cell carcinoma of lung. Clin Cancer Res. 2010; 16:5038-5047.
43. Zhang Z, Wang Q, Chen F and Liu J. Elevated expression of HMGA1 correlates with the malignant status and prognosis of non-small cell lung cancer. Tumour Biol. 2015; 36:1213-1219.
44. Schmitz U, Lai X, Winter F, Wolkenhauer O, Vera J and Gupta SK. Cooperative gene regulation by microRNA pairs and their identification using a computational workflow. Nucleic Acids Res. 2014; 42:7539-7552.
45. Goswami RS, Atenafu EG, Xuan Y, Waldron L, Reis PP, Sun T, Datti A, Xu W, Kuruvilla J, Good DJ, Lai R, Church AJ, Lam WS, Baetz T, Lebrun DP, Sehn LH, et al. MicroRNA signature obtained from the comparison of aggressive with indolent non-Hodgkin lymphomas: potential prognostic value in mantle-cell lymphoma. J Clin Oncol. 2013; 31:2903-2911.
46. Andrews S. FastQC a Quality Control Tool for High Throughput Sequence. 2010. Available online at http://www.bioinformatics.babraham.ac.uk/projects/fastqc. Date of access 05/08/2015.
47. Martin, M. Cutadapt removes adapter sequences from high-throughput sequencing reads. EMBnet.journal. 2011. pp. 10-12. Date of access 05/08/2015.
48. Langmead B, Trapnell C, Pop M and Salzberg SL. Ultrafast and memory-efficient alignment of short DNA sequences to the human genome. Genome Biol. 2009; 10:R25.
49. Anders S, Pyl PT and Huber W. HTSeq-a Python framework to work with high-throughput sequencing data. Bioinformatics. 2015; 31:166-169.
50. Robinson MD and Oshlack A. A scaling normalization method for differential expression analysis of RNA-seq data. Genome Biol. 2010; 11:R25.
51. Robinson MD, Smyth GK. Small-sample estimation of negative binomial dispersion, with applications to SAGE data. Biostatistics. 2008; 9:321-332.
52. Robinson MD, McCarthy DJ Smyth GK. edgeR: a Bioconductor package for differential expression analysis of digital gene expression data. Bioinformatics. 2010; 26:139-140.
53. Gentleman RC, Carey VJ, Bates DM, Bolstad B, Dettling M, Dudoit S, Ellis B, Gautier L, Ge Y, Gentry J, Hornik K, Hothorn T, Huber W, Iacus S, Irizarry R, Leisch F, et al. Bioconductor: open software development for computational biology and bioinformatics. Genome Biol. 2004; 5:R80.
54. Cho WC, Chow AS and Au JS. Restoration of tumour suppressor hsa-miR-145 inhibits cancer cell growth in lung adenocarcinoma patients with epidermal growth factor receptor mutation. Eur J Cancer. 2009; 45:2197-2206.
55. Crawford M, Batte K, Yu L, Wu X, Nuovo GJ, Marsh CB, Otterson GA and Nana-Sinkam SP. MicroRNA 133B targets pro-survival molecules MCL-1 and BCL2L2 in lung cancer. Biochem Biophys Res Commun. 2009; 388:483-489.
56. Jang JS, Jeon HS, Sun Z, Aubry MC, Tang H, Park CH, Rakhshan F, Schultz DA, Kolbert CP, Lupu R, Park JY, Harris CC, Yang P and Jen J. Increased miR-708 expression in NSCLC and its association with poor survival in lung adenocarcinoma from never smokers. Clin Cancer Res. 2012; 18:3658-3667.
57. Dacic S, Kelly L, Shuai Y and Nikiforova MN. miRNA expression profiling of lung adenocarcinomas: correlation with mutational status. Mod Pathol. 2010; 23:1577-1582.
58. Ma J, Mannoor K, Gao L, Tan A, Guarnera MA, Zhan M, Shetty A, Stass SA, Xing L and Jiang F. Characterization of microRNA transcriptome in lung cancer by next-generation deep sequencing. Mol Oncol. 2014; 8:1208-1219.
59. Lee YM, Cho H-J, Lee SY, Yun SC, Kim JH, Lee SY, Kwon SJ, Choi E, Na MJ, Kang J-K and Son JW. MicroRNA-23a: A novel serum based diagnostic biomarker for lung adenocarcinoma. Tuberc Respir Dis. 2011; 71:8-14.
60. Kozomara A, Griffiths-Jones S. miRBase: annotating high confidence microRNAs using deep sequencing data. Nucleic Acids Res. 2014; 42:D68-73.
61. Kolde R, Laur S, Adler P and Vilo J. Robust rank aggregation for gene list integration and meta-analysis. Bioinformatics. 2012; 28:573-580.
62. Beer DG, Kardia SL, Huang CC, Giordano TJ, Levin AM, Misek DE, Lin L, Chen G, Gharib TG, Thomas DG, Lizyness ML, Kuick R, Hayasaka S, Taylor JM, Iannettoni MD, Orringer MB, et al. Gene-expression profiles predict survival of patients with lung adenocarcinoma. Nat Med. 2002; 8:816-824.
63. Bhattacharjee A, Richards WG, Staunton J, Li C, Monti S, Vasa P, Ladd C, Beheshti J, Bueno R, Gillette M, Loda M, Weber G, Mark EJ, Lander ES, Wong W, Johnson BE, et al. Classification of human lung carcinomas by mRNA expression profiling reveals distinct adenocarcinoma subclasses. Proc Natl Acad Sci U S A. 2001; 98:13790-13795.
64. Hou J, Aerts J, den Hamer B, van Ijcken W, den Bakker M, Riegman P, van der Leest C, van der Spek P, Foekens JA, Hoogsteden HC, Grosveld F and Philipsen S. Gene expression-based classification of non-small cell lung carcinomas and survival prediction. PLoS One. 2010; 5:e10312.
65. Landi MT, Dracheva T, Rotunno M, Figueroa JD, Liu H, Dasgupta A, Mann FE, Fukuoka J, Hames M, Bergen AW, Murphy SE, Yang P, Pesatori AC, Consonni D, Bertazzi PA, Wacholder S, et al. Gene expression signature of cigarette smoking and its role in lung adenocarcinoma development and survival. PLoS One. 2008; 3:e1651.
66. Okayama H, Kohno T, Ishii Y, Shimada Y, Shiraishi K, Iwakawa R, Furuta K, Tsuta K, Shibata T, Yamamoto S, Watanabe S, Sakamoto H, Kumamoto K, Takenoshita S, Gotoh N, Mizuno H, et al. Identification of genes upregulated in ALK-positive and EGFR/KRAS/ALK-negative lung adenocarcinomas. Cancer Res. 2012; 72:100-111.
67. Rohrbeck A, Neukirchen J, Rosskopf M, Pardillos GG, Geddert H, Schwalen A, Gabbert HE, von Haeseler A, Pitschke G, Schott M, Kronenwett R, Haas R and Rohr UP. Gene expression profiling for molecular distinction and characterization of laser captured primary lung cancers. J Transl Med. 2008; 6:69.
68. Stearman RS, Dwyer-Nield L, Zerbe L, Blaine SA, Chan Z, Bunn PA, Johnson GL, Hirsch FR, Merrick DT, Franklin WA, Baron AE, Keith RL, Nemenoff RA, Malkinson AM and Geraci MW. Analysis of orthologous gene expression between human pulmonary adenocarcinoma and a carcinogen-induced murine model. Am J Pathol. 2005; 167:1763-1775.
69. Su LJ, Chang CW, Wu YC, Chen KC, Lin CJ, Liang SC, Lin CH, Whang-Peng J, Hsu SL, Chen CH and Huang CY. Selection of DDX5 as a novel internal control for Q-RT-PCR from microarray data using a block bootstrap re-sampling scheme. BMC Genomics. 2007; 8:140.
70. Zhang L, Miles MF and Aldape KD. A model of molecular interactions on short oligonucleotide microarrays. Nat. Biotechnol. 2003; 21:818-821.
71. Smyth GK. Limma: linear models for microarray data. In Bioinformatics and computational biology solutions using R and Bioconductor: Springer. 2005.
72. Lachmann A, Xu H, Krishnan J, Berger SI, Mazloom AR and Ma’ayan A. ChEA: transcription factor regulation inferred from integrating genome-wide ChIP-X experiments. Bioinformatics. 2010; 26:2438-2444.
73. Zheng G, Tu K, Yang Q, Xiong Y, Wei C, Xie L, Zhu Y and Li Y. ITFP: an integrated platform of mammalian transcription factors. Bioinformatics. 2008; 24:2416-2417.
74. Portales-Casamar E, Arenillas D, Lim J, Swanson MI, Jiang S, McCallum A, Kirov S and Wasserman WW. The PAZAR database of gene regulatory information coupled to the ORCA toolkit for the study of regulatory sequences. Nucleic Acids Res. 2009; 37:D54-60.
75. Jiang C, Xuan Z, Zhao F and Zhang MQ. TRED: a transcriptional regulatory element database, new entries and other development. Nucleic Acids Res. 2007; 35:D137-140.
76. Neph S, Stergachis AB, Reynolds A, Sandstrom R, Borenstein E and Stamatoyannopoulos JA. Circuitry and dynamics of human transcription factor regulatory networks. Cell. 2012; 150:1274-1286.
77. Shirdel EA, Xie W, Mak TW and Jurisica I. NAViGaTing the micronome—using multiple microRNA prediction databases to identify signalling pathway-associated microRNAs. PLoS One. 2011; 6:e17429.
78. Pastrello C, Otasek D, Fortney K, Agapito G, Cannataro M, Shirdel E and Jurisica I. Visual data mining of biological networks: one size does not fit all. PLoS Comput Biol. 2013; 9:e1002833.
79. Brown KR, Otasek D, Ali M, McGuffin MJ, Xie W, Devani B, Toch IL and Jurisica I. NAViGaTOR: Network Analysis, Visualization and Graphing Toronto. Bioinformatics. 2009; 25:3327-3329.
80. Brown KR and Jurisica I. Online predicted human interaction database. Bioinformatics. 2005; 21:2076-2082.
81. Brown KR and Jurisica I. Unequal evolutionary conservation of human protein interactions in interologous networks. Genome Biol. 2007; 8:R95.
82. Goswami RS, Waldron L, Machado J, Cervigne NK, Xu W, Reis PP, Bailey DJ, Jurisica I, Crump MR and Kamel-Reid S. Optimization and analysis of a quantitative real-time PCR-based technique to determine microRNA expression in formalin-fixed paraffin-embedded samples. BMC Biotechnol. 2010; 10:47.