
INTRODUCTION
Lung cancer is the leading cause of cancer-related death, accounting for more than 27% of all cancer deaths worldwide [1]. Lung cancer is classified as non-small cell lung cancer (NSCLC) (87% of cases) or small cell lung cancer (13% of cases) for the purpose of treatment [2]. Even with the recent advances in the treatment of lung cancers, the 5-year relative survival rate is currently 18%, as more than 50% of cases are diagnosed at an advanced stage [1].
Epidermal growth factor receptor (EGFR) is a receptor tyrosine kinase (TK). EGFR mutations lead to constitutive activation of downstream signaling pathways that promote cell proliferation [3]. EGFR mutations are present in 10% of NSCLC cases in North America and Europe, and more common (> 50%) among non-smokers, adenocarcinomas, and Asian patients [4]. The most commonly found mutations are in-frame deletions of amino acids 747–750 in exon 19 (exon 19 deletion), accounting for 45% of mutations, and exon 21 mutations resulting in the single-point substitution mutation L858R, which accounts for 40%–45% of such mutations [4]. Both exon 19 deletions and the L858R point mutation result in activation of the TK domain, and both are correlated with sensitivity to small molecule TK inhibitors (TKIs), such as erlotinib, gefitinib, and afatinib. Treatment with TKIs is correlated with a statistically significant and clinically meaningful response rate and prognosis [5]. Among wild-type EGFR patients, survival was superior in those who received first-line chemotherapy than those who received erlotinib first followed by subsequent chemotherapy (11.6 vs. 8.7 months, respectively), while the point mutation T790M in exon 20 is associated with poorer response and shorter survival [6, 7]. Thus, detection of EGFR mutation status is critical to determine an appropriate treatment strategy, especially for the administration of EGFR-TKIs as a first-line therapy. Additional studies have shown that different mutations are associated with varying clinical outcomes. For example, NSCLC harboring the EGFR exon 19 deletion may be more susceptible to TKIs as compared with tumors with the L858R mutation [8–10]. So, detection of EGFR mutation type is important to predict the effect of TKI treatment.
Currently, tumor tissue, which is usually obtained by biopsy or surgery, is the gold standard for detection of EGFR mutations. Unfortunately, most NSCLC patients are diagnosed at an advanced stage; thus, it is difficult to obtain tumor samples from non-operated patients. Additionally, sample preservation and tumor heterogeneity also hamper the use of tumor tissue for cancer sequencing, with different areas of the same tumor showing different genetic profiles (intratumor heterogeneity) [11]. So, genomic analysis from single tumor biopsy may underestimate the mutational burden of heterogeneous tumors [12]. Thus, development of new methods is needed for the detection of EGFR mutations in patients with little or no available tumor sample.
Circulating cell-free DNA (cfDNA) can provide the same genetic information as a tissue biopsy and can be drawn at any time during the course of therapy allowing for dynamic monitoring of molecular change [11]. Detection of EGFR mutations in blood may provide a noninvasive and replicable source of genetic information [11, 13]. Although, numerous studies have investigated the diagnostic accuracy of cfDNA for detection of EGFR mutations [14–17], the concordance rate of EGFR mutations between cfDNA and tumor tissue varies.
Therefore, we conducted this meta-analysis to investigate the diagnostic accuracy of cfDNA for detection of the two main EGFR mutations in tumor tissues in lung cancer.
RESULTS
Characteristics of eligible studies
Of a total of 313 articles identified during the initial search, 244 were excluded after reviewing the titles and abstracts, leaving 69 articles for further analysis of the full text. Of these, 27 articles met the inclusion criteria, which included 22 studies of all EGFR mutations [14–16, 18–35]. Eleven articles were selected for the meta-analysis of the exon 19 deletion and the L858R point mutation [14–17, 20, 28, 36–39] (Figure 1). Of these, Li et al. [20] detected EGFR mutations both in plasma and serum, so the data from plasma and serum were analyzed independently. All included studies were published between 2007 and 2015. Three studies were conducted in Japan [14, 28, 33], two in Korea [23, 27], two in France [16, 36], one in Australia [31], one in the US [35], one in Spain [39], one in Denmark [19], and the others in China. Characteristics of the eligible studies are shown in Table 1.
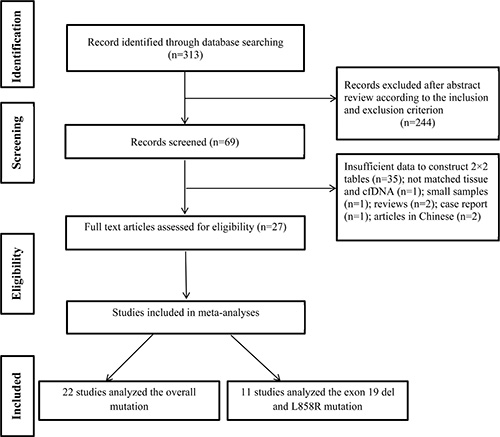
Figure 1: Flowchart of study selection.
Table 1. Characteristics of eligible studies
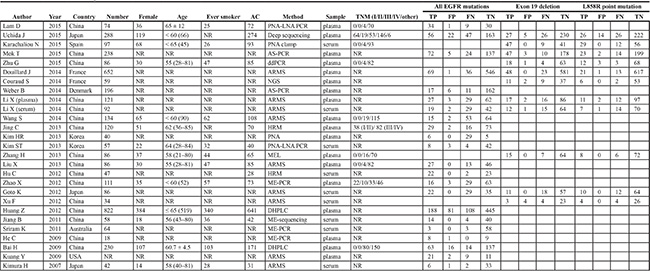
PCR: polymerase chain reaction; PNA-LNA PCR: peptide nucleic acid-locked nucleic acid PCR; AS-PCR: allele-specific PCR; ARMS: scorpion amplification refractory mutation system; HRM: high resolution melting; ddPCR: droplet digital PCR; PNA: peptide nucleic acid-mediated PCR clamping; MEL: mutant-enriched liquidchip; ME-PCR: mutant-enriched PCR; DHPLC: denaturing high-performance liquid chromatography; ME sequencing: mutant-enriched sequencing; NGS: next-generation sequencing; NR: not reported; AC: adenocarcinoma; TNM: tumor node metastasis;
TP: true positive; FP: false positive; FN: false negative; TN: true negative.
Quality assessment of studies
QUADAS-2 was used to estimate the quality of each eligible study. As shown in Table 2, the methodological quality of the eligible studies was not significantly high.
Table 2: Quality assessment of 27 studies by QUADAS-2
Study |
Risk of bias |
Applicability concerns |
|||||
|---|---|---|---|---|---|---|---|
Patient selection |
Index test |
Reference standard |
Flow and timing |
Patient selection |
Index test |
Reference standard |
|
Lam D |
L |
UC |
L |
L |
L |
L |
L |
Uchida J |
L |
L |
L |
L |
L |
L |
L |
Karachaliou N |
L |
L |
L |
L |
L |
L |
L |
Mok T |
L |
UC |
L |
L |
L |
L |
L |
Zhu G |
L |
H |
L |
L |
L |
L |
L |
Douillard J |
L |
L |
L |
L |
L |
L |
L |
Couraud S |
L |
L |
L |
L |
L |
L |
L |
Weber B |
L |
UC |
L |
L |
L |
L |
L |
Li X (plasma) |
L |
L |
L |
L |
L |
L |
L |
Li X (serum) |
L |
L |
L |
L |
L |
L |
L |
Wang S |
L |
UC |
L |
L |
L |
L |
L |
Jing C |
L |
L |
L |
L |
L |
L |
L |
Kim HR |
L |
L |
L |
L |
L |
L |
L |
Kim ST |
L |
L |
L |
L |
L |
L |
L |
Zhang H |
L |
L |
UC |
L |
L |
L |
L |
Liu X |
L |
L |
L |
L |
L |
L |
L |
Hu C |
L |
L |
UC |
L |
L |
L |
L |
Zhao X |
L |
L |
UC |
L |
L |
L |
L |
Goto K |
L |
L |
UC |
L |
L |
L |
L |
Xu F |
L |
L |
L |
L |
L |
L |
L |
Huang Z |
L |
UC |
L |
L |
L |
L |
L |
Jiang B |
L |
L |
L |
L |
L |
L |
L |
Sriram K |
L |
H |
L |
L |
L |
L |
L |
He C |
L |
H |
L |
L |
L |
L |
L |
Bai H |
L |
L |
L |
L |
L |
L |
L |
Kuang Y |
L |
UC |
L |
L |
L |
L |
L |
Kimura H |
L |
H |
L |
L |
L |
L |
L |
L: Low H: High UC: Unclear.
Publication bias and sensitivity analysis
Deek’s funnel plots and p values were used to estimate publication bias. As shown in Figure 2, the p values for all mutations and the L858R point mutation were 0.46 and 0.86, suggesting no significant publication bias, while the p value of the exon 19 deletion was 0.03, indicating the likelihood of publication bias. Thus, we conducted sensitivity analysis and found that the pooled results were not affected by individual studies (Figure 2).
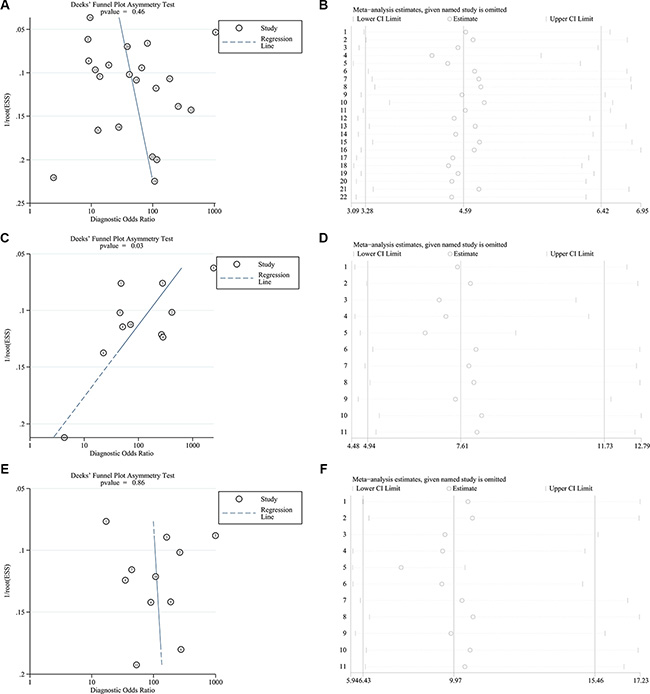
Figure 2: Deek’s funnel plots and sensitivity analyses of all EGFR mutations (A, B), the exon 19 deletion (C, D), and the L858R point mutation (E, F) in the pooled studies.
Overall analysis
Compared with NSCLC tumor tissues, the pooled sensitivity and specificity of cfDNA for the detection of EGFR mutation status were 0.60 (95% confidence intervals (95% CI) = 0.57–0.62) and 0.94 (95% CI = 0.93–0.95), respectively. The pooled sensitivity and specificity were 0.64 (95% CI = 0.60–0.69) and 0.99 (95% CI = 0.98–0.99) for detection of the exon 19 deletion, and 0.57 (95% CI = 0.51–0.63) and 0.99 (95% CI = 0.98–0.99) for detection of the L858R point mutation (Figure 3). positive likelihood ratio (PLR) and negative likelihood ratio (NLR) of cfDNA were 12.02 (95% CI = 7.71–18.74) and 0.41 (95% CI = 0.33–0.51) for detection of all mutations, 29.16 (95% CI = 12.82–66.29) and 0.39 (95% CI = 0.29–0.51) for detection of the exon 19 deletion, and 36.87 (95% CI = 16.17–84.09) and 0.44 (95% CI = 0.38–0.50) for detection of the L858R point mutation (Table 3). The summary receiver operating characteristic (SROC) curves showed that the areas under the curve (AUC) of cfDNA for detection of all EGFR mutations, the exon 19 deletion, and the L858R point mutation were 0.9208, 0.9583, and 0.9605, respectively (Figure 4).
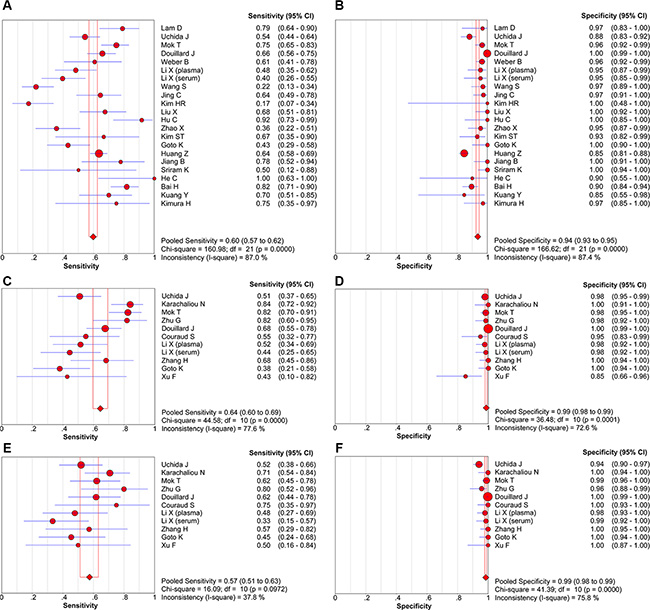
Figure 3: Forest plots of sensitivity and specificity of cfDNA for detection of all EGFR mutations (A, B), the exon 19 deletion (C, D), and the L858R point mutation (E, F).
Table 3: Subgroup analysis
|
Study |
Sensitivity |
Specificity |
PLR |
NLR |
DOR |
AUC |
|---|---|---|---|---|---|---|---|
Mutation |
|
|
|
|
|
|
|
All EGFR mutations |
22 |
0.60 (0.57–0.62) |
0.94 (0.93–0.95) |
12.02 (7.71–18.74) |
0.41 (0.33–0.51) |
34.36 (19.75–59.76) |
0.9208 |
Exon 19 deletion |
11 |
0.64 (0.60–0.69) |
0.99 (0.98–0.99) |
29.16 (12.82–66.29) |
0.39 (0.29–0.51) |
84.74 (33.27 – 215.88) |
0.9583 |
L858R point mutation |
11 |
0.57 (0.51–0.63) |
0.99 (0.98–0.99) |
36.87 (16.17 – 84.09) |
0.44 (0.38–0.50) |
91.28 (37.51–222.10) |
0.9605 |
Blood type |
|
|
|
|
|
|
|
Plasma |
15 |
0.60 (0.57–0.63) |
0.93 (0.92–0.94) |
10.45 (6.37–17.14) |
0.42 (0.32–0.54) |
29.36 (15.60–55.26) |
0.9146 |
Serum |
7 |
0.56 (0.48–0.64) |
0.98 (0.95–0.99) |
20.37 (9.45–43.91) |
0.40 (0.26–0.60) |
45.42 (18.99–108.62) |
0.9347 |
Country |
|
|
|
|
|
|
|
China |
13 |
0.62(0.58–0.65) |
0.91 (0.89–0.92) |
11.19 (6.52–19.21) |
0.37 (0.27–0.51) |
34.55 (17.14–69.66) |
0.9211 |
Japan |
3 |
0.52 (0.44–0.60) |
0.91 (0.87–0.94) |
10.67 (2.40- 47.35) |
0.51 (0.43–0.61) |
24.23 (4.33–135.56) |
0.8999 |
Korea |
2 |
0.30 (0.17–0.45) |
0.94 (0.83–0.99) |
6.83 (2.40–19.45) |
0.58 (0.13–2.63) |
11.27 (1.03–123.54) |
|
Other |
4 |
0.65 (0.57–0.72) |
0.99 (0.98–0.99) |
30.35 (4.84–190.29) |
0.36 (0.30–0.45) |
81.12 (12.05–546.05) |
0.9569 |
Sample size |
|
|
|
|
|
|
|
≥ 90 |
11 |
0.59 (0.56–0.62) |
0.93 (0.92–0.94) |
10.73 (6.29–18.29) |
0.45 (0.34–0.59) |
26.41 (13.65–51.08) |
0.9054 |
< 90 |
11 |
0.62 (0.56–0.68) |
0.98 (0.95–0.99) |
17.42 (9.64–31.50) |
0.34 (0.22–0.54) |
53.88 (24.63–117.84) |
0.9422 |
Detection method |
|
|
|
|
|
|
|
PNA-LNA PCR clamp |
2 |
0.76 (0.63–0.87) |
0.95 (0.87–0.99) |
16.95 (5.07–56.73) |
0.26 (0.16–0.42) |
59.25 (16.49–212.84) |
|
AS-PCR |
2 |
0.72 (0.63–0.79) |
0.96 (0.94–0.98) |
20.02 (10.24–39.11) |
0.32 (0.20–0.49) |
65.99 (31.49–138.31) |
|
ARMS |
8 |
0.51 (0.46–0.56) |
0.99 (0.98–0.99) |
17.80 (6.58–48.21) |
0.48 (0.35–0.67) |
40.39 (12.81–127.34) |
0.9291 |
HRM |
2 |
0.74 (0.62–0.84) |
0.98 (0.93–1.00) |
29.00 (8.14–103.26) |
0.22 (0.06–0.79) |
97.31 (25.78–367.40) |
|
ME-PCR |
3 |
0.46 (0.33–0.59) |
0.97 (0.93–0.99) |
8.91 (3.81–20.85) |
0.53 (0.27–1.05) |
19.13 (6.50–56.33) |
0.9111 |
DHPLC |
2 |
0.67 (0.62–0.72) |
0.86 (0.83–0.88) |
5.48 (2.93–10.24) |
0.31 (0.14–0.65) |
18.34 (4.69–71.64) |
|
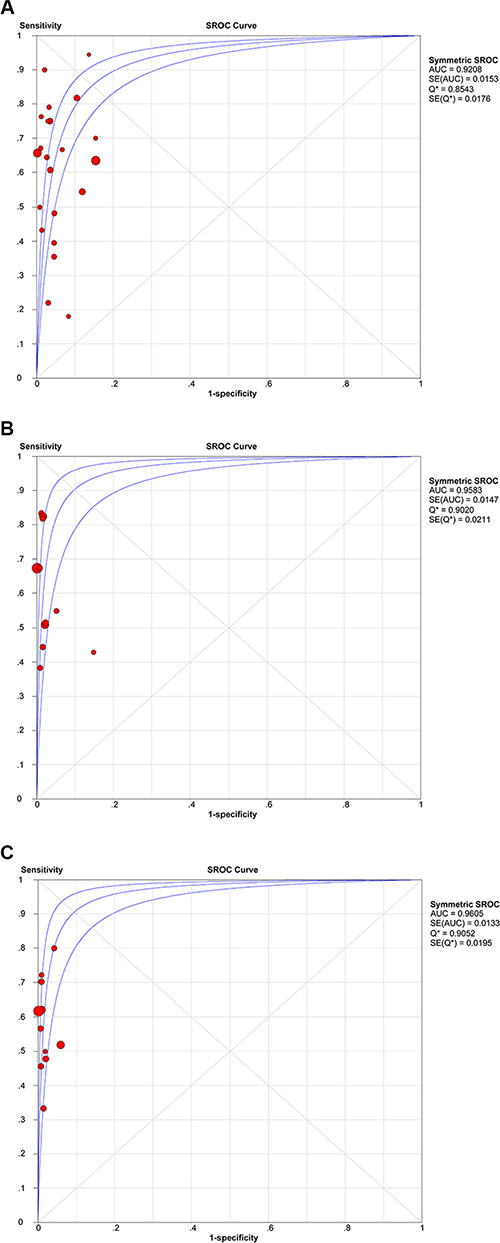
Figure 4: SROC curves of cfDNA for detection of all EGFR mutations (A), the exon 19 deletion (B), and the L858R point mutation (C).
Threshold effect and heterogeneity
Spearman correlation coefficients and p values were calculated to assess the threshold effect using Meta-DiSc meta-analysis software [40]. The Spearman correlation coefficients for all EGFR mutations, the exon 19 deletion, and the L858R point mutation were –0.018, –0.255, and –0.055, respectively, and the p values were 0.938, 0.450, and 0.873, respectively, indicating that the threshold effect was not significant. As shown in Figure 3, the heterogeneity caused by the non-threshold effect was high, so we conducted meta-regression analysis to detect the source of heterogeneity. However, the results showed that the country, study size, detection method, and blood type did not contribute to heterogeneity (Table 4).
Table 4. Meta-regression with the covariates
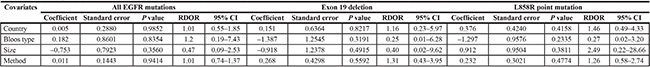
EGFR: epidermal growth factor receptor; 95% CI: 95% confidence interval; RDOR: relative diagnostic odds ratios
DISCUSSION
Although tumor tissue is the gold standard for detection of EGFR mutation status, major barriers exist in terms of acquisition and utility. To overcome the limitations of tissue biopsies, cfDNA can, in principle, provide the same genetic information as a tissue biopsy [11]. A number of studies have investigated the use of cfDNA for detection of the EGFR mutation status with varying results. Here, we performed a meta-analysis to evaluate the diagnostic accuracy of cfDNA for detection of EGFR mutations.
The pooled sensitivity and specificity of cfDNA for detection of EGFR mutations were 0.60 and 0.94, respectively. Several studies reported that differences in clinical outcomes were associated with different mutations. Lung cancer patients harboring the EGFR exon 19 deletion achieve longer survival following treatment with gefitinib or erlotinib, as compared to those with tumors harboring the L858R point mutation [8–10]. Additionally, the median overall survival (mOS) was shorter in patients with the L858R point mutation by cfDNA analysis than in those with the exon 19 deletion (13.7 vs. 30.0 months, respectively, p < 0.01) [39]. So, we also estimated the diagnostic accuracy of cfDNA for detection of the exon 19 deletion and the L858R point mutation. Our result showed that the pooled sensitivities of cfDNA for detection of the exon 19 deletion and the L858R point mutation were 0.64 and 0.57, and the pooled specificity were 0.99 and 0.99, respectively, indicating that cfDNA had a high degree of specificity, likely because mutations found in cfDNA are, in essence, integral agents of tumors that are defined by their presence in tumor DNA and absence in matched normal DNA [11].
cfDNA analysis is a noninvasive technique to predict patient response to EGFR-TKI treatment, dynamically assess treatment outcome, and facilitate early detection of resistance mutations. Que D et al. [41] reported that EGFR-TKI treatment significantly improved mOS in patients harboring the EGFR mutation in cfDNA than those that did not exhibit EGFR mutation (25.7 vs 13.5 months, respectively). Additionally, for EGFR mutations at baseline patients, Lee et al. [42] reported that the mOS was improved among patient with undetectable EGFR, as compared to detectable EGFR mutations in cfDNA (23.7 vs. 11.2 months) after TKI treatment for 2 months, in accordance with the findings of Mok et al. [15] who reported that the mOS for patients who continued to have detectable EGFR mutations at cycle 3 was 18.2 months and 31.9 months for patients without detectable mutations. The T790M point mutation is associated with acquired resistance to TKI therapy and reportedly occurs in about 50% of patients with disease progression after initial response to gefitinib or erlotinib [35]. As cfDNA had a high specificity to detect EGFR mutations, cfDNA might be a suitable noninvasive screening test to monitor T790M mutations during TKI treatment [35]. Lee et al. [42] found that 14 (28.6%) of 49 patients harbored the resistance mutation T790M in cfDNA during EGFR TKIs treatment, which is similar to the studies by Sakai et al. [43] and Sorensen et al. [44], in which the T790M mutation was detected in 21 (30%) of 75 and 9 (39%) of 23 blood samples from patients with clinical progressive disease. Most interestingly, several studies demonstrated that monitoring the EGFR mutations in cfDNA allows for the detection of the T790M mutation up to 344 days (range, 15–344 days) before radiographic documentation of disease progression [42, 44]. Additionally, Patients whose EGFR mutations switched from positive to negative after chemotherapy achieved a better partial response than patients with a reversal in mutation status [45], indicating that the high specificity of cfDNA could serve as an effective test to estimate the effect of chemotherapy.
The AUC is an established global measure of performance of diagnostic tests. According to the criteria, 0.9 < AUC < 1 indicates high diagnostic accuracy [46]. Our result showed that the AUCs of all EGFR mutations, the exon 19 deletion, and the L858R point mutation were 0.9208, 0.9583, and 0.9605, respectively, indicating high diagnostic accuracy of cfDNA. Likelihood ratios are alternative statistical parameters to summarize diagnostic accuracy and values > 10 and < 0.1 are considered to provide strong evidence to rule in or rule out diagnoses, respectively [47]. In the present study, the PLR was > 10, indicating that cfDNA accurately confirmed the presences of EGFR mutations (Table 3). Diagnostic odds ratio (DOR) is a single indicator of test performance that combines the strengths of sensitivity and specificity with the advantage of accuracy. The value of a DOR ranges from 0 to infinity, with higher values indicating better discriminatory test performance [48]. Our results showed that cfDNA had high diagnostic performance with DORs of 34.36, 84.74 and 91.28 for detection of all EGFR mutations, the exon 19 deletion, and the L858R point mutation. We used Spearman correlation coefficients and p values to assess the threshold effect, which is a major source of intra-study heterogeneity. The p values for all EGFR mutations, the exon 19 deletion, and the L858R point mutation were 0.938, 0.450, and 0.873, respectively, indicating that the threshold effect was not significant. Thus, meta-regression analysis was performed to detect the source of heterogeneity, but, unfortunately, none of the analyzed covariates was found to be the source of heterogeneity (Table 4).
Various methods can be used to detect EGFR mutations in cfDNA, such us allele-specific PCR (AS-PCR) [15], peptide nucleic acid-locked nucleic acid polymerase chain reaction (PNA-LNA-PCR) [18], amplification refractory mutation system (ARMS) [20], high resolution melting (HRM) [22], mutant-enriched (ME)-PCR [26], and denaturing high-performance liquid chromatography (DHPLC) [29]. Our results showed that the sensitivities of PNA-LNA PCR, AS-PCR, and HRM were higher than those of ARMS and ME-PCR, but the specificity of ARMS was the highest among the other tests. Analysis of methods for detection of EGFR mutations in plasma demonstrated that ARMS had highest specificity, as compared with the other methods [38]. Although cfDNA can be extracted from either plasma or serum, our results showed that cfDNA extracted from serum had higher diagnostic accuracy than that extracted from plasma (Table 3).
There were some limitations to this study that should be addressed. First, chemotherapy can change the EGFR status [45], which could lead to analytical inconsistencies between tissues and cfDNA in blood collected after treatment. Second, although we accessed the threshold effect and performed meta-regression analysis, high heterogeneity was detected, but none of the analyzed factors was found to be the source of the heterogeneity. Therefore, other factors, such as sex, smoking status, or tumor size may have been the cause of the observed heterogeneity. Third, publication bias was detected when the performance of cfDNA to detect the exon 19 deletion was analyzed; therefore, we conducted sensitivity analysis and found that the pooled results were not affected by the inclusion of individual studies.
In conclusion, cfDNA offers an effective and noninvasive method to detect EGFR mutation status in NSCLC. Due to its high specificity and noninvasive characteristics, cfDNA analysis presents a promising method to screen for mutations in NSCLC and predict patient response to EGFR-TKI treatment, dynamically assess treatment outcome, and facilitate early detection of resistance mutations.
MATERIALS AND METHODS
Search strategy
A comprehensive search of the PubMed (http://www.ncbi.nlm.nih.gov/pubmed) and Google Scholar (http://www.scholar.google.com/) databases using the keywords “cell free DNA OR circulating DNA OR circulating tumor DNA OR serum DNA OR plasma DNA” AND “lung cancer OR non-small cell lung cancer” AND “EGFR OR Epidermal Growth Factor Receptor OR erbB1” was conducted to identify relevant studies published before September 28, 2015. In addition, the references from the retrieved articles that matched our inclusion criteria were manually searched.
Inclusion and exclusion criteria
The inclusion criteria for studies were as follows: (a) a histopathological diagnosis of NSCLC; (b) matched tissue and cfDNA sample; (c) identification of EGFR mutation status both in tissue and cfDNA; (d) sufficient data to construct a diagnostic 2 × 2 table; and (e) enrollment of at least 15 patients. Studies were excluded if they were: (a) not written in English; (b) tumor tissue and blood samples were not paired; or (c) case reports or reviews. Two of the authors (X.Q. and J.L.) read the titles and abstracts independently, and excluded studies that did not meet the inclusion criteria. Then, the full texts were screened to determine if they met the inclusion criteria.
Data extraction
Two independent reviewers (YH.S. and MF.W.) assessed the articles. The name of the first author, year of publication, country, histologic type, tumor stage, distribution of age and sex, techniques used for EGFR mutation detection in cfDNA, serum or plasma, and true positive (TP), false positive (FP), false negative (FN), and true negative (TN) rates were collected from eligible studies. When EGFR mutations were detected by multiple methods, the method with the best sensitivity or specificity was extracted.
Quality assessment
Quality assessment of diagnostic accuracy studies 2 (QUADAS-2) is a revised tool for the quality assessment of diagnostic accuracy studies [49]. The QUADAS-2 comprises four domains: patient selection, index test, reference standard, and flow and timing. Signaling questions are included to help judge risk of bias as “low,” “high,” or “unclear.”
Statistical analysis
The threshold effect was estimated with Meta-DiSc meta-analysis software [40]. A probability (p) value < 0.05 was considered to reflect a significant threshold effect. Heterogeneity due to a non-threshold effect was determined using the Q test and the inconsistency index (I2) test with p ≤ 0.05 and I2 ≥ 50% indicating significant heterogeneity. Meta-regression analysis was conducted to detect the source of heterogeneity. According to the heterogeneity test results, a random or fixed model was used to pool the sensitivity/specificity rates, PLR, NLR, DOR, and corresponding 95% CI. SROC and AUC were also calculated. Publication bias and sensitivity analyses were performed using STATA software (version 11.0; StataCorp LP, College Station, TX, USA), while all other analyses were performed using Meta-DiSc (version 1.4) meta-analysis software [40].
ACKNOWLEDGMENTS AND FUNDING
This study was supported by the National Natural Science Foundation of China (Grant no. 81270092).
CONFLICTS OF INTEREST
None.
REFERENCES
1. Siegel RL, Miller KD, Jemal A. Cancer statistics, 2015. CA Cancer J Clin. 2015; 65:5–29.
2. DeSantis CE, Lin CC, Mariotto AB, Siegel RL, Stein KD, Kramer JL, Alteri R, Robbins AS, Jemal A. Cancer treatment and survivorship statistics, 2014. CA Cancer J Clin. 2014; 64:252–271.
3. Piotrowska Z, Sequist LV. Epidermal Growth Factor Receptor-Mutant Lung Cancer: New Drugs, New Resistance Mechanisms, and Future Treatment Options. Cancer J. 2015; 21:371–377.
4. Sharma SV, Bell DW, Settleman J, Haber DA. Epidermal growth factor receptor mutations in lung cancer. Nat Rev Cancer. 2007; 7:169–181.
5. Langer CJ. Epidermal growth factor receptor inhibition in mutation-positive non-small-cell lung cancer: is afatinib better or simply newer? J Clin Oncol. 2013; 31:3303–3306.
6. Gridelli C, Ciardiello F, Gallo C, Feld R, Butts C, Gebbia V, Maione P, Morgillo F, Genestreti G, Favaretto A, Leighl N, Wierzbicki R, Cinieri S, et al. First-line erlotinib followed by second-line cisplatin-gemcitabine chemotherapy in advanced non-small-cell lung cancer: the TORCH randomized trial. J Clin Oncol. 2012; 30:3002–3011.
7. Siegelin MD, Borczuk AC. Epidermal growth factor receptor mutations in lung adenocarcinoma. Lab Invest. 2014; 94:129–137.
8. Jackman DM, Yeap BY, Sequist LV, Lindeman N, Holmes AJ, Joshi VA, Bell DW, Huberman MS, Halmos B, Rabin MS, Haber DA, Lynch TJ, Meyerson M, et al. Exon 19 deletion mutations of epidermal growth factor receptor are associated with prolonged survival in non-small cell lung cancer patients treated with gefitinib or erlotinib. Clin Cancer Res. 2006; 12:3908–3914.
9. Riely GJ, Pao W, Pham D, Li AR, Rizvi N, Venkatraman ES, Zakowski MF, Kris MG, Ladanyi M, Miller VA. Clinical course of patients with non-small cell lung cancer and epidermal growth factor receptor exon 19 and exon 21 mutations treated with gefitinib or erlotinib. Clin Cancer Res. 2006; 12:839–844.
10. Mitsudomi T, Kosaka T, Endoh H, Horio Y, Hida T, Mori S, Hatooka S, Shinoda M, Takahashi T, Yatabe Y. Mutations of the epidermal growth factor receptor gene predict prolonged survival after gefitinib treatment in patients with non-small-cell lung cancer with postoperative recurrence. J Clin Oncol. 2005; 23:2513–2520.
11. Diaz LA Jr, Bardelli A. Liquid biopsies: genotyping circulating tumor DNA. J Clin Oncol. 2014; 32:579–586.
12. Gerlinger M, Rowan AJ, Horswell S, Larkin J, Endesfelder D, Gronroos E, Martinez P, Matthews N, Stewart A, Tarpey P, Varela I, Phillimore B, Begum S, et al. Intratumor heterogeneity and branched evolution revealed by multiregion sequencing. N Engl J Med. 2012; 366:883–892.
13. Murtaza M, Dawson SJ, Tsui DW, Gale D, Forshew T, Piskorz AM, Parkinson C, Chin SF, Kingsbury Z, Wong AS, Marass F, Humphray S, Hadfield J, et al. Non-invasive analysis of acquired resistance to cancer therapy by sequencing of plasma DNA. Nature. 2013; 497:108–112.
14. Uchida J, Kato K, Kukita Y, Kumagai T, Nishino K, Daga H, Nagatomo I, Inoue T, Kimura M, Oba S, Ito Y, Takeda K, Imamura F. Diagnostic Accuracy of Noninvasive Genotyping of EGFR in Lung Cancer Patients by Deep Sequencing of Plasma Cell-Free DNA. Clin Chem. 2015; 61:1191–1196.
15. Mok T, Wu YL, Lee JS, Yu CJ, Sriuranpong V, Sandoval-Tan J, Ladrera G, Thongprasert S, Srimuninnimit V, Liao M, Zhu Y, Zhou C, Fuerte F, et al. Detection and Dynamic Changes of EGFR Mutations from Circulating Tumor DNA as a Predictor of Survival Outcomes in NSCLC Patients Treated with First-line Intercalated Erlotinib and Chemotherapy. Clin Cancer Res. 2015; 21:3196–3203.
16. Douillard JY, Ostoros G, Cobo M, Ciuleanu T, Cole R, McWalter G, Walker J, Dearden S, Webster A, Milenkova T, McCormack R. Gefitinib treatment in EGFR mutated caucasian NSCLC: circulating-free tumor DNA as a surrogate for determination of EGFR status. J Thorac Oncol. 2014; 9:1345–1353.
17. Zhu G, Ye X, Dong Z, Lu YC, Sun Y, Liu Y, McCormack R, Gu Y, Liu X. Highly Sensitive Droplet Digital PCR Method for Detection of EGFR-Activating Mutations in Plasma Cell-Free DNA from Patients with Advanced Non-Small Cell Lung Cancer. J Mol Diagn. 2015; 17:265–272.
18. Lam DC, Tam TC, Lau KM, Wong WM, Hui CK, Lam JC, Wang JK, Lui MM, Ho JC, Ip MS. Plasma EGFR Mutation Detection Associated With Survival Outcomes in Advanced-Stage Lung Cancer. Clin Lung Cancer. 2015; 16:507–13. doi: 10.1016/j.cllc.2015.06.003.
19. Weber B, Meldgaard P, Hager H, Wu L, Wei W, Tsai J, Khalil A, Nexo E, Sorensen BS. Detection of EGFR mutations in plasma and biopsies from non-small cell lung cancer patients by allele-specific PCR assays. BMC Cancer. 2014; 14:294.
20. Li X, Ren R, Ren S, Chen X, Cai W, Zhou F, Zhang Y, Su C, Zhao C, Li J, Cheng N, Zhao M, Zhou C. Peripheral blood for epidermal growth factor receptor mutation detection in non-small cell lung cancer patients. Transl Oncol. 2014; 7:341–348.
21. Wang S, Han X, Hu X, Wang X, Zhao L, Tang L, Feng Y, Wu D, Sun Y, Shi Y. Clinical significance of pretreatment plasma biomarkers in advanced non-small cell lung cancer patients. Clin Chim Acta. 2014; 430:63–70.
22. Jing CW, Wang Z, Cao HX, Ma R, Wu JZ. High resolution melting analysis for epidermal growth factor receptor mutations in formalin-fixed paraffin-embedded tissue and plasma free DNA from non-small cell lung cancer patients. Asian Pac J Cancer Prev. 2014; 14:6619–6623.
23. Kim HR, Lee SY, Hyun DS, Lee MK, Lee HK, Choi CM, Yang SH, Kim YC, Lee YC, Kim SY, Jang SH, Lee JC, Lee KY. Detection of EGFR mutations in circulating free DNA by PNA-mediated PCR clamping. J Exp Clin Cancer Res. 2013; 32:50.
24. Liu X, Lu Y, Zhu G, Lei Y, Zheng L, Qin H, Tang C, Ellison G, McCormack R, Ji Q. The diagnostic accuracy of pleural effusion and plasma samples versus tumour tissue for detection of EGFR mutation in patients with advanced non-small cell lung cancer: comparison of methodologies. J Clin Pathol. 2013; 66:1065–1069.
25. Hu C, Liu X, Chen Y, Sun X, Gong Y, Geng M, Bi L. Direct serum and tissue assay for EGFR mutation in non-small cell lung cancer by high-resolution melting analysis. Oncol Rep. 2012; 28:1815–1821.
26. Zhao X, Han RB, Zhao J, Wang J, Yang F, Zhong W, Zhang L, Li LY, Wang MZ. Comparison of epidermal growth factor receptor mutation statuses in tissue and plasma in stage I–IV non-small cell lung cancer patients. Respiration. 2013; 85:119–125.
27. Kim ST, Jung HY, Sung JS, Jo UH, Tanaka T, Hagiwara K, Park KH, Shin SW, Kim JS, Kim YH. Can serum be used for analyzing the EGFR mutation status in patients with advanced non-small cell lung cancer? Am J Clin Oncol. 2013; 36:57–63.
28. Goto K, Ichinose Y, Ohe Y, Yamamoto N, Negoro S, Nishio K, Itoh Y, Jiang H, Duffield E, McCormack R, Saijo N, Mok T, Fukuoka M. Epidermal growth factor receptor mutation status in circulating free DNA in serum: from IPASS, a phase III study of gefitinib or carboplatin/paclitaxel in non-small cell lung cancer. J Thorac Oncol. 2012; 7:115–121.
29. Huang Z, Wang Z, Bai H, Wu M, An T, Zhao J, Yang L, Duan J, Zhuo M, Wang Y. The detection of EGFR mutation status in plasma is reproducible and can dynamically predict the efficacy of EGFR-TKI. Thoracic Cancer. 2012; 3:334–340.
30. Jiang B, Liu F, Yang L, Zhang W, Yuan H, Wang J, Huang G. Serum detection of epidermal growth factor receptor gene mutations using mutant-enriched sequencing in Chinese patients with advanced non-small cell lung cancer. J Int Med Res. 2011; 39:1392–1401.
31. Sriram KB, Tan ME, Savarimuthu SM, Wright CM, Relan V, Stockwell RE, Clarke BE, Duhig EE, Yang IA, Bowman RV, Fong KM. Screening for activating EGFR mutations in surgically resected nonsmall cell lung cancer. Eur Respir J. 2011; 38:903–910.
32. He C, Liu M, Zhou C, Zhang J, Ouyang M, Zhong N, Xu J. Detection of epidermal growth factor receptor mutations in plasma by mutant-enriched PCR assay for prediction of the response to gefitinib in patients with non-small-cell lung cancer. Int J Cancer. 2009; 125:2393–2399.
33. Kimura H, Suminoe M, Kasahara K, Sone T, Araya T, Tamori S, Koizumi F, Nishio K, Miyamoto K, Fujimura M, Nakao S. Evaluation of epidermal growth factor receptor mutation status in serum DNA as a predictor of response to gefitinib (IRESSA). Br J Cancer. 2007; 97:778–784.
34. Bai H, Mao L, Wang HS, Zhao J, Yang L, An TT, Wang X, Duan CJ, Wu NM, Guo ZQ, Liu YX, Liu HN, Wang YY, et al. Epidermal growth factor receptor mutations in plasma DNA samples predict tumor response in Chinese patients with stages IIIB to IV non-small-cell lung cancer. J Clin Oncol. 2009; 27:2653–2659.
35. Kuang Y, Rogers A, Yeap BY, Wang L, Makrigiorgos M, Vetrand K, Thiede S, Distel RJ, Janne PA. Noninvasive detection of EGFR T790M in gefitinib or erlotinib resistant non-small cell lung cancer. Clin Cancer Res. 2009; 15:2630–2636.
36. Couraud S, Vaca-Paniagua F, Villar S, Oliver J, Schuster T, Blanche H, Girard N, Tredaniel J, Guilleminault L, Gervais R, Prim N, Vincent M, Margery J, et al. Noninvasive diagnosis of actionable mutations by deep sequencing of circulating free DNA in lung cancer from never-smokers: a proof-of-concept study from BioCAST/IFCT-1002. Clin Cancer Res. 2014; 20:4613–4624.
37. Zhang H, Liu D, Li S, Zheng Y, Yang X, Li X, Zhang Q, Qin N, Lu J, Ren-Heidenreich L, Yang H, Wu Y, Zhang X, et al. Comparison of EGFR signaling pathway somatic DNA mutations derived from peripheral blood and corresponding tumor tissue of patients with advanced non-small-cell lung cancer using liquidchip technology. J Mol Diagn. 2013; 15:819–826.
38. Xu F, Wu J, Xue C, Zhao Y, Jiang W, Lin L, Wu X, Lu Y, Bai H, Xu J, Zhu G, Zhang L. Comparison of different methods for detecting epidermal growth factor receptor mutations in peripheral blood and tumor tissue of non-small cell lung cancer as a predictor of response to gefitinib. Onco Targets Ther. 2012; 5:439–447.
39. Karachaliou N, Mayo-de las Casas C, Queralt C, de Aguirre I, Melloni B, Cardenal F, Garcia-Gomez R, Massuti B, Sanchez JM, Porta R, Ponce-Aix S, Moran T, Carcereny E, et al. Association of EGFR L858R Mutation in Circulating Free DNA With Survival in the EURTAC Trial. JAMA Oncol. 2015; 1:149–157.
40. Zamora J, Abraira V, Muriel A, Khan K, Coomarasamy A. Meta-DiSc: a software for meta-analysis of test accuracy data. BMC Med Res Methodol. 2006; 6:31.
41. Que D, Xiao H, Zhao B, Zhang X, Wang Q, Xiao H, Wang G. EGFR mutation status in plasma and tumor tissues in non-small cell lung cancer serves as a predictor of response to EGFR-TKI treatment. Cancer biology & therapy. 2016:1–8.
42. Lee JY, Qing X, Xiumin W, Yali B, Chi S, Bak SH, Lee HY, Sun JM, Lee SH, Ahn JS, Cho EK, Kim DW, Kim HR, et al. Longitudinal monitoring of EGFR mutations in plasma predicts outcomes of NSCLC patients treated with EGFR TKIs: Korean Lung Cancer Consortium (KLCC-12-02). Oncotarget. 2016; 7:6984–93. doi: 10.18632/oncotarget.6874.
43. Sakai K, Horiike A, Irwin DL, Kudo K, Fujita Y, Tanimoto A, Sakatani T, Saito R, Kaburaki K, Yanagitani N, Ohyanagi F, Nishio M, Nishio K. Detection of epidermal growth factor receptor T790M mutation in plasma DNA from patients refractory to epidermal growth factor receptor tyrosine kinase inhibitor. Cancer science. 2013; 104:1198–1204.
44. Sorensen BS, Wu L, Wei W, Tsai J, Weber B, Nexo E, Meldgaard P. Monitoring of epidermal growth factor receptor tyrosine kinase inhibitor-sensitizing and resistance mutations in the plasma DNA of patients with advanced non-small cell lung cancer during treatment with erlotinib. Cancer. 2014; 120:3896–3901.
45. Bai H, Wang Z, Chen K, Zhao J, Lee JJ, Wang S, Zhou Q, Zhuo M, Mao L, An T, Duan J, Yang L, Wu M, et al. Influence of chemotherapy on EGFR mutation status among patients with non-small-cell lung cancer. J Clin Oncol. 2012; 30:3077–3083.
46. Vanagas G. Receiver operating characteristic curves and comparison of cardiac surgery risk stratification systems. Interact Cardiovasc Thorac Surg. 2004; 3:319–322.
47. Deeks JJ, Altman DG. Diagnostic tests 4: likelihood ratios. BMJ. 2004; 329:168–169.
48. Glas AS, Lijmer JG, Prins MH, Bonsel GJ, Bossuyt PM. The diagnostic odds ratio: a single indicator of test performance. J Clin Epidemiol. 2003; 56:1129–1135.
49. Whiting PF, Rutjes AW, Westwood ME, Mallett S, Deeks JJ, Reitsma JB, Leeflang MM, Sterne JA, Bossuyt PM. QUADAS-2: a revised tool for the quality assessment of diagnostic accuracy studies. Ann Intern Med. 2011; 155:529–536.