
INTRODUCTION
In 2012, more than 400,000 new cases of bladder cancer (BC) were diagnosed and 165,000 patients died worldwide [1]. As for the prevalence of BC, men are three times more frequently diagnosed with BC than women [2]. The reasons for this disparity between sexes are not fully understood. BC is pathologically classified into two groups: non-muscle-invasive BC (NMIBC) and muscle-invasive BC (MIBC). Most BC patients (approximately 50%–80%) are diagnosed with NMIBC and this disease can be treated by removing the tumor by transurethral approaches [3]. In NMIBC, disease may recur, and some patients (approximately 25%) progress to MIBC [3]. Patients with advanced BC are generally treated with combination chemotherapy (gemcitabine and cisplatin), but progression-free survival is of limited duration [4]. Therefore, it is important to elucidate the molecular mechanisms of recurrence and invasiveness of BC cells to develop new treatment strategies.
The discovery of non-coding RNA in the human genome changed approaches in cancer research [5, 6]. Molecular mechanisms of post transcriptional gene regulation by protein-coding RNA/non-coding RNA networks are being studied on a genome-wide scale. MicroRNA (miRNA) is a class of small non-coding RNAs, and they are known to be involved in the repression or degradation of target RNA transcripts in a sequence-dependent manner [7]. A single miRNA can regulate thousands of target transcripts, and more than 60% of protein-coding genes may be influenced by miRNAs [8, 9]. Accumulating evidence indicates that aberrantly expressed miRNAs disturb normally regulated RNA networks, leading to pathologic responses in cancer cells [6]. Strategies to identify aberrant expression of miRNA-mediated cancer pathways are being developed as a new direction in cancer research in the post genome sequencing era.
To seek out differentially expressed miRNAs in BC cells, we used BC clinical specimens to establish deep sequencing-based miRNA expression signatures [10]. In general, the guide-strand RNA from duplex miRNA is retained to direct recruitment of the RNA induced silencing complex (RISC) to target messenger RNAs, whereas the passenger-strand RNA is degraded [11–13]. Recently, we revealed that both strands of microRNA (miR)-144-5p and miR-144-3p derived from pre-miR-144 acted as tumor suppressors in BC cells [14]. Moreover, miR-144-5p (passenger-strand) directly targeted cyclin E1 and E2 in BC cells, suggesting that the passenger-strand of miRNA has a physiological role in cells [14].
In this study, we focused on miR-145-5p and miR-145-3p because these miRNAs were significantly downregulated in BC cells as determined in our deep sequencing signature [10]. It is well known that miR- 145- 5p functions as a tumor suppressor in several types of cancer, including BC [15]. However, the role of miR-145-3p on cancer cells is still ambiguous. The aims of the present study were to investigate the anti-tumor effects of miR-145-3p as well as miR-145-5p, and to determine the BC oncogenic pathways and target genes regulated by these miRNAs. The discovery that miR- 145- 5p and miR-145-3p coordinately regulate pathways and targets provides new insight into the mechanisms of BC progression and metastasis.
RESULTS
The expression levels of miR-145-5p and miR-145-3p in BC specimens and cell lines
We evaluated the expression levels of miR-145-5p and miR-145-3p in BC tissues (n = 69), normal bladder epithelia (NBE) (n = 12), and two BC cell lines (T24 and BOY). The expression levels of miR-145-5p and miR- 145- 3p were significantly lower in tumor tissues and BC cell lines compared with NBE (Figure 1A). Spearman’s rank test showed a positive correlation between the expression of these miRNAs (r = 0.986 and P < 0.0001) (Figure 1B). On the other hand, there were no significant relationships between any of the clinicopathological parameters (i.e., tumor grade, stage, metastasis, or survival rate) and the expression levels of miR-145-5p and miR-145-3p (data not shown).
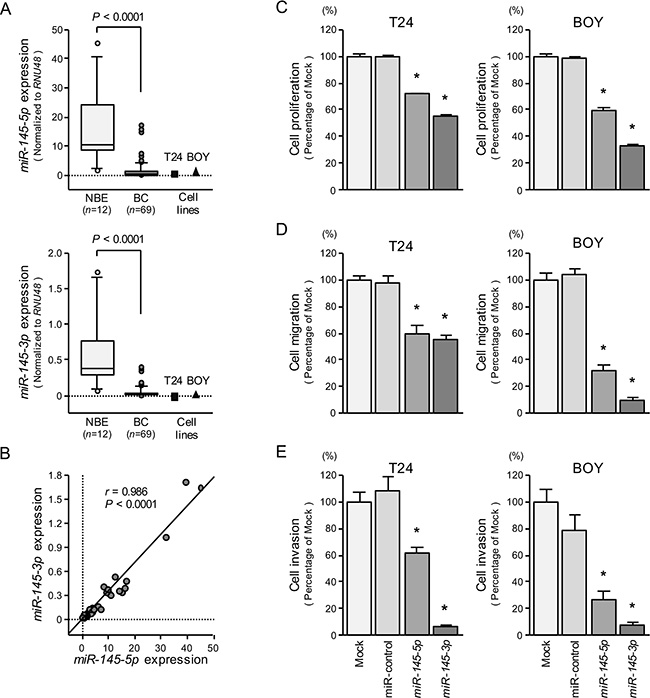
Figure 1: The expression levels of miR-145-5p and miR-145-3p, and their effects in BC cells. (A) Expression levels of miR- 145- 5p and miR-145-3p in clinical specimens and BC cell lines were determined by qRT-PCR. Data were normalized to RNU48 expression. (B) Correlation of miR-145-5p and miR-145-3p expression. (C) Cell growth was determined by XTT assays 72 hours after transfection with 10 nM miR-145-5p or miR-145-3p. *P < 0.0001. (D) Cell migration activity was determined by the wound-healing assays. *P < 0.0001. (E) Cell invasion activity was determined using Matrigel invasion assays. *P < 0.0001.
Effect of restoring miR-145-5p or miR-145- 3p expression on cell growth, migration, and invasion in BC cell lines
We performed gain-of-function studies using transfection of these miRNAs to investigate their functional roles. XTT, cell migration, and invasion assays demonstrated that cell proliferation, cell migration, and cell invasion were significantly inhibited in miR-145-5p and miR-145-3p transfectants in comparison with mock or miR-control transfectants (each P < 0.0001, Figure 1C, 1D, and 1E). These results suggested that miR-145-3p as well as miR-145-5p could have a tumor suppressive function in BC cells.
To investigate the synergistic effects of miR- 145- 5p and miR-145-3p, we performed proliferation, migration, and invasion assays with co-transfection of miR- 145-5p and miR-145-3p in BC cells (T24 and BOY), but they did not show synergistic effects of these miRNAs transfection (Supplementary Figure 1).
Effects of miR-145-5p and miR-145-3p transfection on apoptosis and cell cycle in BC cell lines
Because miR-145-5p and miR-145-3p transfection strongly inhibited cell proliferation in BC cell lines, we hypothesized that these miRNAs may induce apoptosis. Hence, we performed flow cytometric analyses to determine the number of apoptotic cells following restoration of miR- 145-5p or miR-145-3p expression.
The apoptotic cell numbers (apoptotic and early apoptotic cells) were significantly larger in miR-145-5p or miR-145-3p transfectants than in mock or miR-control transfectants (Figure 2A and 2C). Western blot analyses showed that cleaved PARP expression was significantly increased in miR-145-5p or miR-145-3p transfectants compared with mock or miR-control transfectants (Figure 2B and 2D).
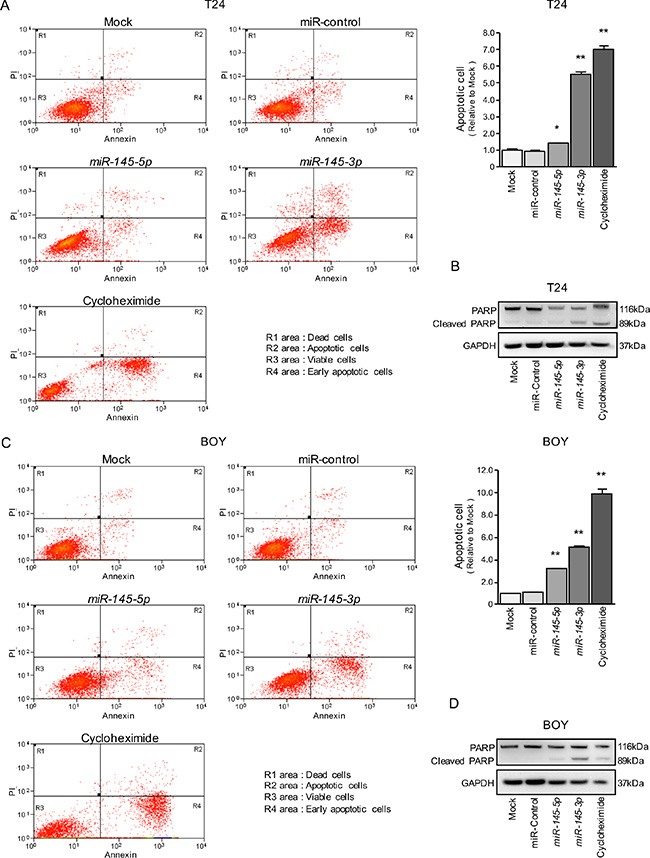
Figure 2: Effects of miR-145-5p and miR-145-3p on apoptosis. (A, C) Apoptosis assays were carried out using flow cytometry. Early apoptotic cells are in area R4 and apoptotic cells are in area R2. The normalized ratios of apoptotic cells are shown in the histograms. Cycloheximide (2 μg/mL) was used as positive control. *P = 0.0266 and **P < 0.0001. (B, D) Western blot analyses for apoptotic markers (cleaved PARP) in BC cell lines. GAPDH was used as a loading control.
We also investigated the cell cycle assays using miR-145-5p and miR-145-3p transfectants. The fraction of cells in the G2/M phase was significantly larger in miR-145-5p and miR-145-3p transfectants in T24 cells in comparison with mock or miR-control transfectants (Supplementary Figure 2). In contrast, miR-145-5p and miR-145-3p transfection induced cell cycle arrest at the G1 phase in BOY cells (Supplementary Figure 2). The reason why the cell cycle arrest (G2 arrest in T24 and G1 arrest in BOY) varies according to a cell types is a future problem.
Identification of common target genes regulated by miR-145-5p and miR-145-3p in BC cells
To gain further insight into the molecular mechanisms and pathways regulated by tumor suppressive miR-145-5p and miR-145-3p in BC cells, we used a combination of in silico analyses and gene expression analyses. Figure 3 shows our strategy to narrow down the common target genes of miR-145-5p and miR-145-3p.
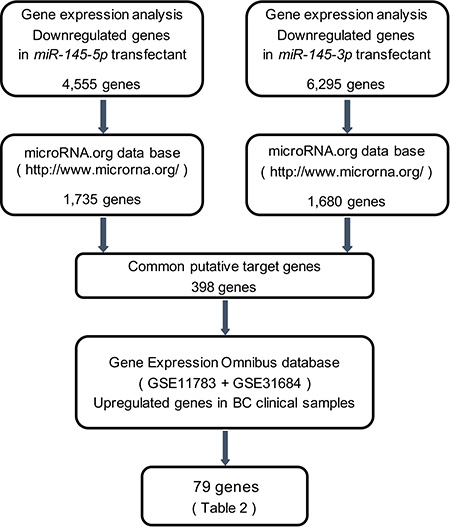
Figure 3: Flow chart illustrates the strategy for analysis of miR-145-5p and miR-145-3p target genes. A total of 4,555 and 6,295 downregulated genes in expression analysis of miR-145-5p and miR-145-3p transfected BC cell lines, respectively, (T24 and BOY) were selected as putative target genes. Next we merged the data of those selected genes and the microRNA.org database. The analyses showed 398 common putative target genes between miR-145-5p and miR-145-3p. We then analyzed gene expression with available GEO data sets (GSE11783 + GSE31684). The analyses showed that 79 genes were significantly upregulated in BC specimens compared with NBE.
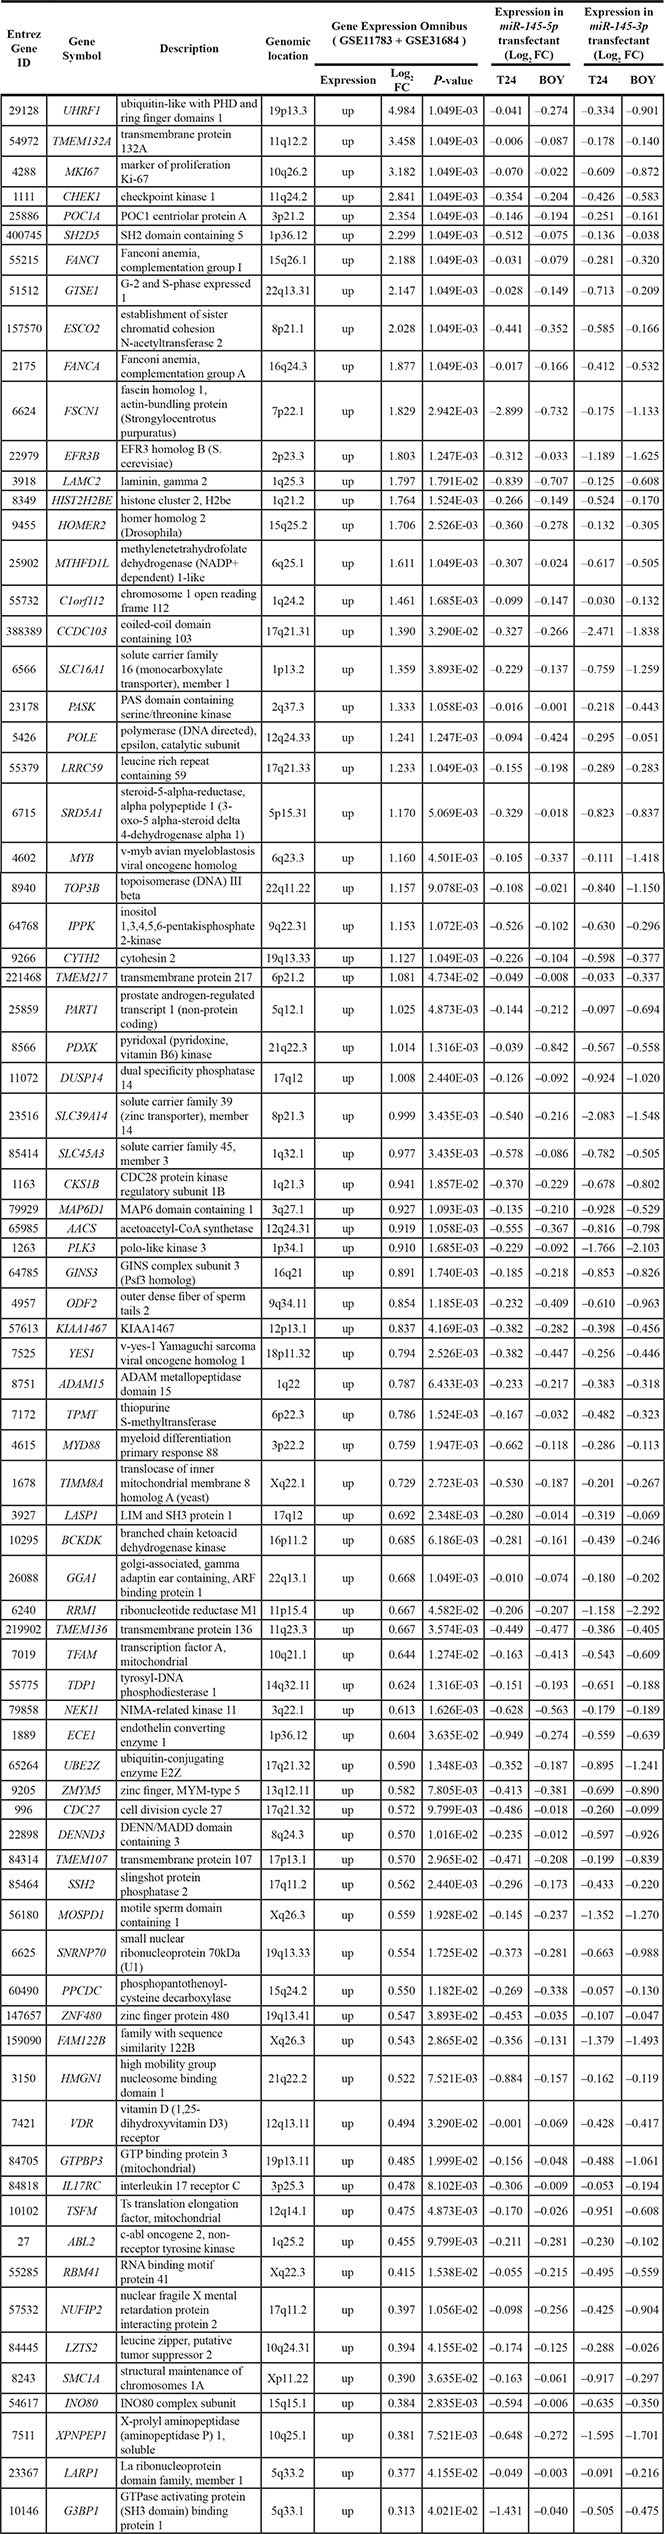
In gene expression analyses, a total of 4,555 and 6,295 genes were downregulated in miR-145-5p and miR- 145-3p transfectants, respectively, in comparison with control transfectants (Gene Expression Omnibus (GEO), accession number: GSE66498). Of those downregulated genes, 1,735 and 1,680 genes, respectively, had putative binding sites for miR-145-5p and miR-145- 3p in their 3′ untranslated regions (UTRs) according to the microRNA.org database. We found that there were 398 common genes targeted by both miRNAs, and among them, we ultimately identified 79 genes that were upregulated in the clinical BC samples from the GEO (accession numbers: GSE11783, GSE31684) (Table 1). We subsequently focused on the ubiquitin-like with PHD and ring finger domains 1 (UHRF1) gene because it was the top ranked gene in the list.
Table 1: Highly expressed genes putatively regulated by miR-145-5p and miR-145-3p
UHRF1 was a direct target of miR-145-5p and miR-145-3p in BC cells
We performed quantitative real-time RT-PCR (qRT-PCR) to validate that miR-145-5p and miR-145-3p repressed UHRF1 mRNA expression in BC cell lines, and we did indeed observe that it was significantly reduced in transfectants of these miRNAs in comparison with mock or miR-control transfectants (P < 0.0001 and P = 0.0036, Figure 4A). The protein expression levels of UHRF1 were also repressed in the miRNAs transfectants (Figure 4B).
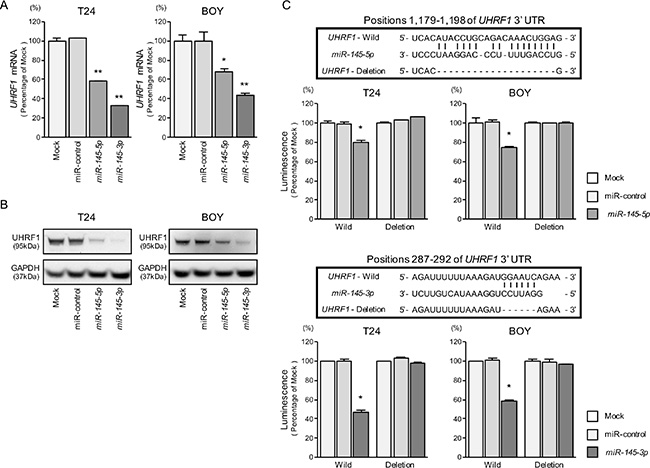
Figure 4: Direct regulation of UHRF1 by miR-145-5p and miR-145-3p. (A) UHRF1 mRNA expression was evaluated by qRT-PCR in T24 and BOY 72 hours after transfection with miR-145-5p and miR-145-3p. GUSB was used as an internal control. *P = 0.0036 and **P < 0.0001. (B) UHRF1 protein expression was evaluated by Western blot analyses in T24 and BOY 72–96 hours after transfection with miR-145-5p or miR-145-3p. GAPDH was used as a loading control. (C) miR-145-5p and miR-145-3p binding sites in the 3′ UTR of UHRF1 mRNA. Dual Luciferase reporter assays using vectors encoding putative miR-145-5p and miR-145-3p target sites of the UHRF 3′ UTR (positions 1,179–1,198 and 287–292, respectively) for both wild-type and deleted regions. Normalized data were calculated as ratios of Renilla/firefly luciferase activities. *P < 0.0001.
We carried out dual luciferase reporter assays in T24 and BOY cells to determine whether the UHRF1 gene was directly regulated by miR-145-5p/3p. The microRNA.org database predicted that there was one binding site for miR- 145-5p in the 3′ UTR of UHRF1 (position 1,179– 1,198); for miR-145-3p, there was a binding site in the 3′ UTR at position 287–292. We used vectors encoding the partial wild-type sequence of the 3′ UTR of the mRNA, including the predicted miR-145-5p or miR-145- 3p target sites. We found that the luminescence intensity was significantly reduced by co-transfection with these miRNAs and the vector carrying the wild-type 3′ UTR, whereas no reduction of luminescence was observed by transfection with the deletion vector (binding site had been removed) (P < 0.0001, Figure 4C). These suggested that either of miR-145-5p and miR-145-3p were directly bounded to specific sites in the 3′ UTR of UHRF1 mRNA.
Effects of silencing UHRF1 in BC cell lines
To investigate the functional role of UHRF1 in BC cells, we carried out loss-of-function studies by using si-UHRF1 transfectants. First, we evaluated the knockdown efficiency of si-UHRF1 transfection in BC cell lines. In the present study, we used two types of si- UHRF1 (si- UHRF1-1 and si-UHRF1-2). The qRT- PCR and Western blot analyses showed that both siRNAs effectively downregulated UHRF1 expression in both cell lines (Figure 5A and 5B).
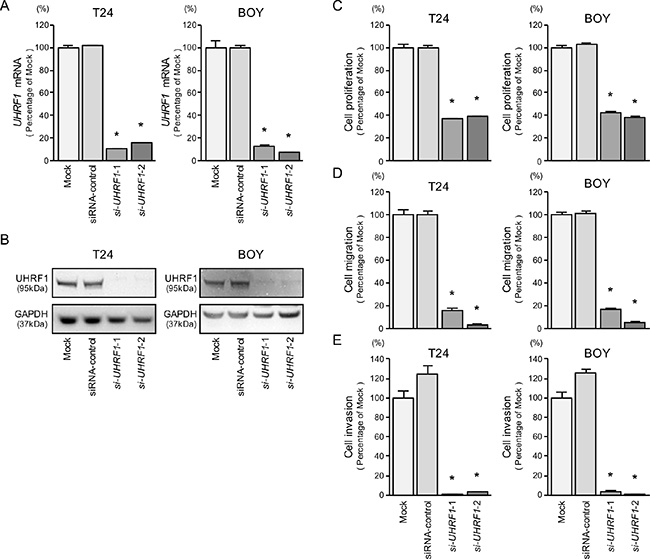
Figure 5: UHRF1 mRNA and protein expression after si-UHRF1 transfection and effects of UHRF1 silencing in BC cell lines. (A) UHRF1 mRNA expression was evaluated by qRT-PCR in T24 and BOY 72 hours after transfection with si-UHRF1-1 and si-UHRF1-2. GUSB was used as an internal control. (B) UHRF1 protein expression was evaluated by Western blot analysis in T24 and BOY 72 - 96 hours after transfection with miR-145-5p or miR-145-3p. GAPDH was used as a loading control. (C) Cell proliferation was determined with the XTT assays 72 hours after transfection with 10 nM si-UHRF1-1 or si-UHRF1-2. *P < 0.0001. (D) Cell migration activity was determined by wound-healing assays. *P < 0.0001. (E) Cell invasion activity was determined using Matrigel invasion assays. *P < 0.0001.
XTT, cell migration, and invasion assays demonstrated that cell proliferation, cell migration, and cell invasion were inhibited in si-UHRF1 transfectants in comparison with the mock or siRNA-control transfectant cells (each P < 0.0001, Figure 5C, 5D, and 5E).
In the apoptosis assays, the apoptotic cell numbers were significantly greater in si-UHRF1 transfectants than in mock or siRNA-control transfectants (Figure 6A and 6C). Western blot analyses showed that cleaved PARP expression was significantly increased in si-UHRF1 transfectants compared with mock or siRNA-control transfectants (Figure 6B and 6D).
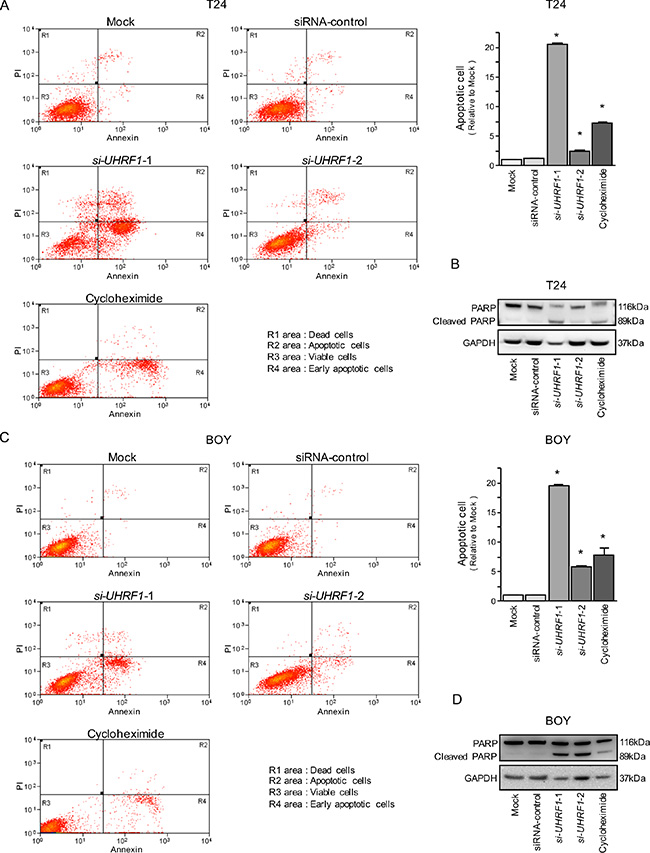
Figure 6: Effects of silencing UHRF1 on apoptosis in BC cell lines. (A, C) Apoptosis assays were carried out using flow cytometry. Early apoptotic cells are in area R4 and apoptotic cells are in area R2. The normalized ratios of the apoptotic cells are shown in the histogram. Cycloheximide (2 μg/mL) was used as a positive control. *P < 0.0001 (B, D) Western blot analyses for apoptotic markers (cleaved PARP) in BC cell lines. GAPDH was used as a loading control.
Expression of UHRF1 in BC clinical specimens
The qRT-PCR analyses showed that the expression level of UHRF1 mRNA was significantly upregulated in 69 BC specimens and 2 BC cell lines compared with 12 NBE (P < 0.0001, Figure 7A). Spearman’s rank test showed negative correlations between miR-145-5p/miR-145-3p expression and UHRF1 mRNA expression (r = –0.324 and –0.298, P = 0.0024 and 0.0051, Figure 7B). As shown in Figure 7C, the expression level of UHRF1 was significantly greater in high grade clinical BCs (P = 0.0135), MIBCs (T2 ≤) (P = 0.0379), BCs with positive lymph node invasion (N1) (P = 0.00182), and in BCs with positive distant metastasis (M1) (P = 0.0307) than in their counterparts. Kaplan-Meier analysis showed that the high UHRF1 expression group had significantly lower cause specific survival probabilities compared to the low UHRF1 expression group (P = 0.0259, Figure 8).
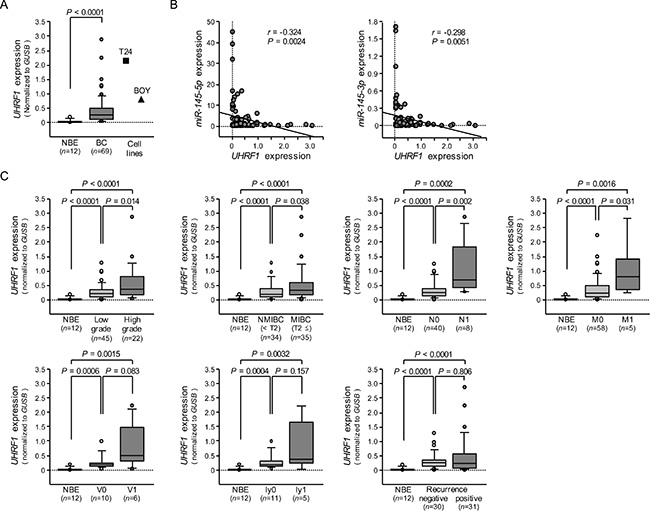
Figure 7: The expression level of UHRF1 mRNA in BC clinical specimens and cell lines, and association of UHRF1 expression with clinicopathological parameters. (A) Expression levels of UHRF1 in clinical specimens and BC cell lines were determined by qRT-PCR. Data were normalized to GUSB expression. (B) The correlated expression among miR-145-5p, miR-145-3p, and UHRF1. (C) Association of UHRF1 expression with clinicopathological parameters. Relationships between two variables were analyzed using the Mann-Whitney U test.
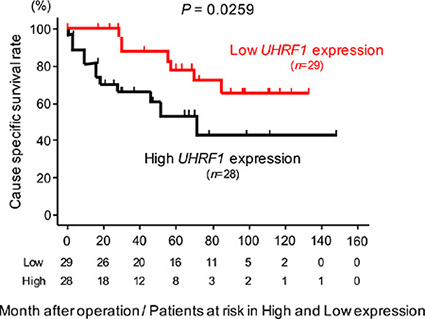
Figure 8: The association between the expression level of UHRF1 and cause specific survival rate. Kaplan-Meier survival curves for cause specific survival rates based on UHRF1 expression in 57 BC patients. P-values were calculated using the log-rank test.
We validated the expression status of UHRF1 in BC clinical specimens using immunohistochemical staining. UHRF1 was expressed moderately or strongly in several cancer lesions, and normal bladder tissues stained weakly (Figure 9).
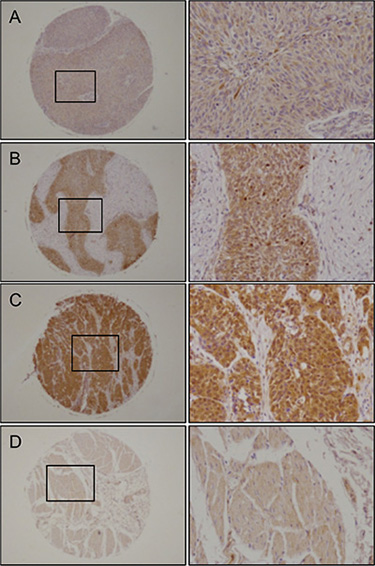
Figure 9: Immunohistochemical staining of UHRF1 in BC clinical specimens. UHRF1 was expressed more strongly in several cancer lesions than in noncancerous tissues. Left panel, original magnification ×40; Right panel, original magnification ×200. (A) Positively stained tumor lesion (High grade, T2bN0M0), (B) Positively stained tumor lesion (High grade, T1N0M0), (C) Positively stained tumor lesion (Low grade, T3N0M0), (D) Negative staining in normal bladder tissue.
Investigation of downstream genes regulated by UHRF1 in BC cells
To identify the downstream genes regulated by UHRF1, genome-wide gene expression analyses and in silico analyses were performed in two BC cell lines transfected with si-UHRF1. A total of 533 genes were downregulated (log2 FC < –1.5) by si-UHRF1 transfection, and a total of 704 genes were upregulated (log2 FC > 1.0) by si-UHRF1 transfection compared with negative control cells (GEO, accession number: GSE77790). Among the downregulated genes in the si-UHRF1 transfectants, 104 genes were upregulated in the BC clinical samples from GEO database (accession numbers: GSE11783, GSE31684), whereas among the upregulated genes, 62 genes were downregulated in the clinical BCs. These results imply that the 104 upregulated genes may act as oncogenes, and the 62 downregulated genes may act as tumor suppressors downstream from UHRF1 in BC (Tables 2 and 3).
Table 2: Significantly downregulated genes by si-UHRF1 in BC cell lines
Entrez Gene ID |
Gene Symbol |
Description |
Genomic location |
Gene Expression Omnibus |
Expression |
|||
|---|---|---|---|---|---|---|---|---|
Expression |
Log2FC |
P-value |
T24 |
BOY |
||||
7153 |
TOP2A |
topoisomerase (DNA) II alpha 170kDa |
17q21.2 |
up |
6.312 |
1.049E-03 |
–1.880 |
–1.681 |
29128 |
UHRF1 |
ubiquitin-like with PHD and ring finger domains 1 |
19p13.3 |
up |
4.984 |
1.049E-03 |
–3.213 |
–2.907 |
259266 |
ASPM |
asp (abnormal spindle) homolog, microcephaly associated (Drosophila) |
1q31.3 |
up |
4.299 |
1.049E-03 |
–3.431 |
–3.444 |
332 |
BIRC5 |
baculoviral IAP repeat containing 5 |
17q25.3 |
up |
4.110 |
1.049E-03 |
–2.258 |
–1.777 |
9928 |
KIF14 |
kinesin family member 14 |
1q32.1 |
up |
3.866 |
1.049E-03 |
–3.294 |
–1.544 |
1063 |
CENPF |
centromere protein F, 350/400kDa |
1q41 |
up |
3.576 |
1.049E-03 |
–2.613 |
–3.307 |
1894 |
ECT2 |
epithelial cell transforming 2 |
3q26.31 |
up |
3.469 |
1.049E-03 |
–1.928 |
–1.813 |
55247 |
NEIL3 |
nei endonuclease VIII-like 3 (E. coli) |
4q34.3 |
up |
3.428 |
1.049E-03 |
–1.728 |
–2.065 |
9401 |
RECQL4 |
RecQ protein-like 4 |
8q24.3 |
up |
3.414 |
1.049E-03 |
–1.751 |
–2.102 |
3832 |
KIF11 |
kinesin family member 11 |
10q23.33 |
up |
3.356 |
1.049E-03 |
–2.299 |
–1.657 |
57082 |
CASC5 |
cancer susceptibility candidate 5 |
15q15.1 |
up |
3.230 |
1.049E-03 |
–2.470 |
–2.188 |
151176 |
FAM132B |
family with sequence similarity 132, member B |
2q37.3 |
up |
3.100 |
1.058E-03 |
–2.420 |
–2.184 |
151246 |
SGOL2 |
shugoshin-like 2 (S. pombe) |
2q33.1 |
up |
2.694 |
1.049E-03 |
–3.124 |
–2.407 |
1062 |
CENPE |
centromere protein E, 312kDa |
4q24 |
up |
2.689 |
1.058E-03 |
–3.676 |
–3.218 |
23529 |
CLCF1 |
cardiotrophin-like cytokine factor 1 |
11q13.2 |
up |
2.646 |
1.049E-03 |
–1.905 |
–2.363 |
81930 |
KIF18A |
kinesin family member 18A |
11p14.1 |
up |
2.553 |
1.049E-03 |
–3.246 |
–2.128 |
7130 |
TNFAIP6 |
tumor necrosis factor, alpha-induced protein 6 |
2q23.3 |
up |
2.531 |
2.835E-03 |
–1.795 |
–2.735 |
55502 |
HES6 |
hes family bHLH transcription factor 6 |
2q37.3 |
up |
2.506 |
6.688E-03 |
–1.572 |
–1.508 |
5328 |
PLAU |
plasminogen activator, urokinase |
10q22.2 |
up |
2.244 |
1.740E-03 |
–2.417 |
–1.791 |
9824 |
ARHGAP11A |
Rho GTPase activating protein 11A |
15q13.3 |
up |
2.051 |
2.348E-03 |
–1.675 |
–1.613 |
23057 |
NMNAT2 |
nicotinamide nucleotide adenylyltransferase 2 |
1q25.3 |
up |
2.050 |
1.247E-03 |
–1.707 |
–1.863 |
59285 |
CACNG6 |
calcium channel, voltage-dependent, gamma subunit 6 |
19q13.42 |
up |
2.016 |
1.049E-03 |
–1.502 |
–1.763 |
675 |
BRCA2 |
breast cancer 2, early onset |
13q13.1 |
up |
2.015 |
1.049E-03 |
–1.764 |
–2.356 |
6524 |
SLC5A2 |
solute carrier family 5 (sodium/glucose cotransporter), member 2 |
16p11.2 |
up |
1.900 |
1.214E-03 |
–1.855 |
–1.569 |
79412 |
KREMEN2 |
kringle containing transmembrane protein 2 |
16p13.3 |
up |
1.893 |
1.348E-03 |
–2.309 |
–1.796 |
6274 |
S100A3 |
S100 calcium binding protein A3 |
1q21.3 |
up |
1.825 |
8.102E-03 |
–2.215 |
–1.848 |
5331 |
PLCB3 |
phospholipase C, beta 3 (phosphatidylinositol-specific) |
11q13.1 |
up |
1.790 |
1.049E-03 |
–2.219 |
–1.735 |
55349 |
CHDH |
choline dehydrogenase |
3p21.1 |
up |
1.743 |
1.049E-03 |
–1.926 |
–2.008 |
811 |
CALR |
calreticulin |
19p13.2 |
up |
1.652 |
1.049E-03 |
–1.554 |
–1.500 |
4987 |
OPRL1 |
opiate receptor-like 1 |
20q13.33 |
up |
1.627 |
2.626E-03 |
–1.927 |
–1.766 |
375248 |
ANKRD36 |
ankyrin repeat domain 36 |
2q11.2 |
up |
1.530 |
8.102E-03 |
–3.873 |
–1.791 |
441054 |
C4orf47 |
chromosome 4 open reading frame 47 |
4q35.1 |
up |
1.485 |
2.151E-02 |
–2.229 |
–2.522 |
201475 |
RAB12 |
RAB12, member RAS oncogene family |
18p11.22 |
up |
1.468 |
1.058E-03 |
–2.353 |
–2.947 |
286151 |
FBXO43 |
F-box protein 43 |
8q22.2 |
up |
1.463 |
2.396E-02 |
–1.528 |
–2.082 |
9091 |
PIGQ |
phosphatidylinositol glycan anchor biosynthesis, class Q |
16p13.3 |
up |
1.434 |
3.574E-03 |
–1.594 |
–1.693 |
81575 |
APOLD1 |
apolipoprotein L domain containing 1 |
12p13.1 |
up |
1.354 |
1.808E-03 |
–2.237 |
–2.383 |
132320 |
SCLT1 |
sodium channel and clathrin linker 1 |
4q28.2 |
up |
1.340 |
1.049E-03 |
–3.140 |
–3.098 |
100131211 |
TMEM194B |
transmembrane protein 194B |
2q32.2 |
up |
1.325 |
1.049E-03 |
–1.573 |
–1.967 |
153642 |
ARSK |
arylsulfatase family, member K |
5q15 |
up |
1.252 |
1.049E-03 |
–2.052 |
–1.875 |
21 |
ABCA3 |
ATP-binding cassette, sub-family A (ABC1), member 3 |
16p13.3 |
up |
1.170 |
4.892E-02 |
–1.879 |
–1.831 |
55036 |
CCDC40 |
coiled-coil domain containing 40 |
17q25.3 |
up |
1.160 |
1.049E-03 |
–1.562 |
–1.531 |
84259 |
DCUN1D5 |
DCN1, defective in cullin neddylation 1, domain containing 5 |
11q22.3 |
up |
1.151 |
1.247E-03 |
–1.591 |
–1.993 |
80381 |
CD276 |
CD276 molecule |
15q24.1 |
up |
1.146 |
1.072E-03 |
–2.656 |
–2.096 |
6487 |
ST3GAL3 |
ST3 beta-galactoside alpha-2,3-sialyltransferase 3 |
1p34.1 |
up |
1.139 |
1.049E-03 |
–1.828 |
–2.380 |
5351 |
PLOD1 |
procollagen-lysine, 2-oxoglutarate 5-dioxygenase 1 |
1p36.22 |
up |
1.104 |
2.942E-03 |
–1.650 |
–1.570 |
343099 |
CCDC18 |
coiled-coil domain containing 18 |
1p22.1 |
up |
1.075 |
1.578E-03 |
–3.521 |
–2.428 |
30818 |
KCNIP3 |
Kv channel interacting protein 3, calsenilin |
2q11.1 |
up |
1.069 |
2.723E-03 |
–3.678 |
–2.733 |
10051 |
SMC4 |
structural maintenance of chromosomes 4 |
3q25.33 |
up |
1.066 |
1.578E-03 |
–2.612 |
–1.745 |
51427 |
ZNF107 |
zinc finger protein 107 |
7q11.21 |
up |
1.040 |
1.316E-03 |
–2.527 |
–2.104 |
10592 |
SMC2 |
structural maintenance of chromosomes 2 |
9q31.1 |
up |
1.032 |
6.688E-03 |
–3.520 |
–2.180 |
20 |
ABCA2 |
ATP-binding cassette, sub-family A (ABC1), member 2 |
9q34.3 |
up |
0.965 |
1.372E-02 |
–1.511 |
–2.291 |
55183 |
RIF1 |
replication timing regulatory factor 1 |
2q23.3 |
up |
0.960 |
1.058E-03 |
–1.712 |
–1.605 |
9898 |
UBAP2L |
ubiquitin associated protein 2-like |
1q21.3 |
up |
0.952 |
1.049E-03 |
–1.587 |
–2.301 |
29780 |
PARVB |
parvin, beta |
22q13.31 |
up |
0.952 |
1.096E-02 |
–3.288 |
–1.888 |
9585 |
KIF20B |
kinesin family member 20B |
10q23.31 |
up |
0.933 |
5.720E-03 |
–2.282 |
–3.122 |
9534 |
ZNF254 |
zinc finger protein 254 |
19p12 |
up |
0.920 |
3.863E-03 |
–2.072 |
–2.662 |
57520 |
HECW2 |
HECT, C2 and WW domain containing E3 ubiquitin protein ligase 2 |
2q32.3 |
up |
0.884 |
3.179E-03 |
–1.838 |
–1.958 |
84083 |
ZRANB3 |
zinc finger, RAN-binding domain containing 3 |
2q21.3 |
up |
0.873 |
1.578E-03 |
–1.987 |
–1.915 |
6498 |
SKIL |
SKI-like proto-oncogene |
3q26.2 |
up |
0.859 |
1.808E-03 |
–2.709 |
–1.845 |
64770 |
CCDC14 |
coiled-coil domain containing 14 |
3q21.1 |
up |
0.842 |
6.943E-03 |
–2.453 |
–1.711 |
254065 |
BRWD3 |
bromodomain and WD repeat domain containing 3 |
Xq21.1 |
up |
0.808 |
1.393E-03 |
–1.852 |
–2.546 |
22973 |
LAMB2P1 |
laminin, beta 2 pseudogene 1 |
3p21.31 |
up |
0.804 |
7.521E-03 |
–2.336 |
–2.311 |
7525 |
YES1 |
YES proto-oncogene 1, Src family tyrosine kinase |
18p11.32 |
up |
0.794 |
2.526E-03 |
–3.127 |
–2.099 |
1984 |
EIF5A |
eukaryotic translation initiation factor 5A |
17p13.1 |
up |
0.793 |
5.486E-03 |
–2.297 |
–2.018 |
22852 |
ANKRD26 |
ankyrin repeat domain 26 |
10p12.1 |
up |
0.787 |
3.303E-03 |
–2.798 |
–2.663 |
23322 |
RPGRIP1L |
RPGRIP1-like |
16q12.2 |
up |
0.778 |
1.182E-02 |
–1.517 |
–1.806 |
79677 |
SMC6 |
structural maintenance of chromosomes 6 |
2p24.2 |
up |
0.764 |
8.401E-03 |
–1.909 |
–2.083 |
84920 |
ALG10 |
ALG10, alpha-1,2-glucosyltransferase |
12p11.1 |
up |
0.763 |
6.688E-03 |
–1.828 |
–2.360 |
8570 |
KHSRP |
KH-type splicing regulatory protein |
19p13.3 |
up |
0.762 |
3.303E-03 |
–1.767 |
–1.820 |
5819 |
PVRL2 |
poliovirus receptor-related 2 (herpesvirus entry mediator B) |
19q13.32 |
up |
0.757 |
9.078E-03 |
–3.014 |
–2.465 |
51575 |
ESF1 |
ESF1, nucleolar pre-rRNA processing protein, homolog (S. cerevisiae) |
20p12.1 |
up |
0.755 |
9.430E-03 |
–1.786 |
–1.732 |
51361 |
HOOK1 |
hook microtubule-tethering protein 1 |
1p32.1 |
up |
0.689 |
3.067E-02 |
–2.156 |
–2.000 |
10198 |
MPHOSPH9 |
M-phase phosphoprotein 9 |
12q24.31 |
up |
0.667 |
1.947E-03 |
–2.113 |
–1.502 |
4983 |
OPHN1 |
oligophrenin 1 |
Xq12 |
up |
0.632 |
5.277E-03 |
–2.278 |
–1.747 |
4976 |
OPA1 |
optic atrophy 1 (autosomal dominant) |
3q29 |
up |
0.619 |
2.169E-03 |
–2.190 |
–1.526 |
168850 |
ZNF800 |
zinc finger protein 800 |
7q31.33 |
up |
0.611 |
1.227E-02 |
–1.807 |
–1.867 |
26272 |
FBXO4 |
F-box protein 4 |
5p13.1 |
up |
0.611 |
3.512E-02 |
–2.224 |
–2.445 |
7390 |
UROS |
uroporphyrinogen III synthase |
10q26.13 |
up |
0.605 |
6.433E-03 |
–3.120 |
–2.062 |
4683 |
NBN |
nibrin |
8q21.3 |
up |
0.590 |
5.720E-03 |
–2.986 |
–1.966 |
79670 |
ZCCHC6 |
zinc finger, CCHC domain containing 6 |
9q21.33 |
up |
0.587 |
5.486E-03 |
–2.353 |
–1.839 |
79573 |
TTC13 |
tetratricopeptide repeat domain 13 |
1q42.2 |
up |
0.587 |
6.943E-03 |
–1.740 |
–2.064 |
50840 |
TAS2R14 |
taste receptor, type 2, member 14 |
12p13.2 |
up |
0.574 |
1.598E-02 |
–1.947 |
–1.509 |
79042 |
TSEN34 |
TSEN34 tRNA splicing endonuclease subunit |
19q13.42 |
up |
0.570 |
1.138E-02 |
–2.455 |
–1.761 |
6801 |
STRN |
striatin, calmodulin binding protein |
2p22.2 |
up |
0.563 |
2.723E-03 |
–1.964 |
–2.434 |
3597 |
IL13RA1 |
interleukin 13 receptor, alpha 1 |
Xq24 |
up |
0.552 |
2.075E-02 |
–2.460 |
–2.403 |
147657 |
ZNF480 |
zinc finger protein 480 |
19q13.41 |
up |
0.547 |
3.893E-02 |
–3.434 |
–3.276 |
8683 |
SRSF9 |
serine/arginine-rich splicing factor 9 |
12q24.31 |
up |
0.534 |
1.227E-02 |
–1.523 |
–2.098 |
252983 |
STXBP4 |
syntaxin binding protein 4 |
17q22 |
up |
0.516 |
2.151E-02 |
–1.776 |
–1.599 |
284325 |
C19orf54 |
chromosome 19 open reading frame 54 |
19q13.2 |
up |
0.510 |
4.734E-02 |
–1.614 |
–2.171 |
91147 |
TMEM67 |
transmembrane protein 67 |
8q22.1 |
up |
0.509 |
9.799E-03 |
–1.647 |
–2.069 |
114799 |
ESCO1 |
establishment of sister chromatid cohesion N-acetyltransferase 1 |
18q11.2 |
up |
0.495 |
4.873E-03 |
–2.173 |
–2.401 |
57670 |
KIAA1549 |
KIAA1549 |
7q34 |
up |
0.480 |
4.582E-02 |
–2.127 |
–1.789 |
6103 |
RPGR |
retinitis pigmentosa GTPase regulator |
Xp11.4 |
up |
0.467 |
3.290E-02 |
–1.583 |
–2.025 |
5700 |
PSMC1 |
proteasome (prosome, macropain) 26S subunit, ATPase, 1 |
14q32.11 |
up |
0.449 |
1.274E-02 |
–1.639 |
–1.711 |
253260 |
RICTOR |
RPTOR independent companion of MTOR, complex 2 |
5p13.1 |
up |
0.442 |
2.666E-02 |
–2.458 |
–1.683 |
23241 |
PACS2 |
phosphofurin acidic cluster sorting protein 2 |
14q32.33 |
up |
0.442 |
3.179E-03 |
–3.416 |
–2.028 |
27154 |
BRPF3 |
bromodomain and PHD finger containing, 3 |
6p21.31 |
up |
0.440 |
5.720E-03 |
–1.772 |
–2.598 |
7703 |
PCGF2 |
polycomb group ring finger 2 |
17q12 |
up |
0.439 |
2.865E-02 |
–1.828 |
–1.974 |
51105 |
PHF20L1 |
PHD finger protein 20-like 1 |
8q24.22 |
up |
0.383 |
9.078E-03 |
–3.492 |
–2.007 |
57697 |
FANCM |
Fanconi anemia, complementation group M |
14q21.2 |
up |
0.364 |
3.067E-02 |
–1.648 |
–1.627 |
9730 |
VPRBP |
Vpr (HIV-1) binding protein |
3p21.2 |
up |
0.363 |
2.075E-02 |
–2.342 |
–1.568 |
5378 |
PMS1 |
PMS1 postmeiotic segregation increased 1 (S. cerevisiae) |
2q32.2 |
up |
0.350 |
4.734E-02 |
–2.701 |
–1.616 |
255520 |
ELMOD2 |
ELMO/CED-12 domain containing 2 |
4q31.1 |
up |
0.334 |
4.582E-02 |
–2.360 |
–1.637 |
80124 |
VCPIP1 |
valosin containing protein (p97)/p47 complex interacting protein 1 |
8q13.1 |
up |
0.304 |
3.893E-02 |
–3.107 |
–2.286 |
Table 3: Significantly upregulated genes by si-UHRF1 in BC cell lines
Entrez Gene ID |
Gene Symbol |
Description |
Genomic location |
Gene Expression Omnibus |
Expression |
|||
|---|---|---|---|---|---|---|---|---|
Expression |
Log2FC |
P-value |
T24 |
BOY |
||||
3043 |
HBB |
hemoglobin, beta |
11p15.4 |
down |
–3.263 |
1.214E-03 |
1.204 |
2.109 |
137835 |
TMEM71 |
transmembrane protein 71 |
8q24.22 |
down |
–2.428 |
4.873E-03 |
2.813 |
3.920 |
8639 |
AOC3 |
amine oxidase, copper containing 3 |
17q21.31 |
down |
–2.188 |
1.434E-03 |
1.907 |
3.140 |
1408 |
CRY2 |
cryptochrome circadian clock 2 |
11p11.2 |
down |
–2.141 |
1.058E-03 |
2.134 |
2.108 |
7644 |
ZNF91 |
zinc finger protein 91 |
19p12 |
down |
–2.058 |
1.155E-03 |
1.435 |
2.063 |
197257 |
LDHD |
lactate dehydrogenase D |
16q23.1 |
down |
–1.626 |
2.965E-02 |
1.844 |
1.362 |
316 |
AOX1 |
aldehyde oxidase 1 |
2q33.1 |
down |
–1.601 |
2.169E-03 |
1.841 |
1.049 |
26051 |
PPP1R16B |
protein phosphatase 1, regulatory subunit 16B |
20q11.23 |
down |
–1.547 |
6.688E-03 |
1.076 |
1.198 |
63976 |
PRDM16 |
PR domain containing 16 |
1p36.32 |
down |
–1.439 |
2.075E-02 |
2.639 |
3.846 |
254827 |
NAALADL2 |
N-acetylated alpha-linked acidic dipeptidase-like 2 |
3q26.31 |
down |
–1.313 |
4.873E-03 |
1.621 |
3.168 |
154 |
ADRB2 |
adrenoceptor beta 2, surface |
5q32 |
down |
–1.242 |
9.799E-03 |
2.384 |
2.302 |
10477 |
UBE2E3 |
ubiquitin-conjugating enzyme E2E 3 |
2q31.3 |
down |
–1.117 |
1.135E-03 |
1.053 |
2.755 |
7099 |
TLR4 |
toll-like receptor 4 |
9q33.1 |
down |
–1.053 |
6.943E-03 |
1.402 |
2.356 |
57478 |
USP31 |
ubiquitin specific peptidase 31 |
16p12.2 |
down |
–1.037 |
4.169E-03 |
1.570 |
1.234 |
57185 |
NIPAL3 |
NIPA-like domain containing 3 |
1p36.11 |
down |
–0.986 |
1.316E-03 |
1.329 |
1.189 |
30815 |
ST6GALNAC6 |
ST6 (alpha-N-acetyl-neuraminyl-2,3-beta-galactosyl-1,3)-N-acetylgalactosaminide alpha-2,6-sialyltransferase 6 |
9q34.11 |
down |
–0.936 |
1.660E-02 |
1.093 |
2.348 |
29915 |
HCFC2 |
host cell factor C2 |
12q23.3 |
down |
–0.928 |
1.393E-03 |
1.304 |
1.296 |
54741 |
LEPROT |
leptin receptor overlapping transcript |
1p31.3 |
down |
–0.893 |
1.049E-03 |
1.280 |
2.248 |
7779 |
SLC30A1 |
solute carrier family 30 (zinc transporter), member 1 |
1q32.3 |
down |
–0.879 |
8.736E-03 |
1.267 |
1.262 |
79027 |
ZNF655 |
zinc finger protein 655 |
7q22.1 |
down |
–0.863 |
1.393E-03 |
1.570 |
1.589 |
64344 |
HIF3A |
hypoxia inducible factor 3, alpha subunit |
19q13.32 |
down |
–0.845 |
1.016E-02 |
1.284 |
2.411 |
79844 |
ZDHHC11 |
zinc finger, DHHC-type containing 11 |
5p15.33 |
down |
–0.834 |
3.176E-02 |
1.505 |
1.890 |
79815 |
NIPAL2 |
NIPA-like domain containing 2 |
8q22.2 |
down |
–0.825 |
6.688E-03 |
1.929 |
1.259 |
7923 |
HSD17B8 |
hydroxysteroid (17-beta) dehydrogenase 8 |
6p21.32 |
down |
–0.821 |
3.512E-02 |
2.657 |
3.759 |
8629 |
JRK |
Jrk homolog (mouse) |
8q24.3 |
down |
–0.820 |
1.740E-03 |
1.358 |
2.076 |
79591 |
C10orf76 |
chromosome 10 open reading frame 76 |
10q24.32 |
down |
–0.812 |
1.808E-03 |
1.099 |
1.917 |
599 |
BCL2L2 |
BCL2-like 2 |
14q11.2 |
down |
–0.775 |
2.835E-03 |
1.384 |
1.730 |
412 |
STS |
steroid sulfatase (microsomal), isozyme S |
Xp22.31 |
down |
–0.770 |
1.372E-02 |
1.440 |
1.471 |
56900 |
TMEM167B |
transmembrane protein 167B |
1p13.3 |
down |
–0.755 |
2.626E-03 |
2.282 |
2.366 |
23509 |
POFUT1 |
protein O-fucosyltransferase 1 |
20q11.21 |
down |
–0.747 |
1.274E-02 |
1.400 |
2.132 |
25923 |
ATL3 |
atlastin GTPase 3 |
11q12.3 |
down |
–0.727 |
3.290E-02 |
1.179 |
1.907 |
79669 |
C3orf52 |
chromosome 3 open reading frame 52 |
3q13.2 |
down |
–0.708 |
4.021E-02 |
1.200 |
1.482 |
55844 |
PPP2R2D |
protein phosphatase 2, regulatory subunit B, delta |
10q26.3 |
down |
–0.691 |
2.666E-02 |
1.422 |
1.303 |
5939 |
RBMS2 |
RNA binding motif, single stranded interacting protein 2 |
12q13.3 |
down |
–0.626 |
5.943E-03 |
1.193 |
1.438 |
6158 |
RPL28 |
ribosomal protein L28 |
19q13.42 |
down |
–0.618 |
1.808E-03 |
2.026 |
3.427 |
2145 |
EZH1 |
enhancer of zeste 1 polycomb repressive complex 2 subunit |
17q21.2 |
down |
–0.618 |
1.393E-03 |
1.391 |
1.171 |
388969 |
C2orf68 |
chromosome 2 open reading frame 68 |
2p11.2 |
down |
–0.611 |
3.435E-03 |
1.309 |
1.192 |
55422 |
ZNF331 |
zinc finger protein 331 |
19q13.42 |
down |
–0.594 |
1.725E-02 |
2.855 |
2.230 |
92400 |
RBM18 |
RNA binding motif protein 18 |
9q33.2 |
down |
–0.594 |
8.401E-03 |
1.172 |
2.001 |
80017 |
C14orf159 |
chromosome 14 open reading frame 159 |
14q32.11 |
down |
–0.590 |
1.182E-02 |
1.072 |
1.748 |
7556 |
ZNF10 |
zinc finger protein 10 |
12q24.33 |
down |
–0.563 |
1.480E-02 |
1.592 |
1.127 |
55957 |
LIN37 |
lin-37 DREAM MuvB core complex component |
19q13.12 |
down |
–0.543 |
1.857E-02 |
1.002 |
1.205 |
84267 |
C9orf64 |
chromosome 9 open reading frame 64 |
9q21.32 |
down |
–0.543 |
5.720E-03 |
1.215 |
1.299 |
8799 |
PEX11B |
peroxisomal biogenesis factor 11 beta |
1q21.1 |
down |
–0.535 |
4.679E-03 |
1.083 |
1.163 |
8790 |
FPGT |
fucose-1-phosphate guanylyltransferase |
1p31.1 |
down |
–0.524 |
2.075E-02 |
1.680 |
1.222 |
6992 |
PPP1R11 |
protein phosphatase 1, regulatory (inhibitor) subunit 11 |
6p22.1 |
down |
–0.517 |
6.433E-03 |
1.104 |
1.329 |
116224 |
FAM122A |
family with sequence similarity 122A |
9q21.11 |
down |
–0.507 |
2.169E-03 |
1.231 |
1.549 |
51710 |
ZNF44 |
zinc finger protein 44 |
19p13.2 |
down |
–0.499 |
1.372E-02 |
2.385 |
1.001 |
7265 |
TTC1 |
tetratricopeptide repeat domain 1 |
5q33.3 |
down |
–0.487 |
1.182E-02 |
1.109 |
1.112 |
80213 |
TM2D3 |
TM2 domain containing 3 |
15q26.3 |
down |
–0.485 |
1.182E-02 |
1.342 |
1.742 |
81631 |
MAP1LC3B |
microtubule-associated protein 1 light chain 3 beta |
16q24.2 |
down |
–0.480 |
1.725E-02 |
1.210 |
2.109 |
6016 |
RIT1 |
Ras-like without CAAX 1 |
1q22 |
down |
–0.473 |
2.666E-02 |
1.556 |
1.432 |
7247 |
TSN |
translin |
2q14.3 |
down |
–0.467 |
4.582E-02 |
1.101 |
1.496 |
167227 |
DCP2 |
decapping mRNA 2 |
5q22.2 |
down |
–0.447 |
1.016E-02 |
1.284 |
1.104 |
11046 |
SLC35D2 |
solute carrier family 35 (UDP-GlcNAc/UDP-glucose transporter), member D2 |
9q22.32 |
down |
–0.431 |
1.227E-02 |
1.318 |
1.340 |
54946 |
SLC41A3 |
solute carrier family 41, member 3 |
3q21.2 |
down |
–0.402 |
4.294E-02 |
1.526 |
1.988 |
7799 |
PRDM2 |
PR domain containing 2, with ZNF domain |
1p36.21 |
down |
–0.384 |
7.805E-03 |
1.438 |
1.294 |
6651 |
SON |
SON DNA binding protein |
21q22.11 |
down |
–0.374 |
5.486E-03 |
1.126 |
1.155 |
80255 |
SLC35F5 |
solute carrier family 35, member F5 |
2q14.1 |
down |
–0.369 |
4.441E-02 |
1.143 |
1.619 |
55197 |
RPRD1A |
regulation of nuclear pre-mRNA domain containing 1A |
18q12.2 |
down |
–0.364 |
3.893E-02 |
1.480 |
1.761 |
91603 |
ZNF830 |
zinc finger protein 830 |
17q12 |
down |
–0.358 |
2.075E-02 |
1.040 |
1.085 |
5094 |
PCBP2 |
poly(rC) binding protein 2 |
12q13.13 |
down |
–0.286 |
4.734E-02 |
1.454 |
1.158 |
To further investigate the UHRF1 downstream genes, we performed the classification of these candidate genes to known molecular pathways by using DAVID program (https://david.ncifcrf.gov/). Classification strategy of downstream genes by si-UHRF1 transfectants is shown in Figure 10A and 10B. Significantly upregulated and downregulated pathways and their involved genes are indicated in Tables 4 and 5. Several genes were classified into biological process categories and a variety of biological pathways, “M phase”, “cell cycle”, and “cell cycle phase” were significantly downregulated by si- UHRF1 transfectants (Table 4).
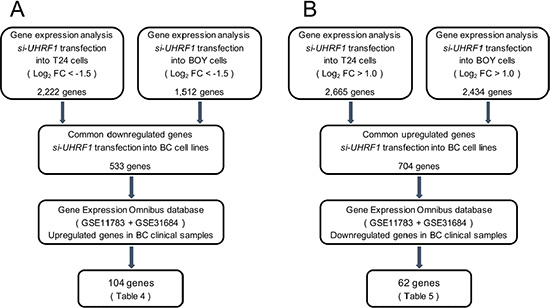
Figure 10: Flow chart demonstrating the strategy for analysis of genes regulated by UHRF1. (A) A total of 2,222 and 1,512 downregulated genes in expression analyses of si-UHRF1 transfectants of BC cell lines (T24 and BOY, respectively) were selected. We then analyzed 533 common downregulated genes by using available GEO data sets (GSE11783 + GSE31684). The analyses showed that 104 genes were significantly upregulated in BC specimens compared with NBE. (B) A total of 2,665 and 2,434 upregulated genes in expression analysis of si-UHRF1 transfectants of BC cell lines (T24 and BOY, respectively) were selected. We then analyzed 704 common upregulated genes by using GEO data sets. The analyses showed that 62 genes were significantly downregulated in BC specimens compared with NBE.
Table 4: Downregulated genes by si-UHRF1 were classified by DAVID program
Biological process |
Number of genes |
P-Value |
Genes |
|---|---|---|---|
M phase |
15 |
8.10E-09 |
ASPM, BIRC5, BRCA2, CENPE, CENPF, FBXO43, KIF11, KIF18A, KIF20B, MPHOSPH9, NBN, SGOL2, SMC2, SMC4, VCPIP1 |
cell cycle |
20 |
1.10E-07 |
ASPM, BIRC5, BRCA2, CALR, CENPE, CENPF, ESCO1, FBXO43, KIF11, KIF18A, KIF20B, MPHOSPH9, NBN, PSMC1, RIF1, SGOL2, SMC2, SMC4, UHRF1, VCPIP1 |
cell cycle phase |
15 |
1.40E-07 |
ASPM, BIRC5, BRCA2, CENPE, CENPF, FBXO43, KIF11, KIF18A, KIF20B, MPHOSPH9, NBN, SGOL2, SMC2, SMC4, VCPIP1 |
cell cycle process |
17 |
1.90E-07 |
ASPM, BIRC5, BRCA2, CALR, CENPE, CENPF, FBXO43, KIF11, KIF18A, KIF20B, MPHOSPH9, NBN, PSMC1, SGOL2, SMC2, SMC4, VCPIP1 |
chromosome segregation |
8 |
5.20E-07 |
BIRC5, CENPE, CENPF, KIF18A, SGOL2, SMC2, SMC4, TOP2A |
M phase of mitotic cell cycle |
11 |
8.50E-07 |
ASPM, BIRC5, CENPE, CENPF, KIF11, KIF18A, KIF20B, MPHOSPH9, SMC2, SMC4, VCPIP1 |
organelle fission |
11 |
1.00E-06 |
ASPM, BIRC5, CENPE, CENPF, KIF11, KIF18A, KIF20B, OPA1, SMC2, SMC4, VCPIP1 |
mitosis |
10 |
6.40E-06 |
ASPM, BIRC5, CENPE, CENPF, KIF11, KIF18A, KIF20B, SMC2, SMC4, VCPIP1 |
nuclear division |
10 |
6.40E-06 |
ASPM, BIRC5, CENPE, CENPF, KIF11, KIF18A, KIF20B, SMC2, SMC4, VCPIP1 |
mitotic cell cycle |
12 |
1.20E-05 |
ASPM, BIRC5, CENPE, CENPF, KIF11, KIF18A, KIF20B, MPHOSPH9, PSMC1, SMC2, SMC4, VCPIP1 |
DNA repair |
10 |
4.90E-05 |
BRCA2, ESCO1, FANCM, NBN, NEIL3, PMS1, RECQL4, SMC6, TOP2A, UHRF1 |
cell division |
10 |
6.50E-05 |
ASPM, BIRC5, BRCA2, CENPE, CENPF, KIF11, KIF20B, SGOL2, SMC2, SMC4 |
response to DNA damage stimulus |
11 |
7.40E-05 |
BRCA2, ESCO1, FANCM, NBN, NEIL3, PMS1, RECQL4, RIF1, SMC6, TOP2A, UHRF1 |
establishment of chromosome localization |
4 |
8.90E-05 |
BIRC5, CENPE, CENPF, KIF18A |
chromosome localization |
4 |
8.90E-05 |
BIRC5, CENPE, CENPF, KIF18A |
chromosome organization |
12 |
1.40E-04 |
BRCA2, BRPF3, CENPE, CENPF, FBXO4, KIF18A, NBN, PCGF2, SGOL2, SMC2, SMC4, TOP2A |
DNA metabolic process |
12 |
2.00E-04 |
BRCA2, CENPF, ESCO1, FANCM, FBXO4, NBN, NEIL3, PMS1, RECQL4, SMC6, TOP2A, UHRF1 |
microtubule-based movement |
6 |
5.80E-04 |
CENPE, KIF11, KIF14, KIF18A, KIF20B, OPA1 |
regulation of cell cycle process |
6 |
6.00E-04 |
BIRC5, BRCA2, CALR, CENPE, CENPF, KIF20B |
microtubule-based process |
8 |
7.90E-04 |
BRCA2, CENPE, HOOK1, KIF11, KIF14, KIF18A, KIF20B, OPA1 |
mitotic sister chromatid segregation |
4 |
1.30E-03 |
CENPE, KIF18A, SMC2, SMC4 |
sister chromatid segregation |
4 |
1.40E-03 |
CENPE, KIF18A, SMC2, SMC4 |
metaphase plate congression |
3 |
1.90E-03 |
CENPE, CENPF, KIF18A |
cellular response to stress |
11 |
2.00E-03 |
BRCA2, ESCO1, FANCM, NBN, NEIL3, PMS1, RECQL4, RIF1, SMC6, TOP2A, UHRF1 |
regulation of mitotic cell cycle |
6 |
2.20E-03 |
BIRC5, BRCA2, CENPE, CENPF, KIF20B, NBN |
organelle localization |
5 |
2.20E-03 |
ASPM, BIRC5, CENPE, CENPF, KIF18A |
spindle checkpoint |
3 |
2.20E-03 |
BIRC5, CENPE, CENPF |
positive regulation of cell cycle |
4 |
4.80E-03 |
BIRC5, BRCA2, CALR, CENPE |
establishment of organelle localization |
4 |
8.20E-03 |
BIRC5, CENPE, CENPF, KIF18A |
chromosome condensation |
3 |
9.70E-03 |
SMC2, SMC4, TOP2A |
glucose transport |
3 |
1.30E-02 |
SLC5A2, STXBP4, YES1 |
hexose transport |
3 |
1.40E-02 |
SLC5A2, STXBP4, YES1 |
regulation of cell cycle |
7 |
1.40E-02 |
BIRC5, BRCA2, CALR, CENPE, CENPF, KIF20B, NBN |
monosaccharide transport |
3 |
1.50E-02 |
SLC5A2, STXBP4, YES1 |
negative regulation of neuron differentiation |
3 |
1.70E-02 |
ASPM, CALR, NBN |
cell cycle checkpoint |
4 |
1.70E-02 |
BIRC5, CENPE, CENPF, NBN |
kinetochore assembly |
2 |
1.80E-02 |
CENPE, CENPF |
meiosis |
4 |
2.10E-02 |
BRCA2, FBXO43, NBN, SGOL2 |
M phase of meiotic cell cycle |
4 |
2.10E-02 |
BRCA2, FBXO43, NBN, SGOL2 |
meiotic cell cycle |
4 |
2.20E-02 |
BRCA2, FBXO43, NBN, SGOL2 |
germ cell development |
4 |
2.30E-02 |
BRCA2, CASC5, HOOK1, PVRL2 |
kinetochore organization |
2 |
2.40E-02 |
CENPE, CENPF |
DNA recombination |
4 |
2.50E-02 |
BRCA2, NBN, RECQL4, SMC6 |
mitotic cell cycle checkpoint |
3 |
2.70E-02 |
CENPE, CENPF, NBN |
centromere complex assembly |
2 |
3.50E-02 |
CENPE, CENPF |
spermatid development |
3 |
4.10E-02 |
CASC5, HOOK1, PVRL2 |
regulation of nuclear division |
3 |
4.40E-02 |
CENPE, CENPF, KIF20B |
regulation of mitosis |
3 |
4.40E-02 |
CENPE, CENPF, KIF20B |
negative regulation of macromolecule biosynthetic process |
8 |
4.50E-02 |
BRCA2, CALR, CD276, CENPF, KCNIP3, PCGF2, SKIL, ZNF254 |
spermatid differentiation |
3 |
4.60E-02 |
CASC5, HOOK1, PVRL2 |
cytoskeleton organization |
7 |
4.60E-02 |
BRCA2, CALR, HOOK1, KIF11, KIF18A, OPHN1, RICTOR |
negative regulation of cellular biosynthetic process |
8 |
5.10E-02 |
BRCA2, CALR, CD276, CENPF, KCNIP3, PCGF2, SKIL, ZNF254 |
positive regulation of cellular protein metabolic process |
5 |
5.10E-02 |
CLCF1, EIF5A, FBXO4, PSMC1, RICTOR |
carbohydrate transport |
3 |
5.20E-02 |
SLC5A2, STXBP4, YES1 |
mitotic metaphase plate congression |
2 |
5.30E-02 |
CENPE, KIF18A |
regulation of DNA replication |
3 |
5.30E-02 |
BRCA2, CALR, NBN |
double-strand break repair |
3 |
5.30E-02 |
BRCA2, NBN, RECQL4 |
negative regulation of biosynthetic process |
8 |
5.50E-02 |
BRCA2, CALR, CD276, CENPF, KCNIP3, PCGF2, SKIL, ZNF254 |
positive regulation of protein metabolic process |
5 |
5.80E-02 |
CLCF1, EIF5A, FBXO4, PSMC1, RICTOR |
microtubule cytoskeleton organization |
4 |
5.80E-02 |
BRCA2, HOOK1, KIF11, KIF18A |
negative regulation of mitotic metaphase/anaphase transition |
2 |
6.40E-02 |
CENPE, CENPF |
blastocyst growth |
2 |
6.40E-02 |
BRCA2, NBN |
mitotic cell cycle spindle assembly checkpoint |
2 |
6.40E-02 |
CENPE, CENPF |
positive regulation of mitotic cell cycle |
2 |
7.00E-02 |
BIRC5, BRCA2 |
negative regulation of mitosis |
2 |
7.00E-02 |
CENPE, CENPF |
negative regulation of nuclear division |
2 |
7.00E-02 |
CENPE, CENPF |
negative regulation of macromolecule metabolic process |
9 |
7.20E-02 |
BRCA2, CALR, CD276, CENPF, KCNIP3, PCGF2, PSMC1, SKIL, ZNF254 |
reproductive cellular process |
4 |
7.30E-02 |
BRCA2, CASC5, HOOK1, PVRL2 |
mitotic chromosome condensation |
2 |
7.50E-02 |
SMC2, SMC4 |
negative regulation of transcription from RNA polymerase II promoter |
5 |
7.50E-02 |
CALR, KCNIP3, PCGF2, SKIL, ZNF254 |
protein localization |
10 |
8.00E-02 |
CALR, CENPE, CENPF, EIF5A, HOOK1, KIF18A, RAB12, RPGR, SGOL2, STXBP4 |
negative regulation of nucleobase, nucleoside, nucleotide and nucleic acid metabolic process |
7 |
8.60E-02 |
BRCA2, CALR, CENPF, KCNIP3, PCGF2, SKIL, ZNF254 |
establishment of protein localization |
9 |
8.90E-02 |
CALR, CENPE, CENPF, EIF5A, HOOK1, KIF18A, RAB12, RPGR, STXBP4 |
in utero embryonic development |
4 |
8.90E-02 |
BRCA2, NBN, PCGF2, RPGRIP1L |
negative regulation of nitrogen compound metabolic process |
7 |
9.10E-02 |
BRCA2, CALR, CENPF, KCNIP3, PCGF2, SKIL, ZNF254 |
positive regulation of cellular component organization |
4 |
9.50E-02 |
CALR, CENPE, EIF5A, RICTOR |
developmental growth |
3 |
9.60E-02 |
BRCA2, NBN, PLAU |
Table 5: Upregulated genes by si-UHRF1 were classified by DAVID program
Biological process |
Number of genes |
P-Value |
Genes |
|---|---|---|---|
regulation of transcription |
15 |
1.40E-02 |
CRY2, ADRB2, EZH1, HCFC2, HIF3A, JRK, POFUT1, PRDM16, PRDM2, TLR4, ZNF10, ZNF331, ZNF44, ZNF655, ZNF91 |
regulation of transcription, DNA-dependent |
10 |
7.00E-02 |
ADRB2, HCFC2, HIF3A, PRDM16, PRDM2, ZNF10, ZNF331, ZNF44, ZNF655, ZNF91 |
regulation of RNA metabolic process |
10 |
7.90E-02 |
ADRB2, HCFC2, HIF3A, PRDM16, PRDM2, ZNF10, ZNF331, ZNF44, ZNF655, ZNF91 |
negative regulation of myeloid leukocyte differentiation |
2 |
4.90E-02 |
PRDM16, TLR4 |
fucose metabolic process |
2 |
5.20E-02 |
POFUT1, FPGT |
brown fat cell differentiation |
2 |
6.90E-02 |
ADRB2, PRDM16 |
negative regulation of myeloid cell differentiation |
2 |
8.50E-02 |
PRDM16, TLR4 |
DISCUSSION
miRNAs are critical regulators of gene expression and they control many physiologic processes in mammalian cells [5–7]. There are abundant evidences that aberrantly expressed miRNAs can dysregulate otherwise well-controlled cellular RNA networks, thereby enhancing cancer cell development, progression, and metastasis [6–9]. The discovery of aberrantly expressed miRNAs and the resultant changes in RNA networks in cancer cells provide novel molecular explanations for cancer cell progression and metastasis. It is now apparent that dysregulated miRNAs play important roles in BC cell development [16]. Our past miRNA studies of BC cells showed that clustered miRNAs (including miR-1/133a (targeting TAGLN2), miR-23b/27b/24-1 (targeting EGFR, MET, and FOXM1), and miR-195/497 (targeting BIRC5 and WNT7A)) act as tumor-suppressive miRNAs through their regulation of several oncogenic genes and pathways [10, 17–19].
Improved technological developments (next generation sequencing) have illuminated the role of miRNA networks in cancer cells. In this study, we examined the expression of miR-145-5p and miR-145 3p in BC cells because these miRNAs were significantly reduced in cancer cells as determined by deep sequencing. Our data demonstrated that miR-145-3p (the passenger-strand from pre-miR-145) had anti-tumor effects through targeting of UHRF1 in BC cells.
Downregulation of miR-145-5p (the guide-strand) is frequently observed in many types of cancer, and past studies have established the anti-tumor function of miR-145-5p through its regulation of several types of oncogenes in cancer cells [15]. Our group also identified the anti-tumor function of miR-145-5p in prostate cancer, renal cell carcinoma, bladder cancer, and esophageal squamous cell carcinoma [20–23]. Importantly, p53 appears to transcriptionally regulate miR-145-5p by interaction with a potential p53 response element at the pre-miR-145 promoter region [24]. Moreover, c-MYC is directly repressed by miR-145-5p, indicating that it acts as a new member of the p53 regulatory network and contributes to the direct linkage between p53 and c-MYC in human cancer pathways [24]. In contrast to miR-145-5p, the functional significance of miR-145-3p in cancer cells has been obscure. This is the first report to evaluate the anti-tumor function of miR-145-3p in BC cells by gain-of-function assays.
miRNAs are often associated in clusters in the genome, and several studies have focused on the functional role of clustered miRNAs in human cancers [17, 18, 20–23, 25]. In the human genome, 429 human miRNAs have been found to be clustered at 144 sites, with inter-miRNA distances of less than 5,000 base pair (miRBase, release 21). Both miR-143 and miR-145-5p are known to be located close together on human chromosome 5q32, where they form a cluster [26]. Based on our miRNA signatures, miR-143 and miR-145-5p are the most frequently downregulated miRNAs in various types of human cancers [26]. These two miRNAs have been reported as tumor suppressors and studied extensively for their role in oncogenic pathways in several cancers [15]. Our past studies demonstrated that hexokinase-2 (HK2) and Golgi membrane protein 1 (GOLM1) were directly regulated by miR-143 and miR-145-5p in renal carcinoma and prostate cancer, respectively [22, 23].
In this study, we speculated that miR-145-5p and miR-145-3p worked together to regulate pathways in BC cell progression and metastasis. Our present data showed that UHRF1 was directly regulated by both miR-145-5p and miR-145-3p in BC cells. In previous studies of miRNA regulation of UHRF1 in cancers, UHRF1 was regulated by miR-146a/146b in gastric cancer [27], miR-9 in colorectal cancer [28], and miR-124 in BC [29]. However, there have been no previous reports about the effects of miR-145-5p and miR-145-3p on UHRF1.
The UHRF1 gene was first cloned as a transcription factor that binds to the promoter region of the topoisomerase IIα (TOP2A) gene and controls its expression levels [30]. UHRF1 is involved in a wide range of physiological and pathological phenomena, including cancer development and metastasis [31]. UHRF1 plays a pivotal role in controlling gene expression through regulating epigenetic mechanisms, including DNA methylation, histone deacetylation, histone methylation, and histone ubiquitination [31]. Overexpression of UHRF1 occurs in many types of cancer, and aberrantly expressed UHRF1 causes cancer cell activation through hyper-methylation of tumor-suppressor genes such as BRCA1, CDKN2A, p73, and RASSF1 [32]. Expression of UHRF1 might be used as a progression marker in cancer [32]. For example, the expression of UHRF1 in MIBC was greater than in NMIBC, and upregulation was associated with an increased risk of progression after transurethral resection [33]. Our present data showed that knockdown of UHRF1 significantly induced apoptosis in BC cells and expression levels of the gene correlated with cause specific survival. Our data support the past studies of UHRF1 in cancer research, suggesting UHRF1 plays essential roles in BC cell progression and might be a molecular target for BC treatment.
In this study, we identified UHRF1-regulated BC pathways by using genome-wide gene expression analysis of si-UHRF1-transfected cells. Our expression data showed that UHRF1 and TOP2A were significantly reduced by si-UHRF1 transfection, indicating the usefulness of the present analytic approach. Our data showed that several anti-apoptosis genes and pro-proliferation genes were involved in pathways downstream of UHRF1, such as BIRC5 and CENPF. BIRC5 is a member of the inhibitor of apoptosis (IAP) family preferentially expressed by many cancers, including BC [10], and its mediated cellular networks are essential for cancer cell proliferation and viability [34]. CENPF is a master regulator of prostate cancer malignancy. Together, FOXM1 and CENPF regulate target gene expression and activation in cancer cells [35, 36]. The identification of these novel molecular pathways and targets mediated by the miR-145-5p/145-3p/UHRF1 axis may lead to a better understanding of BC cell progression and metastasis.
In conclusion, downregulation of dual-strand miR- 145-5p and miR-145-3p was validated in BC clinical specimens, and these miRNAs were shown to function as tumor suppressors in BC cells. To the best of our knowledge, this is the first report demonstrating that tumor suppressive miR-145-5p and miR-145-3p directly targeted UHRF1. Moreover, UHRF1 was upregulated in BC clinical specimens and contributed to anti-apoptotic effects through its regulation of several oncogenic genes. Expression of UHRF1 might be a useful prognostic marker for survival of BC patients. The identification of novel molecular pathways and targets regulated by the miR-145-5p/miR-145-3p/UHRF1 axis may lead to a better understanding of BC progression and aggressiveness.
MATERIALS AND METHODS
Clinical specimens and cell lines
Clinical tissue specimens were collected from BC patients (n = 69) who had undergone transurethral resection of their bladder tumors (TURBT, n = 59) or cystectomy (n = 10) at Kagoshima University Hospital between 2003 and 2013. NBE (n = 12) were derived from patients with noncancerous disease. The specimens were staged according to the American Joint Committee on Cancer-Union Internationale Contre le Cancer tumor-node-metastasis (TNM) classification and histologically graded [37]. Our study was approved by the Bioethics Committee of Kagoshima University; written prior informed consent and approval were obtained from all patients. Patient details and clinicopathological characteristics are listed in Table 6.
Table 6: Characteristic of patients
Bladder cancer (BC) |
|||
|---|---|---|---|
Total number |
69 |
|
|
Median age (range) |
73 |
(40–94) |
years |
Gender |
|||
Male |
53 |
76.8% |
|
Female |
16 |
23.2% |
|
Tumor grade |
|||
Low grade |
45 |
65.2% |
|
High grade |
22 |
31.9% |
|
Unknown |
2 |
2.9% |
|
T stage |
|||
Tis |
2 |
2.9% |
|
Ta |
7 |
10.1% |
|
T1 |
25 |
36.2% |
|
T2 |
27 |
39.1% |
|
T3 |
4 |
5.8% |
|
T4 |
4 |
5.8% |
|
N stage |
|||
N0 |
40 |
58.0% |
|
N1 |
8 |
11.6% |
|
Unknown |
21 |
30.4% |
|
M stage |
|||
M0 |
58 |
84.1% |
|
M1 |
5 |
7.2% |
|
Unknown |
6 |
8.7% |
|
Operation method |
|||
TURBT |
59 |
85.5% |
|
Cystectomy |
10 |
14.5% |
|
Normal bladder epithelium |
|||
Total number |
12 |
|
|
Median age (range) |
61 |
(47–72) |
years |
Abbreviation: TURBT = transurethral resection of bladder tumor
We used two human BC cell lines: T24, which was invasive and obtained from the American Type Culture Collection; and BOY, which was established in our laboratory from an Asian male patient, 66 years old, who was diagnosed with stage III BC and lung metastasis [38, 39]. These cell lines were maintained in minimum essential medium supplemented with 10% fetal bovine serum in a humidified atmosphere of 5% CO2 and 95% air at 37°C.
Tissue collection and RNA extraction
Tissues were immersed in RNAlater (Thermo Fisher Scientific; Waltham, MA, USA) and stored at –20°C until RNA extraction was conducted. Total RNA, including miRNA, was extracted using the mirVana™ miRNA isolation kit (Thermo Fisher Scientific) following the manufacturer’s protocol. The integrity of the RNA was checked with an RNA 6000 Nano Assay kit and a 2100 Bioanalyzer (Agilent Technologies, Santa Clara, CA, USA) following the manufacturer’s protocol.
Quantitative real-time reverse transcription polymerase chain reaction (qRT-PCR)
The procedure for qRT-PCR quantification was described previously [40, 41]. Stem-loop RT-PCR (TaqMan MicroRNA Assays; product ID: 002278 for miR-145-5p and product ID: 002149 for miR-145-3p; Thermo Fisher Scientific) was used to quantify miRNAs according to previously published conditions [40–42]. TaqMan probes and primers for UHRF1 (product ID: Hs 01086727_m1; Thermo Fisher Scientific) were assay-on-demand gene expression products. We used human GUSB (product ID: Hs99999908_m1; Thermo Fisher Scientific) and RNU48 (product ID: 001006; Thermo Fisher Scientific), respectively, as internal controls.
Transfections with miRNA mimic and small interfering RNA (siRNA) into BC cell lines
Mature miRNA molecules, Pre-miR™ miRNA precursors (hsa-miR-145-5p; product ID: PM11480, hsa-miR-145-3p; product ID: PM13036, and negative control miRNA; product ID: AM 17111; Thermo Fisher Scientific) were used in the gain-of-function experiments, whereas UHRF1 siRNA (product ID: HSS120939 and HSS179006; Thermo Fisher Scientific) and negative control siRNA (product ID: D-001810-10; Thermo Fisher Scientific) were used in the loss-of-function experiments. The transfection procedures and transfection efficiencies of miRNA in T24 and BOY cells were reported previously [40–42].
Cell proliferation, migration, and invasion assays
To investigate the functional significance of the miR-145-5p, miR-145-3p, and UHRF1, we performed cell proliferation, migration, and invasion assays using T24 and BOY cells. The experimental procedures were performed as described in our previous studies [40-42].
Apoptosis assays
BC cell lines were transiently transfected with reagent only (mock), miR-control, miR-145-5p, miR- 145- 3p, siRNA-control, or si-UHRF1 at 10 nM in 6 well tissue culture plates, as described previously [14, 17–19]. Cells were harvested by trypsinization 72 hours after transfection and washed in cold phosphate-buffered saline. For apoptosis assays, double staining with FITC-Annexin V and propidium iodide was carried out using a FITC Annexin V Apoptosis Detection Kit (BD Biosciences, Bedford, MA, USA) according to the manufacturer’s recommendations and analysed within 1 hour by flow cytometry (CyAn ADP analyzer; Beckman Coulter, Brea, CA, USA). Cells were identified as viable cells, dead cells, early apoptotic cells, and apoptotic cells using Summit 4.3 software (Beckman Coulter), and the percentages of early apoptotic and apoptotic cells from each experiment were then compared. As a positive control, we used 2 μg/mL cycloheximide.
Cell cycle assays
For the cell cycle analyses, cells were stained with PI using the Cycletest PLUS DNA Reagent Kit (BD Biosciences) following the protocol and analyzed by CyAn ADP analyzer (Beckman Coulter). The percentages of the cells in the G0/G1, S, and G2/M phases were determined and compared. Experiments were performed in triplicate.
Western blot analyses
Immunoblotting was performed with rabbit anti-UHRF1 antibodies (1:500, PA5-29884; Thermo Fisher Scientific), anti-PARP antibodies (1:500 #9542; Cell Signaling Technology; Danvers, MA, USA), anti-cleaved PARP antibodies (1:500 #5625; Cell Signaling Technology), and anti-GAPDH antibodies (1:10000 MAB374; Chemicon, Temecula, CA, USA). Specific complexes were visualized with an echochemiluminescence detection system (GE Healthcare, Little Chalfont, UK).
Immunohistochemistry
A tissue microarray of 68 urothelial cancers and 20 normal bladder tissues was obtained from US Biomax, Inc. (Rockville, MD, USA) (product ID: BL1002). Detailed information on all tumor specimens can be found at http://www.biomax.us/index.php. The tissue microarray was immunostained following the manufacturer’s protocol with an Ultra Vision Detection System (Thermo Scientific). The primary rabbit polyclonal antibodies against UHRF1 (PA5-29884; Thermo Fisher Scientific) were diluted 1:300. Immunostaining was evaluated according to a scoring method as described previously [17].
Genome-wide gene expression and in silico analyses for the identification of genes regulated by miR-145-5p and miR-145-3p
To further investigate the specific genes affected by miR-145-5p and miR-145-3p, we performed a combination of in silico and genome-wide gene expression analyses. We attempted to identify target genes using a BC cell line transfected with these miRNAs. A Sure Print G3 Human GE 8 × 60K Microarray (Agilent Technologies) was used for expression profiling of miR-145-5p and miR-145-3p transfectants. The microarray data were deposited into GEO (http://www.ncbi.nlm.nih.gov/geo/) and were assigned GEO accession number GSE66498. Next, we selected putative miRNA target genes using the microRNA.org database (August, 2010 release, http://www.microrna.org). Finally, to identify upregulated genes in BC, we analyzed publicly available gene expression data sets in GEO (accession numbers: GSE11783, GSE31684). The data were normalized and analyzed with Gene Spring software (Agilent Technologies) as described previously [22, 23, 40–42]. The strategy for investigation of the target genes is shown in Figure 3.
Plasmid construction and dual luciferase reporter assays
Partial wild-type sequences of the 3′ UTR of UHRF1 or those with a deleted miR-145-5p and miR- 145- 3p target site (positions 1,179–1,198 of UHRF1 3′ UTR for miR- 145-5p, and positions 287–292 of UHRF1 3′ UTR for miR-145-3p) were inserted between the XhoI and PmeI restriction sites in the 3′ UTR of the hRluc gene in the psiCHECK-2 vector (C8021; Promega, Madison, WI, USA). T24 and BOY cell lines were transfected with 50 ng of the vector and 10 nM miR-145-5p or miR-145-3p using Lipofectamine 2000 (Thermo Fisher Scientific) and Opti-MEM (Thermo Fisher Scientific). The activities of firefly and Renilla luciferases in cell lysates were determined with a dual luciferase reporter assay system according to the manufacturer’s protocol (E1960; Promega). Normalized data were calculated as the ratio of Renilla/firefly luciferase activities.
Identification of downstream targets regulated by UHRF1 in BC
To investigate molecular targets regulated by UHRF1 in BC cells, we carried out gene expression analyses using si-UHRF1-transfected BC cell lines. Microarray data were used for expression profiling of si-UHRF1 transfectants. The microarray data were deposited into GEO (accession number: GSE77790). We analyzed common down or upregulated genes using the GEO dataset. The flow chart outlining the investigation of UHRF1 downstream genes is shown in Figure 10A and 10B.
Statistical analysis
Relationships among two or three variables and numerical values were analysed using the Mann-Whitney U test or Bonferroni-adjusted Mann-Whitney U test. Spearman’s rank test was used to evaluate the correlation among the expressions of miR-145-5p, miR-145-3p, and UHRF1. We estimated cause specific survival of 57 BC patients by using the Kaplan-Meier method. Among the 69 BC patients, 12 died of other causes. Therefore, we analyzed cause specific survival of 57 BC patients. Patients were divided into two groups according to the median value of UHRF1 expression, and the differences between the two groups were evaluated by the log-rank tests. We used Expert Stat View software, version 5.0 (SAS Institute Inc., Cary, NC, USA), for these analyses.
ACKNOWLEDGMENTS AND FUNDING
This study was supported by JSPS KAKENHI Grant Numbers 26293354, 25462490, and 26462416.
CONFLICTS OF INTEREST
The authors indicated no potential conflicts of interest.
REFERENCES
1. Torre LA, Bray F, Siegel RL, Ferlay J, Lortet-Tieulent J, Jemal A. Global cancer statistics, 2012. CA Cancer J Clin. 2015; 65:87–108.
2. Siegel RL, Miller KD, Jemal A. Cancer statistics, 2015. CA Cancer J Clin. 2015; 65:5–29.
3. Schenk-Braat EA, Bangma CH. Immunotherapy for superficial bladder cancer. Cancer Immunol Immunother. 2005; 54:414–423.
4. Collaboration ABCAM-a. Neoadjuvant chemotherapy in invasive bladder cancer: a systematic review and meta-analysis. Lancet. 2003; 361:1927–1934.
5. Di Leva G, Croce CM. Roles of small RNAs in tumor formation. Trends in molecular medicine. 2010; 16:257–267.
6. Garzon R, Marcucci G, Croce CM. Targeting microRNAs in cancer: rationale, strategies and challenges. Nat Rev Drug Discov. 2010; 9:775–789.
7. Carthew RW, Sontheimer EJ. Origins and Mechanisms of miRNAs and siRNAs. Cell. 2009; 136:642–655.
8. Friedman RC, Farh KK, Burge CB, Bartel DP. Most mammalian mRNAs are conserved targets of microRNAs. Genome research. 2009; 19:92–105.
9. Lewis BP, Shih IH, Jones-Rhoades MW, Bartel DP, Burge CB. Prediction of mammalian microRNA targets. Cell. 2003; 115:787–798.
10. Itesako T, Seki N, Yoshino H, Chiyomaru T, Yamasaki T, Hidaka H, Yonezawa T, Nohata N, Kinoshita T, Nakagawa M, Enokida H. The microRNA expression signature of bladder cancer by deep sequencing: the functional significance of the miR-195/497 cluster. PloS one. 2014; 9:e84311.
11. Chendrimada TP, Gregory RI, Kumaraswamy E, Norman J, Cooch N, Nishikura K, Shiekhattar R. TRBP recruits the Dicer complex to Ago2 for microRNA processing and gene silencing. Nature. 2005; 436:740–744.
12. Bartel DP. MicroRNAs: target recognition and regulatory functions. Cell. 2009; 136:215–233.
13. Hutvagner G, Zamore PD. A microRNA in a multiple-turnover RNAi enzyme complex. Science. 2002; 297:2056–2060.
14. Matsushita R, Seki N, Chiyomaru T, Inoguchi S, Ishihara T, Goto Y, Nishikawa R, Mataki H, Tatarano S, Itesako T, Nakagawa M, Enokida H. Tumour-suppressive microRNA-144-5p directly targets CCNE1/2 as potential prognostic markers in bladder cancer. Br J Cancer. 2015; 113:282–289.
15. Cui SY, Wang R, Chen LB. MicroRNA-145: a potent tumour suppressor that regulates multiple cellular pathways. JJ Cell Mol Med. 2014; 18:1913–1926.
16. Yoshino H, Seki N, Itesako T, Chiyomaru T, Nakagawa M, Enokida H. Aberrant expression of microRNAs in bladder cancer. Nature reviews Urology. 2013; 10:396–404.
17. Yoshino H, Chiyomaru T, Enokida H, Kawakami K, Tatarano S, Nishiyama K, Nohata N, Seki N, Nakagawa M. The tumour-suppressive function of miR-1 and miR-133a targeting TAGLN2 in bladder cancer. Br J Cancer. 2011; 104:808–818.
18. Chiyomaru T, Seki N, Inoguchi S, Ishihara T, Mataki H, Matsushita R, Goto Y, Nishikawa R, Tatarano S, Itesako T, Nakagawa M, Enokida H. Dual regulation of receptor tyrosine kinase genes EGFR and c-Met by the tumor-suppressive microRNA-23b/27b cluster in bladder cancer. Int J Oncol. 2015; 46:487–496.
19. Inoguchi S, Seki N, Chiyomaru T, Ishihara T, Matsushita R, Mataki H, Itesako T, Tatarano S, Yoshino H, Goto Y, Nishikawa R, Nakagawa M, Enokida H. Tumour-suppressive microRNA-24-1 inhibits cancer cell proliferation through targeting FOXM1 in bladder cancer. FEBS Lett. 2014; 588:3170–3179.
20. Chiyomaru T, Enokida H, Tatarano S, Kawahara K, Uchida Y, Nishiyama K, Fujimura L, Kikkawa N, Seki N, Nakagawa M. miR-145 and miR-133a function as tumour suppressors and directly regulate FSCN1 expression in bladder cancer. Br J Cancer. 2010; 102:883–891.
21. Kano M, Seki N, Kikkawa N, Fujimura L, Hoshino I, Akutsu Y, Chiyomaru T, Enokida H, Nakagawa M, Matsubara H. miR-145, miR-133a and miR-133b: Tumor-suppressive miRNAs target FSCN1 in esophageal squamous cell carcinoma. Int J Cancer. 2010; 127:2804–2814.
22. Yoshino H, Enokida H, Itesako T, Kojima S, Kinoshita T, Tatarano S, Chiyomaru T, Nakagawa M, Seki N. Tumor-suppressive microRNA-143/145 cluster targets hexokinase-2 in renal cell carcinoma. Cancer Sci. 2013; 104:1567–1574.
23. Kojima S, Enokida H, Yoshino H, Itesako T, Chiyomaru T, Kinoshita T, Fuse M, Nishikawa R, Goto Y, Naya Y, Nakagawa M, Seki N. The tumor-suppressive microRNA- 143/145 cluster inhibits cell migration and invasion by targeting GOLM1 in prostate cancer. J Hum Genet. 2014; 59:78–87.
24. Sachdeva M, Zhu S, Wu F, Wu H, Walia V, Kumar S, Elble R, Watabe K, Mo YY. p53 represses c-Myc through induction of the tumor suppressor miR-145. Proc Natl Acad Sci U S A. 2009; 106:3207–3212.
25. Kim YK, Yu J, Han TS, Park SY, Namkoong B, Kim DH, Hur K, Yoo MW, Lee HJ, Yang HK, Kim VN. Functional links between clustered microRNAs: suppression of cell-cycle inhibitors by microRNA clusters in gastric cancer. Nucleic Acids Res. 2009; 37:1672–1681.
26. Das AV, Pillai RM. Implications of miR cluster 143/145 as universal anti-oncomiRs and their dysregulation during tumorigenesis. Cancer Cell Int. 2015; 15:92.
27. Zhou L, Zhao X, Han Y, Lu Y, Shang Y, Liu C, Li T, Jin Z, Fan D, Wu K. Regulation of UHRF1 by miR-146a/b modulates gastric cancer invasion and metastasis. FASEB J. 2013; 27:4929–4939.
28. Zhu M, Xu Y, Ge M, Gui Z, Yan F. Regulation of UHRF1 by miR-9 modulates colorectal cancer cell proliferation and apoptosis. Cancer Sci. 2015; 106:883–839.
29. Wang X, Wu Q, Xu B, Wang P, Fan W, Cai Y, Gu X, Meng F. miR-124 exerts tumor suppressive functions on the cell proliferation, motility and angiogenesis of bladder cancer by fine-tuning UHRF1. FEBS J. 2015; 282:4376–4388.
30. Hopfner R, Mousli M, Jeltsch JM, Voulgaris A, Lutz Y, Marin C, Bellocq JP, Oudet P, Bronner C. ICBP90, a novel human CCAAT binding protein, involved in the regulation of topoisomerase IIalpha expression. Can Res. 2000; 60:121–128.
31. Unoki M, Brunet J, Mousli M. Drug discovery targeting epigenetic codes: the great potential of UHRF1, which links DNA methylation and histone modifications, as a drug target in cancers and toxoplasmosis. Biochem Pharmacol. 2009; 78:1279–1288.
32. Bronner C, Krifa M, Mousli M. Increasing role of UHRF1 in the reading and inheritance of the epigenetic code as well as in tumorogenesis. Biochem Pharmacol. 2013; 86:1643–1649.
33. Unoki M, Kelly JD, Neal DE, Ponder BA, Nakamura Y, Hamamoto R. UHRF1 is a novel molecular marker for diagnosis and the prognosis of bladder cancer. Br J Cancer. 2009; 101:98–105.
34. Athanasoula K, Gogas H, Polonifi K, Vaiopoulos AG, Polyzos A, Mantzourani M. Survivin beyond physiology: orchestration of multistep carcinogenesis and therapeutic potentials. Cancer Lett. 2014; 347:175–182.
35. Aytes A, Mitrofanova A, Lefebvre C, Alvarez MJ, Castillo-Martin M, Zheng T, Eastham JA, Gopalan A, Pienta KJ, Shen MM, Califano A, Abate-Shen C. Cross-species regulatory network analysis identifies a synergistic interaction between FOXM1 and CENPF that drives prostate cancer malignancy. Cancer Cell. 2014; 25:638–651.
36. Lokody I. Signalling: FOXM1 and CENPF: co-pilots driving prostate cancer. Nat Rev Cancer. 2014; 14:450–451.
37. Sobin LH, Compton CC. TNM seventh edition: what’s new, what’s changed: communication from the International Union Against Cancer and the American Joint Committee on Cancer. Cancer. 2010; 116:5336–5339.
38. Tatarano S, Chiyomaru T, Kawakami K, Enokida H, Yoshino H, Hidaka H, Nohata N, Yamasaki T, Gotanda T, Tachiwada T, Seki N, Nakagawa M. Novel oncogenic function of mesoderm development candidate 1 and its regulation by MiR-574-3p in bladder cancer cell lines. Int J Oncol. 2012; 40:951–959.
39. Tatarano S, Chiyomaru T, Kawakami K, Enokida H, Yoshino H, Hidaka H, Yamasaki T, Kawahara K, Nishiyama K, Seki N, Nakagawa M. miR-218 on the genomic loss region of chromosome 4p15.31 functions as a tumor suppressor in bladder cancer. Int J Oncol. 2011; 39:13–21.
40. Kinoshita T, Hanazawa T, Nohata N, Kikkawa N, Enokida H, Yoshino H, Yamasaki T, Hidaka H, Nakagawa M, Okamoto Y, Seki N. Tumor suppressive microRNA-218 inhibites cancer cell migration and invasion through targeting laminin-332 in head and neck squamous cell carcinoma. Oncotarget. 2012; 3:1386–1400. doi: 10.18632/oncotarget.709.
41. Goto Y, Kojima S, Nishikawa R, Enokida H, Chiyomaru T, Kinoshita T, Nakagawa M, Naya Y, Ichikawa T, Seki N. The microRNA-23b/27b/24-1 cluster is a disease progression marker and tumor suppressor in prostate cancer. Oncotarget. 2014; 5:7748–7759. doi: 10.18632/oncotarget.2294.
42. Goto Y, Kojima S, Nishikawa R, Kurozumi A, Kato M, Enokida H, Matsushita R, Yamazaki K, Ishida Y, Nakagawa M, Naya Y, Ichikawa T, Seki N. MicroRNA expression signature of castration-resistant prostate cancer: the microRNA-221/222 cluster function as a tumour suppressor and disease progression marker. Br J Cancer. 2015; 113:1055–1065.