
INTRODUCTION
Based on their immunomodulatory properties [1, 2], mesenchymal stromal cells (MSC) have been explored for the treatment of several immune-related diseases [3] such as graft versus host disease (GvHD) [4], Crohn’s disease [5], multiple sclerosis [6] type-2 diabetes [7], and have been shown to induce tissue remodeling and repair [8-11]. Notwithstanding encouraging in vitro and in vivo results, the mechanisms underlying the MSC-mediated biological effects are still undefined [12-16]. Improving our knowledge on the mechanisms of action of MSC is an urgent need, especially because recent clinical trials using MSC infusion for the treatment of steroid resistant GvHD have provided positive results regarding overall response and survival [4, 17-19].
To investigate how MSC modulate the immune response, we focused on their effects on the differentiation and maturation of monocyte-derived dendritic cells (DC). DC are professional antigen presenting cells that play a key role in the activation and regulation of adoptive immune responses in both physiological and pathological conditions [20-23]. Upon uptake of antigens released by tissues (i.e. upon conditioning-induced damages in the case of GvHD), immature DC undergo maturation and migrate to draining lymph nodes where they present antigens and provide co-stimulation to donor’s naïve T-cells by cell-cell interactions and the secretion of soluble factors (i.e. IL-12). As a consequence, activated T-cells acquire a Th1, IFNγ producing phenotype, proliferate and migrate to the inflamed damaged tissue where they elicit effector functions. Because DC are initiators of the immune cascade, targeting their activity is an appealing tool for the regulation of immune responses [20]. The redirection and tuning of myeloid cell differentiation is likely to be a natural way of adapting the immune response to local stimuli [24-26].
Here, we extensively investigated the changes induced by umbilical-cord (UC)-MSC on the differentiation and function of monocyte-derived DC. Based on our findings, we propose that UC-MSC divert the differentiation of monocyte-derived DC into M2-macrophages by metabolic reprogramming via lactate secretion. Due to the increasing interest in immune cell metabolism in both physiological and pathological conditions, and to the importance of DC and M2-macrophages in immune regulation, the possibility of manipulating myeloid cell plasticity by metabolic reprogramming represents an important step towards new clinically relevant therapies.
RESULTS
UC-MSC prevent the differentiation of GM-CSF/IL-4-treated monocytes into DC
In vitro stimulation of monocytes with GM-CSF and IL-4 promotes their differentiation into immature DC (iDC), and further stimulation with LPS induces DC maturation (mDC) [27, 28]. We investigated whether the presence of UC-MSC during the differentiation and maturation phase could alter the general properties of the resulting DC (here indicated as iDCMSC and mDCMSC respectively as shown in Figure S1).
Flow cytometry analysis revealed that iDC were CD14-, CD1ahigh, CD80low, CD83low, CD86low, HLA-DR+, while mDC were CD14-, CD1ahigh, CD80high, CD83+, CD86high, HLA-DRhigh (Figure 1A and Figure S2, S3). The presence of primary UC-MSC during DC differentiation deeply modified the cellular surface marker expression pattern. Indeed, in contrast to iDC, the phenotype of iDCMSC was CD14+ and CD1a- (Figure 1A) suggesting a profound modification of the nature of the obtained cells. In comparison to mDC, mDCMSC showed a significantly lower expression of CD80 and CD86, and expressed CD14. MSC were excluded from the analysis based on their size and granularity. Of note, UC-MSC mediated their effect during the DC differentiation phase, as iDCMSC were not able to acquire a mature phenotype even if UC-MSC were removed during the LPS-induced maturation phase, and iDC matured correctly in presence of UC-MSC during the maturation phase only (data not shown).
Significantly higher concentrations of IFNγ, IL-6, MCP-1, IL-8, G-CSF, TGFβ and IL-10 were detected in iDCMSC versus iDC supernatants (Figure 1B). Compared to mDC, mDCMSC supernatants were significantly enriched in IL-6, MCP-1, G-CSF and TGFβ, while IFNγ, IL-8 and IL-10 were increased albeit not significantly. The production of IL12 (p70), a hallmark of mature DC, was absent from the mDCMSC condition (Figure 1B) suggesting a profound alteration of cell identity induced by the presence of UC-MSC. In comparison to i/mDC, i/mDCMSC supernatants contained a significantly higher concentration of the enzyme indoleamine 2,3-dioxygenase (IDO), which is typically secreted by MSC upon stimulation (Figure 1B). In all tested conditions, the levels of IL-5, IL-13, IL-17, IL-1B, IL-2 and IL-7 were below the detection threshold of 20 pg/ml (data not shown). Under these experimental settings, we cannot determine whether the high levels of IDO, IFNγ, IL-6, IL-8, MCP-1 and G-CSF secretion in the i/mDCMSC conditions could be attributed to the i/mDCMSC, the MSC or a combination of both. Mirroring the surface marker expression analysis, these results show that i/mDCMSC display a distinct cytokine secretion profile from i/mDC further confirming our observations that UC-MSC profoundly affect the canonical monocyte-to-DC differentiation process.
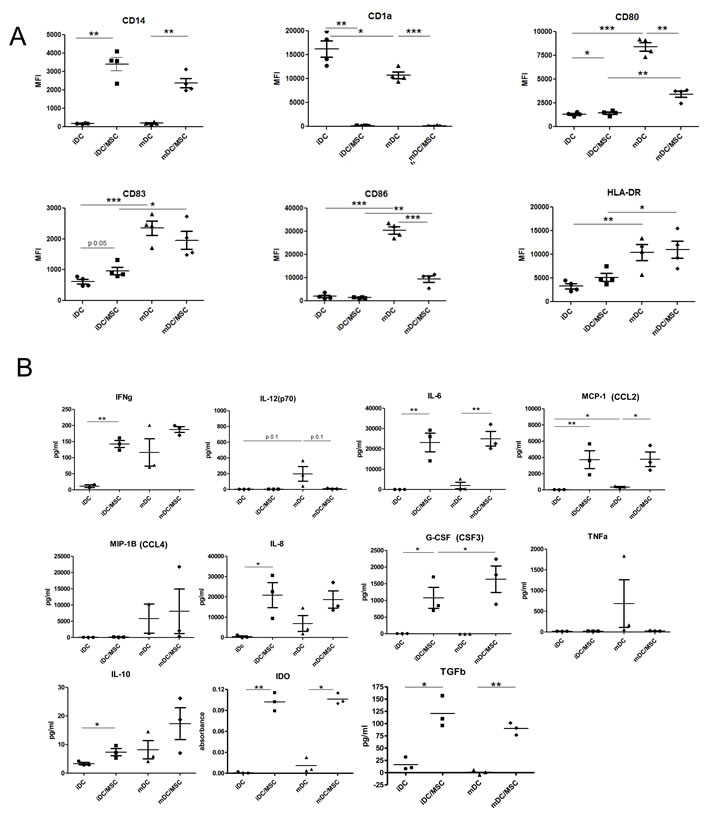
Figure 1: DC surface marker expression and cytokine secretion analysis from cultures of DC in presence or absence of UC-MSC. A. Monocytes were differentiated in the presence or absence of primary UC-MSC. At the end of the culture, cells were harvested and surface markers were analyzed by flow cytometry. The expression of CD1a (DC marker), CD80 and CD86 (co-stimulatory molecules), HLA-DR (important for antigen presentation) and CD83 (maturation marker) were assessed, gating on 7AAD neg (live) cells. UC-MSC were excluded from the analysis based on their higher size and granularity in respect to DC. Statistics: unpaired t-test, *p < 0.05, **p < 0.01, ***p < 0.0001. iDC were compared with iDCMSC and mDC, iDCMSC with mDCMSC, mDC with mDCMSC. MFI: mean fluorescent intensity. N = 4 different primary UC-MSC. B) The supernatant from DC differentiated from monocytes and matured by LPS in the presence or absence of UC-MSC was analyzed for cytokine release. Data refers to 3 independent experiments, run in duplicate, using primary UC-MSC. For some of the samples only 2 experiments were considered valid by the analysis software. Statistics: unpaired t-test, 2 tails, *p < 0.05, **p < 0.01, ***p < 0.0001.
Antigen uptake and migratory capacity are typical characteristics of iDC and mDC, respectively. We observed that iDCMSC cells were able to engulf Zymosan-coated beads with an efficiency comparable to that of iDC (Figure 2A), which indicates that iDCMSC are functional antigen presenting cells. Moreover, we tested the in vitro capacity of LPS-matured cells to move towards chemoattractants in a transwell system. CCL19 and CCL21 are potent mDC attractants and generate the gradient necessary for mDC homing to the lymph nodes [29]. We observed that 55-60% of plated mDC were able to reach the attractants whereas mDCMSC were unable to migrate (Figure 2B). To further support these findings in vivo, we took advantage of a mouse model already described for testing the potential of human DC migration [30]. We injected cells matured with LPS (mDC and mDCMSC) in the footpad of C57/B17 SCID mice and found that only mDC were able to reach the draining lymph node (Figure 2C).
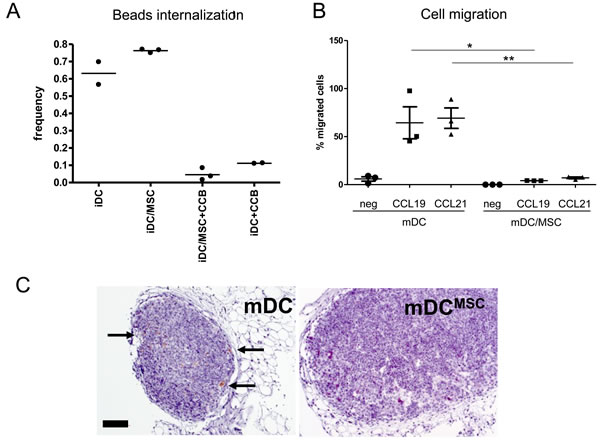
Figure 2: UC-MSC alter the function of monocyte-derived DC. A. Zymosan-coated PhRodo beads up-take by immature DC obtained on the presence or absence of primary UC-MSC (iDC and iDCMSC). Three different donors were tested. CCB = cytochalasin-B (up-take inhibitor). B. mDC and mDCMSC were harvested, counted and tested for their migratory capacity towards potent DC-attractant chemokines. The percentage of cells migrating in vitro towards medium only (circles) MIP3b = CCL19 (300 ng/ml, squares) and Exodus2 = CCL21 (500 ng/ml, triangles) is reported. MSC were eliminated from the culture before testing cellular migration. Statistics: unpaired t-test, 2 tails, *p < 0.05, **p < 0.01. Data were obtained from 3 independent experiments using 3 primary UC-MSC. C. Immunohistochemistry analysis of poplitear lymph node sections of mice upon footpad injection of either mDC or mDCMSC (upon MSC depletion). The staining shows human CD45+ cells. The data were obtained 24 hours after the injection of 2x10⁶ cells. For these experiments the MSC cell line was used.
i/mDCMSC have a M2-macrophage gene expression signature and morphology
To extensively characterize the effect of UC-MSC on monocyte-derived DC differentiation/maturation, we analyzed and compared the transcriptomes of purified iDC, mDC, iDCMSC and mDCMSC at the genome-wide level. The dendrogram of relationships after unbiased hierarchical clustering as well as principal component analysis (PCA) indicated that, irrespective of the donor, iDCMSC and mDCMSC had more similar phenotypes to each other than to iDCs and mDCs, which clustered together (Figure 3A, 3B), further corroborating the UC-MSC-induced modification of surface marker expression and cytokine secretion profiles. Comparison with publically-available expression profiling data (GEO dataset: GSE5099) showed that iDCMSC (and mDCMSC to a similar degree, see Figure S4) have a global transcriptional profile closer to that of M2-macrophages than to DC (Figure 3C). A more focussed analysis on classical macrophage (i.e. CD14, CD16, CD68) and M2-macrophage (i.e. CD163, IL10 and CXCR4 among others) gene transcripts [31] confirmed that in the presence of MSC, monocyte-to-DC differentiation was skewed towards M2-macrophages (Figure S5). Morphological studies (actin distribution, nuclear shape and cell size) by fluorescence microscopy confirmed that iDCMSC cells were strikingly different in comparison to iDC. Indeed, iDCMSC cells were smaller (3.43 times in average), with a cytoskeleton lacking the typical organization of filaments and focal adhesions (Figure 3D, 3E). Cellular protrusions were missing from iDCMSC and mDCMSC. Moreover upon LPS treatment, mDCMSC did not acquire the dendrites typical of mDC (Figure 3D). The size, shape and cytoplasmic appearance of both iDCMSC and mDCMSC were compatible with M2 macrophage morphology [32](Figure S6).
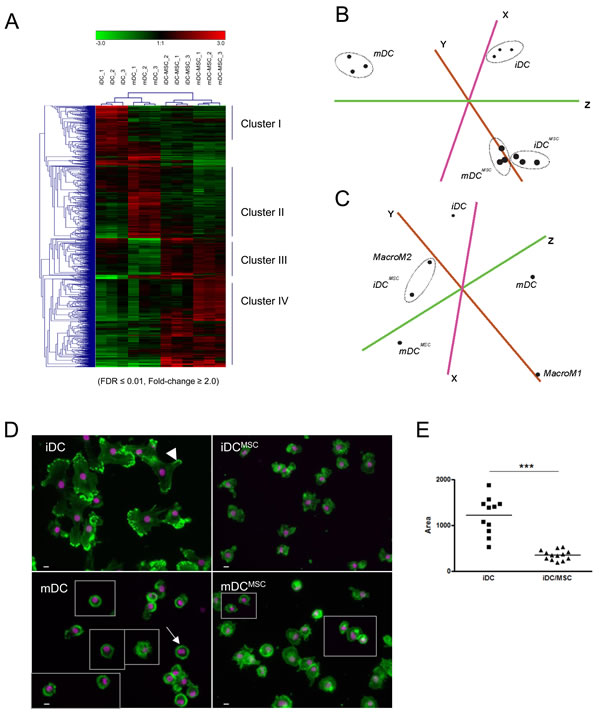
Figure 3: UC-MSC induce, in monocytes differentiating into DC, M2-macrophage expression signature and morphology. Monocytes were differentiated and eventually matured in presence or absence of UC-MSC. Gene expression profile was investigated after MSC removal form the culture. A. Total gene lists with Loess-normalized array signals were pruned according to criteria of enrichment (Fold-change ≥2.0, FDR≤0.01, Array signal>60) between iDC/iDCMSC or mDC/mDCMSC. Unique gene identifiers along with their normalized array signal values across samples (4 differentiation conditions, 3 donors per condition) were then submitted to Genesis tool for unbiased hierarchical clustering (average linkage option). Heat maps within each sample (column) indicate the relative expression value of a particular gene probe (row) compared to the averaged expression value of all the probes. Shades of red represent a higher signal compared to the average signal, whereas green shades represent a lower signal. B. Principal component analysis (PCA) of gene lists analyzed in panel A shows that iDCMSC and mDCMSC cluster very close together, while iDC and mDC are found farther from them and, as expected, apart from each other. C. PCA of our expression profiling data with publically-available data (GSE5099) indicates a strong similarity between iDCMSC and monocyte-derived M2 macrophages. D. Fluorescence microscopy shows that the presence of UC-MSC during differentiation/maturation phase alters DC morphology (iDCMSC and mDCMSC). For convenience, some cells were taken from distant part of the original picture and grouped; in this case, a light grey line indicates the border of the cropped field. In the upper left panel the arrowhead point to one of the cell protrusions typical of iDC and missing in iDCMSC. In the lower left panel the arrow points to the characteristic dendrites of mDC, missing in mDCMSC. Green: actin; pink: nuclei. Magnification 200x, bar: 10 microns. E. Area quantification analysis by ImageJ software shows a significant difference in size between iDC and iDCMSC. Statistics: unpaired t-test, ***p < 0.0001. Data obtained by using primary UC-MSC. Similar results were obtained when using an immortalized UC-MSC cell line (data not shown).
UC-MSC skew monocyte-DC differentiation towards Th2 polarizing cells
Since both transcriptome and morphological analysis indicated that the presence of UC-MSC during monocytes-DC differentiation resulted in the induction of cells similar to M2-macrophages, we tested the biological characteristics that distinguish these cells from regular in vitro differentiated DC. Although monocyte-derived DC as well as M1-macrophages are potent Th1 polarizing cells, M2-macrophages typically induce Th2 immune responses [26, 33]. To compare naïve T-cell polarization capacity, we cultured naïve CD4+ T-cells in the presence of allogeneic mDC or mDCMSC for 6 days and then stimulated them with activating beads. We observed that mDC induced a Th1 cytokine secretion profile (IFNγ high, IL-4, IL-5 and IL-10 low), while mDCMSC induced a Th2/regulatory profile (IFNγ low, IL-4, IL-5 and IL10 high) (Figure 4). We did not observe secretion of IL-17 in any of the conditions tested.
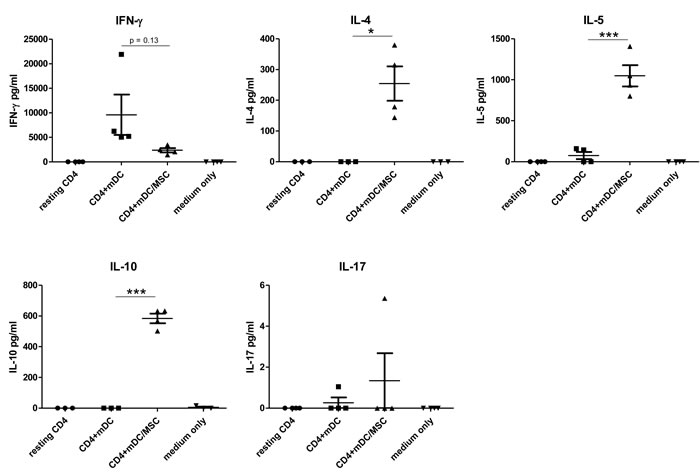
Figure 4: DC matured in presence of UC-MSC induce Th2 polarization of naïve CD4+ T-cells. Peripheral blood monocytes were differentiated into mature DC in absence (mDC) or presence (mDCMSC) of UC-MSCs. We used primary UC-MSCs derived from 4 cord units. Naïve CD4+ T-cells were isolated from adult peripheral blood. 50.000 naïve CD4+ T-cells were cultured for 6 days with 20.000 allogeneic DCs (either mDC or mDCMSC, upon MSC removal) or left resting. After 6 days, 80.000 cells were re-stimulated with activating beads (Dynabeads Human T activator CD3/CD28 by Invitrogen) in X-VIVO 15 serum free medium in a final volume of 200 ml according to the manufacturer instructions (ratio cells:beads = 1:1). After 24 hours the cell supernatant was collected and tested for the presence of Th1 (IFNγ), Th2 (IL-4 and IL-5), Treg (IL-10) and Th17 (IL17) cytokines. N = 3 independent experiments. Statistics: unpaired t-test, 2 tails. *p < 0.05, ***p < 0.0001.
Lactate secretion plays a key role in the alteration of DC differentiation induced by UC-MSC
To determine if the M2-macrophage differentiating capacity of UC-MSC was mediated by the release of a soluble factor, we stimulated monocytes with GM-CSF and IL-4 in presence of UC-MSC separating the two cell types by a transwell system. As shown in Figure S7, surface marker modifications were similar with the changes observed when cells were in contact (Figure 1A). Culture medium was harvested from iDC and iDCMSC cultures (day 2 of culture), diluted 1:2 with fresh medium containing GM-CSF and IL-4 and used to condition a second monocyte-into-DC differentiation culture. The medium collected from the iDCMSCculture was able to reproduce the effect of co-culture of monocytes with UC-MSC for both surface marker expression and cellular morphology (Figure S8A, B), while the medium obtained from the iDC culture did not alter the differentiation process (compare data referring to regular iDC and cells obtained by transferring iDC supernatant in Figure 5D). This confirms that the effect of UC-MSC is mediated by secreted factors.
It has previously been proposed that UC-MSC can affect immune cells through secretion of indoleamine 2,3-dioxygenase (IDO) or IL-6 [34-37]. We found that both IDO and IL-6 concentrations were significantly increased in the supernatant of UC-MSC/monocyte co-cultures (Figure 1B), in agreement with the hypothesis of a role played by these molecules in the UC-MSC effect. However, inhibiting their activity by using either 1-methyl-tryptophan or an IL-6 blocking antibody did not alter UC-MSC-mediated effect, indicating that neither IDO nor IL-6 played a key role in this process (not shown).
DC differentiation can be altered by the presence of high concentration of lactate, either endogenously produced or secreted by neighboring cells (i.e. in tumor microenvironment) [38, 39]. We observed that the presence of UC-MSC strongly induced lactate production (Figure 5A). The amount of lactate secretion by UC-MSC was independent of both the presence of cytokines and the contact between UC-MSC and monocytes (Figure S9), indicating that UC-MSC do not require a specific stimulus for lactate production. To evaluate the role of UC-MSC-secreted lactate in DC differentiation, we pre-treated UC-MSC for 1 hour with 2 mg/ml Oxamic acid (OXA, an inhibitor of the enzyme lactate dehydrogenase) before initiation of the co-culture of monocytes with UC-MSC. After 2 days of culture, lactate concentration was comparable to what was observed in the absence of UC-MSC (Figure 5B). Compared to iDCMSC, monocytes differentiated in the presence of UC-MSC pre-treated with OXA, showed a significant increase in CD1a expression and a significant decrease in the expression of CD14 and of the M2-macrophage markers CD16 and CD163 (Figure 5C). These findings indicate that OXA treatment impaired the effect of UC-MSC on iDCs. Moreover, medium collected from the co-culture of monocytes with OXA-pre-treated UC-MSC was not able to induce the iDCMSC phenotype (Figure 5D). Exogenously added lactate during DC differentiation inhibited the acquisition of CD1a in a dose-dependent fashion (Figure 5E). In agreement with the ability of UC-MSC to secrete lactate independently of their contact with monocytes (Figure S9), we found that the medium of UC-MSC cultured alone in the presence of GM-CSF and IL-4 was able to alter the phenotype of monocyte-derived DC (Figure S8C). When MSC were cultured alone in a medium without cytokines, the effect was still reproduced, but to a lesser extent and proportionally to the amount of secreted lactate (not shown).
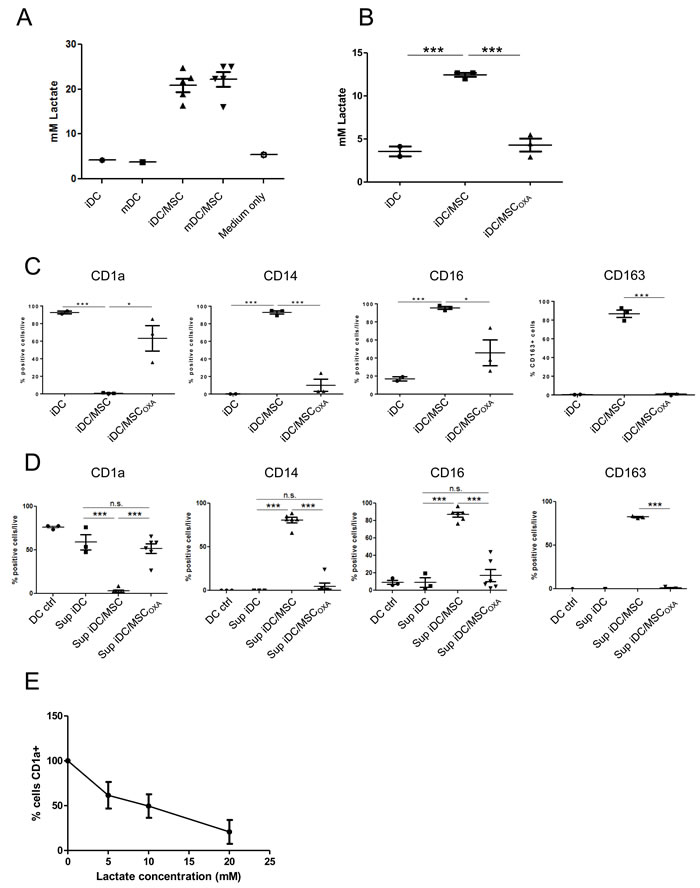
Figure 5: UC-MSC secrete high amount of lactate and inhibiting of lactate secretion eliminates their effect. A. Lactate concentration was measured in cell culture supernatant of iDC and mDC obtained in presence or absence of UC-MSC. Measure was done at day 7 of culture. B. When UC-MSC were pre-treated for 1 hour with 2 mg/ml Oxamic acid (OXA) before starting the co-culture with monocytes, the presence of lactate in the supernatant was completely abolished. Data refer to culture medium harvested at day 2 of culture. UC-MSC source: A) UC-MSC cell line and 4 different primary UC-MSC. B) 3 different primary UC-MSC. C. Monocyte-DC differentiation was induced in presence or absence of primary UC-MSC. At the end of the culture the obtained cells were characterized by flow cytometry and CD marker expression was evaluated as percentage of living positive cells. When UC-MSC were pre-treated with OXA, 2 mg/ml for 1 hour before the beginning of the co-culture, their effect was severely decreased (N = 3). D. Monocytes were differentiated into DC in the presence or not of UC-MSC. Where indicated, UC-MSC were pre-treated 1 hour with 2 mg/ml OXA before starting the co-culture. After 48 hours, culture supernatants were collected and used to condition a second DC differentiation. After 3 days, cells were harvested and tested for CD marker expression. The percentage of living cells positive for each marker is reported. Conditioning the culture medium with supernatant obtained from co-cultures monocytes-UC-MSC was able to reproduce the effect of UC-MSC. Of note, OXA pre-treatment strongly blocks this effect. iDC ctrl refers to DC differentiated for 3 days in absence of conditioned medium. Statistics: unpaired t-test, *p < 0.05, **p < 0.01, ***p < 0.001. E. Monocytes were differentiated into DC in presence of Lactate at different concentrations. We report the percentage of CD1a+ cells normalized on the percentage found in the control condition (no Lactate treatment). Cells were analyzed at day 3 of culture. N = 3.
UC-MSC alter the metabolism of differentiating DC
To retrieve relevant biological pathways associated with the effect of UC-MSC on monocyte-to-DC differentiation, we further analyzed the gene expression profile data by performing a functional classification analysis of differentially-expressed genes (FDR <= 0.01, Array signal>60) using the DAVID tool (version 6.7 [40, 41]) (Table 1). Focusing on the most highly-enriched functional terms between the transcriptome comparison of iDC with iDCMSC, we observed that genes related to mitochondrial function and oxidative phosphorylation had a strikingly lower representation in iDCMSC. Moreover, a query of mitochondrial proteome database [42] for the occurrence of mitochondrial gene products within the differentially-expressed [43] gene lists in iDC versus iDCMSC transcript comparison confirmed that mitochondrial genes were underrepresented in iDCMSC (Figure S10). This suggested the possibility that UC-MSC affect mitochondrion-related processes during the differentiation phase of monocytes into DC.
Table 1: Functional annotation analysis of differentially-expressed genes in iDC versus iDCMSC transcriptome comparison.
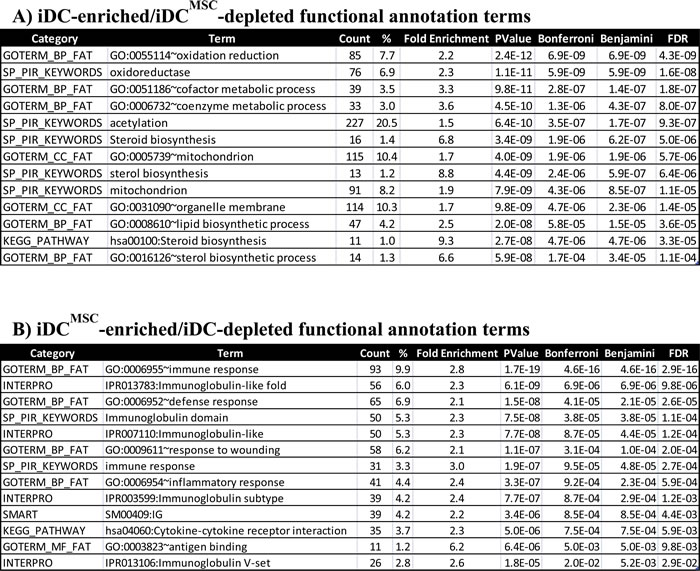
Lists of non-redundant differentially-expressed genes (FDR≤0.01, Array signal>60) were submitted to DAVID tool and queried for enrichment of functional terms compared to a background list of genes found in Agilent Human Genome arrays. (A) The list of 13 highly significant functional terms, for a total of 1108 iDC-enriched gene identifiers, are displayed. Mitochondrion-related processed are overrepresented. (B) The list of 13 highly significant functional terms, for a total of 938 iDC-enriched gene identifiers, are displayed. Genes related to immune response are overrepresented.
Metabolic reprogramming and consequent increase or decrease in the activity and number of mitochondria is a physiological requirement for DC differentiation and activation [44, 45]. The high concentration of lactate (a by-product of glycolysis) produced by UC-MSC in iDCMSC cultures together with the microarray pathway analysis suggested that a metabolic alteration could be responsible for the altered differentiation of the monocytes into DC. We observed that in presence of UC-MSC, differentiating DC showed a decreased mitochondrial mass, as revealed by MitoTracker staining (Figure 6A). When stained with JC-1, a sensor of mitochondrial polarization that changes the wavelength of emission according to the polarization of the organelle’s membrane turning from red (polarized) to green (depolarized), iDCMSC displayed higher ratio polarized/depolarized mitochondrial membrane (Figure 6B).
Because the membrane polarization is fundamental for mitochondrial ATP generation, a higher JC-1 polarized/depolarized ratio could mean either an increase in mitochondrial function or a reduction of oxidative phosphorylation with consequent accumulation of the membrane potential. To test this hypothesis, we measured the oxygen consumption rate during the differentiation of monocytes into DC in presence of medium collected from either iDC or iDCMSC. After 3 days of culture, cells were harvested and live oxygen consumption rate (OCR) was measured at baseline and in response to oligomycin, cyanide 3-chlorophenylhydrazone (CCCP) and rotenone/antimycin with a Seahorse analyzer. The OCR in response to CCCP indicates the maximal mitochondrial activity while the difference between the basal OCR and the OCR in response to CCCP is a measure of the spare respiratory capacity. As shown in Figure 6C, the presence of medium collected at day 2 from iDCMSC cultures lowered basal OCR. This effect was proportional to the lactate concentration measured in the conditioning medium (Figure 6D). Upon oligomycin treatment, the drop in OCR, evaluated as percentage of basal respiration, was comparable across the different treatments, indicating that ATP turnover (basal mitochondrial OCR used for ATP synthesis) and the coupling efficiency were not significantly affected (Figure 6E). Cells treated with medium collected form iDCMSC showed a considerably higher spare respiratory capacity (see green bar in Figure 6E). These observations are in accordance with data obtained with both MitoTracker and JC-1, as they show that cells treated with iDCMSC medium have lower basal respiration but more polarized mitochondrial membrane potential. Taken together, these data indicate that the medium harvested form an MSC-monocyte co-culture in the presence of GM-CSF and IL-4 altered the metabolic properties of monocytes differentiating into DC. Both the lower OCR and the higher spare respiratory capacity, compared to monocyte-derived DC obtained in absence of MSC, are compatible with an M2-macrophage metabolic profile [46].
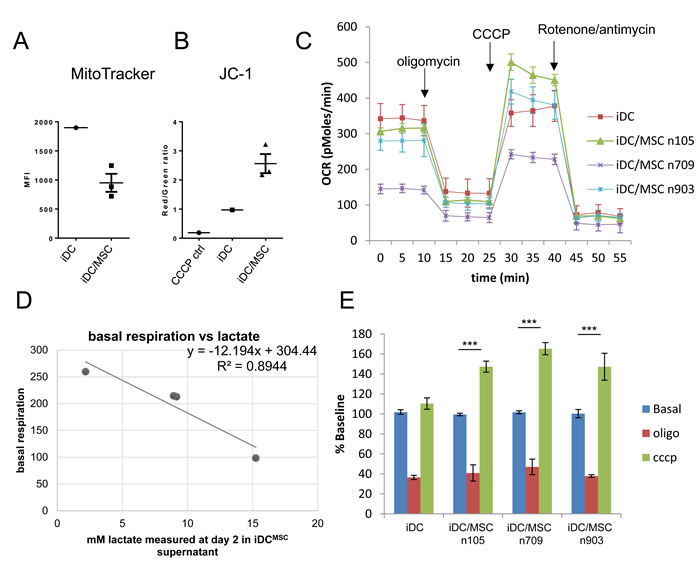
Figure 6: UC-MSC alter the metabolism of monocytes differentiating into DC. Monocytes were differentiated into immature DC in presence or absence of UC-MSC. At the end of the differentiation (day5), mitochondrial mass and mitochondrial membrane potential were assessed by MitoTracker (A) and JC-1 (B) staining by flow cytometry (UC-MSC were excluded from the analysis based on their higher physical parameters). The ratio between the red and green fluorescence of JC1 is proportional to the potential across the mitochondrial membrane. In both A. and B. we tested 3 different primary UC-MSC. C. Monocytes were stimulated to differentiate into DC in presence of medium conditioned by a previous culture in which monocytes were differentiated into DC in presence or absence of UC-MSC (iDC and iDCMSC, supernatant collected at day 2). At day 3 cells were harvested and oxygen consumption rate (OCR) was measured at the basal level and in response to specific drugs with a Seahorse instrument. Three primary UC-MSC were used for the experiment and the basal OCR of the tested cultures was proportional to the amount of lactate present in the medium conditioned by UC-MSC D. E. We report the variation of OCR normalized on the basal consumption to put in evidence the variation in spare respiratory capacity induced by the medium conditioned by UC-MSC. Statistics: t-test, ***p≤0.001.The numbers 105, 709 and 903 refer to the ID of the 3 primary UC-MSC used for the experiment. All experiments have been independently performed with two different normal donors in response to the 3 primary UC-MSC with consistent results. Bars in C and E indicate standard deviation.
DISCUSSION
In the present work, we investigated the effect of UC-MSC on monocyte-derived DC differentiation. We show for the first time that human UC-MSC divert the differentiation of human monocytes from DC towards M2-macrophages by metabolic reprogramming through lactate secretion. These data suggest that MSC may induce immunomodulation by supporting M2-macrophage differentiation, as M2-macrophages have been reported to have anti-inflammatory, tissue repair-inducing properties [26]. Despite the difficulty of tracking intravenously injected MSC in vivo [47], several line of evidence indicate that MSC, as well as monocytes, are recruited to the site of inflammation [2, 48, 49] suggesting the possibility of interactions between these two cell types in areas of tissue damage or infection.
Although it has been shown that MSC interfere with human monocyte-derived DC differentiation [50] and several soluble factors (i.e. IDO, IL-6, PGE-2, GRO-γ) have been proposed as mediators [36, 51-54], this is the first time that the metabolic reprogramming ability of MSC through lactate secretion is highlighted as a mechanism of action in MSC-induced immunomodulation. Previous reports on the MSC-mediated M2 polarizing effect are scarce. It has previously been shown that co-culture of human peripheral blood mononuclear cells with bone marrow-derived MSC (BM-MSCs) stimulated by interferon-gamma induced a small fraction of monocytes to differentiate into M2-like macrophages [37] based on the acquisition of the CD206 surface marker and IL-10 expression. Our study not only confirms these findings by using CD163, which is another M2-macrophage surface marker, but also provides a much more extensive analysis of the cells obtained in presence of MSC focusing on both phenotypical and functional properties. In our experimental conditions, by differentiating monocytes into DC with GM-CSF and IL-4, we showed that cells differentiated in presence of UC-MSCs exhibited membrane antigen expression (CD1a-, CD80low, CD83low, CD86+, HLA-DR+, CD16+, CD163+), morphology, migration properties, antigen uptake capacity, gene expression profile, Th2 polarizing ability and metabolic profile that are all characteristic of or compatible with an M2-macrophage phenotype [26].
We propose lactate secretion as an important mediator of the effect of UC-MSC. Indeed, pre-treating UC-MSC with a lactate dehydrogenase inhibitor (oxamic acid) before their co-culture with monocytes, decreased the concentration of lactate in the supernatant and inhibited the UC-MSC effect. The abrogation of the effect of UC-MSC by oxamic acid pre-treatment was observed both in MSC-monocyte co-cultures and upon transfer of iDCMSC supernatant. Interestingly, it has been shown that cancer cells are able to polarize DC towards tolerogenic cells by poisoning the tumour microenvironment with high amount of lactate [39, 55], indicating that modification of local lactate concentration is a signal tuning immune response. Because we found that UC-MSC secrete high amount of lactate, it is tempting to postulate that they can induce immune response inhibition in vivo by the same mechanism. Importantly, it has been shown that, when cultured in vitro at high cellular density, monocytes were not able to differentiate into DC and failed to produce IL-12 due to the accumulation of lactate in the culture medium [38]. In agreement with these findings, we observed that, following exogenous administration of lactate during DC differentiation (in absence of UC-MSC), the efficiency of the differentiation process was inversely correlated with the lactate concentration in the culture medium.
By interrogating our microarray data, we observed that in presence of UC-MSC, cells modulated the expression of genes related to energetic metabolism. It is well documented that immune cells undergo metabolic switches to elicit specific functions [46]. For example, DC maturation is accompanied by increased glycolysis[56]. The pivotal role of cell metabolism in DC differentiation has been previously demonstrated by showing that monocytes differentiating into DC undertake active mitochondrial biogenesis and that treatment with rotenone inhibits differentiation by blocking oxidative phosphorylation [44, 57]. Further pathway analysis of our data revealed that, in comparison to iDC, iDCMSC down-regulated genes that are associated with mitochondrial activity and oxidative phosphorylation. BM-MSC have been proposed to promote cancer cell survival in the presence of pro-apoptotic treatment by regulating mitochondrial activity and fostering the Warburg effect [58]. In our setting, the analysis of mitochondria by MitoTracker and JC-1 staining revealed that cells differentiated in the presence of UC-MSC presented lower mitochondrial mass but more polarized mitochondrial membrane potential. These data were confirmed by real time analysis of the OCR in response to different drugs targeting mitochondrial function. The basal OCR was lower in cells treated with iDCMSC-conditioned medium and directly proportional to the lactate produced by the primary UC-MSC, which is in agreement with the lower MitoTracker mean fluorescent intensity. The lower OCR and higher spare respiratory capacity detected in cells treated with iDCMSC-conditioned medium suggest that these cells are not relying as much on oxidative phosphorylation to meet their energetic needs, but are primed to promptly respond to stimuli, consistent with what has been shown for M2-macrophages [59]. Based on our data, we propose that UC-MSC-secreted lactate modifies the mitochondrial activity of differentiating cells and induces a skew towards M2-macrophages by metabolic reprogramming (depicted in Figure 7).
The detailed mechanism(s) by which UC-MSC-secreted lactate can achieve the observed metabolic alterations remain unknown. Based on current knowledge, exogenous lactate can modify the cellular homeostasis either by directly trafficking through monocaboxylic transporters (MCTs) or by triggering a specific receptor, HCAR1. In the former case, the molecule physically moves across the plasma membrane, while in the latter, it triggers a yet uncharacterized intracellular pathway. It will be interesting to study the pathway by which UC-MSC-secreted lactate induces these modifications in differentiating monocytes and the link with mitochondrial metabolism. Lactate agonists have been shown to cure lipolysis in both mice and humans without generating cutaneous flushing [60, 61]. It has been suggested that Langerhans cells, that are responsible for the flushing, are sensitive to HCAR1 stimulation, thereby directly connecting the effect of lactate with antigen presenting cell activity [62]. Moreover, in mice, lactate decreases liver and pancreatic damage by innate immunity inhibition [63]. These reports are in agreement with an immunomodulatory function of lactate in vivo. The idea of using lactate secretion as a tool for locally tuning myeloid cell plasticity to achieve immune regulation opens interesting avenues from a translational point of view. The feasibility of such an approach has been successfully demonstrated for human cancers [64]. Finally, the observation that the amount of lactate produced by the different primary UC-MSC was donor-dependent could be further explored for the development of biomarkers predicting the efficacy of UC-MSC as immunomodulators.
In summary, we demonstrated that the presence of UC-MSC during the GM-CSF/IL-4-induced differentiation of human monocytes, skewed the differentiation towards M2 macrophages instead of DC. This effect was largely due to MSC-secreted lactate that induced metabolic modifications. Our findings could have potential clinical implications considering that MSC cell therapy could be replaced/accompanied by drugs targeting metabolic modulation by lactate.
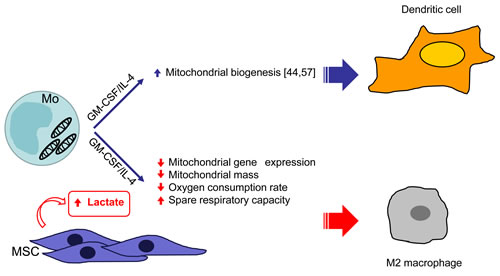
Figure 7: schematic representation of the effect of UC-MSC on the metabolism of monocyte-derived DC inducing M2 macrophages.
MATERIALS AND METHODS
Human samples
Human peripheral blood mononuclear cells were obtained by Ficoll-Hypaque separation from peripheral blood or leukapheresis from healthy donors following informed written consent approved by ethical committee.
Chemicals
Oxamic acid (O3750) and L-(+)-Lactate (L6402) were from Sigma Aldrich, St. Louis, MO.
UC-MSC isolation and culture
Primary UC-MSC were obtained cells from 4 different cord units upon collagenase digestion. Stromal cells were tested by flow cytometry as CD44+,CD31-,CD105+,CD90+,CD45- upon gating on live cells (7AAD-). Unless specified in the figure legend, all the presented data refer to primary UC-MSC, either isolated form umbilical cords in our Institution or kindly provided by Hema-Québec. The latter were certified for both marker expression and tri-lineage differentiation capacity. In both cases informed consent from the mothers was obtained. For experiments requiring a large number of cells we used immortalized human cord-blood MSC as previously described [10, 65].
DC differentiation and maturation
Monocytes were isolated by CD14 positive selection (Stemcell Technology, Vancouver, BC, Canada) (purity above 95%). Cells (5x10⁵/mL) were cultured for 5 days in the presence of human recombinant granulocyte-macrophage colony-stimulating factor (GM-CSF) (50 ng/mL; R&D Systems, Minneapolis, MN) and IL-4 (10 ng/mL; eBioscience, San Diego, CA) to obtain immature DCs (iDCs). Mature DCs (mDCs) were obtained by stimulating iDCs with lipopolysaccharides (LPS) (1 µg/mL; Sigma, St Louis, MO) for 2 additional days, as previously described [65]. Every 2-3 days, half of the medium was replaced by fresh medium with cytokines. UC-MSC (ratio MSC:monocytes = 1:5) were plated during the phase of DC differentiation and maturation according to the scheme reported in Figure S1. In experiments requiring co-culture of monocytes and MSC without physical contact, cells were separated by a transwell system. Briefly, 2x10⁵ monocytes were plated in the bottom chamber of a 24 well plate, separated from MSC (4x10⁴) by a 0.4 µm porous membrane (Corning, Tewksbury, MA). When needed (i.e. for DC mRNA extraction) UC-MSC were depleted from the culture based on their adhesive properties and purity of the obtained cells was tested by flow cytometry (above 95% of cells were CD45+). The phenotype of monocytes, immature DC (iDC) and mature DC (mDC) was tested by flow cytometry as previously described [65].
Immunofluorescence
Cells were plated on poly-lysine treated coverslips, fixed and permeabilized (Cytofix-cytoperm kit, BD Bioscience). Actin filaments were visualized with Phalloidin-Alexa488 (Life Technologies, Burlington, Canada) and nuclei with DAPI. Cells were analyzed with Olympus BX51 fluorescence microscope equipped with a Retiga 2000R camera (QImaging, Surrey, Canada). Overlays were obtained using Photoshop software. Area analysis was performed by using the free software ImageJ available at http://imagej.nih.gov/ij/index.html.
Cytokine production analysis
Cytokines in cell culture supernatants were analyzed by Bio-Plex Pro Human Cytokine 17-plex Assay (Bio-Rad Laboratories, Mississauga, Canada) according to the manufacturer’s recommendation. Results were analyzed on a CS 1000 Autoplex Analyzer (Perkin Elmer Inc., Waltham, MA). TGFβ was detected by ELISA (R&D Systems).
IDO quantification
The enzyme IDO catalyzes the degradation of the essential amino acid L-tryptophan to N-formylkynurenine, which can be quantified in a colorimetric assay as described [66]. Briefly, supernatant was diluted with as solution of 30% trichloracetic acid (ratio 2:1), and incubated 30 minutes at 50°C. Samples were spin 1 minute at 15.400g and the supernatant was collected and diluted 1:1 with Ehrlich’s reagent. Absorbance at 490 nm was detected with an ELISA plate reader and control wells values subtracted.
In vitro migration assay
25.000 mature DC obtained or not in presence of UC-MSC were plated on top of a 5 µm pores filter (Neuroprobe ChemoTx®system) and allowed to migrate for 2 hours at 37°C towards either medium only (RPMI medium containing 0.2% BSA) or attractant chemokines (CCL19, 300 ng/ml, CCL21, 500 ng/ml, both from PeproTech). Cells remaining in the upper compartment were gently removed, the plate was centrifuged and migrated cells were manually counted.
In vivo migration assay
To test the migratory properties of mature human DC in vivo, we referred to the model described by Zhang et al [30]. 2 x10⁶ cells (either mDC or mDCMSC) were injected in the footpad of anesthetized C57/B17 SCID mice (Charles River). After 24 hours mice were anesthetized and foot pads were injected with 30 µl Evan’s blue (0.1% in PBS). After 10 minutes animals were euthanized, poplitear lymph nodes were surgically removed and fixed in 3.7% formalin. Lymph nodes were paraffin embedded and 5 µm sections were stained with anti-human CD45 (DAKO, Burlington, Canada). The protocol has been approved by the Sainte-Justine Hospital’s ethical committee for animal experimentation (CIBPAR).
Antigen up-take assay
iDC and iDC/MSC (105 cells/test) were incubated for 90 minutes at 37°C with pHRodo Green Zymosan-coated beads (ThermoFisher Scientific, Burlington, ON) according to the manufacturer’s instructions. As negative control, cells were pre-incubated with 2 µg/ml Cytochalasin-B (Sigma Aldrich), an inhibitor of the engulfment process. Cells were analyzed by flow cytometry and frequency of internalized beads was calculated.
Expression profiling analysis
Total RNA was extracted from dendritic cell samples using QIAzol Lysis Reagent (Qiagen) and purified using mRNA Easy Kit (Qiagen, Valencia, CA). RNA concentration was measured with Nano Drop ND-1000 Spectrophotometer (Nano Drop Technologies, Wilmington, USA) and its quality assessed with an Agilent 2100 Bioanalyser (Agilent Technologies, Waldbronn, Germany). High quality RNA from samples as well as Universal Human Reference RNA (Stratagene, Santa Clara, CA) were separately labeled with Cy5 and Cy3, respectively, using LowInput QiuckAmp Labeling Kit (Agilent Technologies, Santa Clara, CA). These were hybridized together onto Agilent Chip Whole Human genome, 4x44K (Agilent Technologies) according to the manufacturer recommendations. After analysis of the two-color array images by Agilent’s Feature Extraction software, raw array data was pre-processed and normalized using FlexArray software (Genome Quebec, Canada) and the Bioconductor package. Simple Loess normalization was performed without background correction of the raw data after which differential expression and statistical significance were assessed using the “limma” algorithm [67]. More stringent correction of the resulting p-values was done by calculating the false discovery rate (FDR) according to the Benjamini-Hochberg method [68]. In order to compare expression profiling data obtained from different platforms, we used the DWD algorithm [69] for cross-platform normalization prior to hierarchical clustering and PCA analysis, which were done using Genesis software [70]. Microarray data used in this study are available at the Gene Expression Omnibus (GEO, http://www.ncbi.nlm.nih.gov/geo/) repository (GSE68962).
Th1/Th2/Th17 polarization analysis
Naïve CD4+ T-cells were isolated by sorting CD25- CD45RO- cells with a BD FacsAria cell-sorter upon CD4 enrichment. The purity of the collected naïve cells was above 95%. 50.000 naïve CD4+ T-cells were cultured in presence of 20.000 DC (either mDC or mDCMSC) or left unstimulated. MSC were depleted from the mDCMSC culture as described in the methods section. At day 6 cells were harvested, counted, and 80.000 cells were re-stimulated for 24 hours with activating beads (Dynabeads Human T activator CD3/CD28 by Invitrogen) in X-VIVO 15 serum free medium in a final volume of 200 µl according to the manufacturer instructions. Secreted IFNγ, IL-4, IL-10, IL-5 and IL-17 were quantified by ELISA (IFNγ and IL-4 ELISA kits were from Peprotech, IL-10 and IL-17 from eBioscience, IL-5 from R&D Systems). Experiments were done in triplicate using the cord-blood derived MSC cell line and 4 times with primary UC-MSC derived from 4 different cord units.
Lactate measurement
Secreted lactate was measured using either the Glycolysis Cell-Based Assay Kit by Cayman or an Architect c8000 analyzer (Abbott, Abbott Park, Illinois, USA).
Mitochondria analysis
Mitochondria were quantified by staining the cells with MitoTracker® Deep Red FM (Life Technologies). Mitochondrial polarization was measured by staining the cells with JC-1 (5,5’,6,6’-tetrachloro-1,1’,3,3’-tetraethylbenzimidazolylcarbocyanine iodide, Invitrogen). Cells were analyzed by flow cytometry.
Metabolism analysis
Medium was harvested at day 2 from either iDC or iDCMSC cultures, tested for lactate concentration and used for conditioning a new monocytes-DC differentiation. After 3 days cells were harvested and plated in a poly-lysine treated Seahorse 24well plate (200.000 cells/well). The rate of oxygen consumption deriving from mitochondrial OXPHOS was assessed using an extracellular flux analyzer (Seahorse Biosciences) according to manufacturer recommendations. After measuring basal respiration, ATP-linked OCR (ATP turnover) were determined by injecting oligomycin (1 µM). CCCP, an uncoupler of the electron transport chain, was used at a concentration of 1.5 µM to determine the maximal respiration rate. Rotenone (1 µM), an inhibitor of Complex I, and Antimycin A (1 µM), an inhibitor of Complex III, were used to completely inhibit mitochondrial electron transport to determine non-mitochondrial oxygen consumption. Mitochondrial basal respiration, ATP turnover, and the maximal respiration were calculated after correcting for the non-mitochondrial OCR.
Statistics
Results were analyzed using GraphPad Prism version 5.0 (GraphPad Software Inc., La Jolla, CA). Error bars indicate standard error mean, unless specified. To compare different conditions unpaired t-test was used. Significance was set at p ≤ 0.05.
Acknowledgments
We are thankful to Graziella Di Cristo for helping with fluorescence microscopy images. We acknowledge Zoulfia Allakhverdieva and Ekat Kritikou for assistance in manuscript discussion and editing.
Conflicts of Interest
The authors have no conflict of interest to declare.
Grant support
This work was funded by FRQS, Fonds de la Recherche en Santé du Québec (Fonds de recherches en médecine transfusionnelle, en greffe et en biovigilance 2010-2013). SS received a scholarship from La Fondation CHU Sainte-Justine and from the Pediatric Immunodeficiency Treatment Consortium (PIDTC, grant number U54AI082973). EH was a scholar of the Fondation de la Recherche en Santé du Québec (FRQS).
References
1. English K. Mechanisms of mesenchymal stromal cell immunomodulation. Immunol Cell Biol. 2013; 91(1):19-26.
2. Wang Y, Chen X, Cao W and Shi Y. Plasticity of mesenchymal stem cells in immunomodulation: pathological and therapeutic implications. Nat Immunol. 2014; 15(11):1009-1016.
3. Bernardo ME, Pagliara D and Locatelli F. Mesenchymal stromal cell therapy: a revolution in Regenerative Medicine? Bone Marrow Transplant. 2012; 47(2):164-171.
4. Le Blanc K, Frassoni F, Ball L, Locatelli F, Roelofs H, Lewis I, Lanino E, Sundberg B, Bernardo ME, Remberger M, Dini G, Egeler RM, Bacigalupo A, Fibbe W and Ringden O. Mesenchymal stem cells for treatment of steroid-resistant, severe, acute graft-versus-host disease: a phase II study. Lancet. 2008; 371(9624):1579-1586.
5. Ciccocioppo R, Bernardo ME, Sgarella A, Maccario R, Avanzini MA, Ubezio C, Minelli A, Alvisi C, Vanoli A, Calliada F, Dionigi P, Perotti C, Locatelli F and Corazza GR. Autologous bone marrow-derived mesenchymal stromal cells in the treatment of fistulising Crohn’s disease. Gut. 2011; 60(6):788-798.
6. Karussis D, Karageorgiou C, Vaknin-Dembinsky A, Gowda-Kurkalli B, Gomori JM, Kassis I, Bulte JW, Petrou P, Ben-Hur T, Abramsky O and Slavin S. Safety and immunological effects of mesenchymal stem cell transplantation in patients with multiple sclerosis and amyotrophic lateral sclerosis. Arch Neurol. 2010; 67(10):1187-1194.
7. Yi T and Song SU. Immunomodulatory properties of mesenchymal stem cells and their therapeutic applications. Arch Pharm Res. 2012; 35(2):213-221.
8. Maxson S, Lopez EA, Yoo D, Danilkovitch-Miagkova A and Leroux MA. Concise review: role of mesenchymal stem cells in wound repair. Stem Cells Transl Med. 2012; 1(2):142-149.
9. Mouiseddine M, Francois S, Souidi M and Chapel A. Intravenous human mesenchymal stem cells transplantation in NOD/SCID mice preserve liver integrity of irradiation damage. Methods Mol Biol. 2012; 826:179-188.
10. Gregoire-Gauthier J, Selleri S, Fontaine F, Dieng MM, Patey N, Despars G, Beausejour CM and Haddad E. Therapeutic efficacy of cord blood-derived mesenchymal stromal cells for the prevention of acute graft-versus-host disease in a xenogenic mouse model. Stem Cells Dev. 2012; 21(10):1616-1626.
11. Landry Y, Le O, Mace KA, Restivo TE and Beausejour CM. Secretion of SDF-1alpha by bone marrow-derived stromal cells enhances skin wound healing of C57BL/6 mice exposed to ionizing radiation. J Cell Mol Med. 2010; 14(6B):1594-1604.
12. Bianco P, Cao X, Frenette PS, Mao JJ, Robey PG, Simmons PJ and Wang CY. The meaning, the sense and the significance: translating the science of mesenchymal stem cells into medicine. Nature medicine. 2013; 19(1):35-42.
13. Bianco P. Reply to MSCs: science and trials. Nature medicine. 2013; 19(7):813-814.
14. Pittenger MF. MSCs: science and trials. Nature medicine. 2013; 19(7):811.
15. Phinney DG, Galipeau J, Krampera M, Martin I, Shi Y and Sensebe L. MSCs: science and trials. Nature medicine. 2013; 19(7):812.
16. Fibbe WE, Dazzi F and LeBlanc K. MSCs: science and trials. Nature medicine. 2013; 19(7):812-813.
17. Lucchini G, Introna M, Dander E, Rovelli A, Balduzzi A, Bonanomi S, Salvade A, Capelli C, Belotti D, Gaipa G, Perseghin P, Vinci P, Lanino E, et al. Platelet-lysate-expanded mesenchymal stromal cells as a salvage therapy for severe resistant graft-versus-host disease in a pediatric population. Biology of blood and marrow transplantation. 2010; 16(9):1293-1301.
18. Resnick IB, Barkats C, Shapira MY, Stepensky P, Bloom AI, Shimoni A, Mankuta D, Varda-Bloom N, Rheingold L, Yeshurun M, Bielorai B, Toren A, Zuckerman T, Nagler A and Or R. Treatment of severe steroid resistant acute GVHD with mesenchymal stromal cells (MSC). American journal of blood research. 2013; 3(3):225-238.
19. Introna M, Lucchini G, Dander E, Galimberti S, Rovelli A, Balduzzi A, Longoni D, Pavan F, Masciocchi F, Algarotti A, Mico C, Grassi A, Deola S, et al. Treatment of graft versus host disease with mesenchymal stromal cells: a phase I study on 40 adult and pediatric patients. Biology of blood and marrow transplantation. 2014; 20(3):375-381.
20. Blazar BR, Murphy WJ and Abedi M. Advances in graft-versus-host disease biology and therapy. Nat Rev Immunol. 2012; 12(6):443-458.
21. Banchereau J and Steinman RM. Dendritic cells and the control of immunity. Nature. 1998; 392(6673):245-252.
22. Steinman RM. The dendritic cell system and its role in immunogenicity. Annual review of immunology. 1991; 9:271-296.
23. Lipscomb MF and Masten BJ. Dendritic cells: immune regulators in health and disease. Physiological reviews. 2002; 82(1):97-130.
24. Sica A and Mantovani A. Macrophage plasticity and polarization: in vivo veritas. J Clin Invest. 2012; 122(3):787-795.
25. Gabrilovich DI, Ostrand-Rosenberg S and Bronte V. Coordinated regulation of myeloid cells by tumours. Nat Rev Immunol. 2012; 12(4):253-268.
26. Mantovani A, Biswas SK, Galdiero MR, Sica A and Locati M. Macrophage plasticity and polarization in tissue repair and remodelling. J Pathol. 2013; 229(2):176-185.
27. Chapuis F, Rosenzwajg M, Yagello M, Ekman M, Biberfeld P and Gluckman JC. Differentiation of human dendritic cells from monocytes in vitro. European journal of immunology. 1997; 27(2):431-441.
28. Li DY, Gu C, Min J, Chu ZH and Ou QJ. Maturation induction of human peripheral blood mononuclear cell-derived dendritic cells. Experimental and therapeutic medicine. 2012; 4(1):131-134.
29. Randolph GJ, Ochando J and Partida-Sanchez S. Migration of dendritic cell subsets and their precursors. Annual review of immunology. 2008; 26:293-316.
30. Zhang X, de Chickera SN, Willert C, Economopoulos V, Noad J, Rohani R, Wang AY, Levings MK, Scheid E, Foley R, Foster PJ and Dekaban GA. Cellular magnetic resonance imaging of monocyte-derived dendritic cell migration from healthy donors and cancer patients as assessed in a scid mouse model. Cytotherapy. 2011; 13(10):1234-1248.
31. Martinez FO, Gordon S, Locati M and Mantovani A. Transcriptional profiling of the human monocyte-to-macrophage differentiation and polarization: new molecules and patterns of gene expression. J Immunol. 2006; 177(10):7303-7311.
32. Douglas SD and Tuluc F. (2010). Chapter 67. Morphology of Monocytes and Macrophages. In: Lichtman MA, Kipps TJ, Seligsohn U, Kaushansky K and Prchal JT, eds. Williams Hematology, 8e. (New York, NY: The McGraw-Hill Companies).
33. Mosser DM and Edwards JP. Exploring the full spectrum of macrophage activation. Nat Rev Immunol. 2008; 8(12):958-969.
34. Melief SM, Geutskens SB, Fibbe WE and Roelofs H. Multipotent stromal cells skew monocytes towards an anti-inflammatory interleukin-10-producing phenotype by production of interleukin-6. Haematologica. 2013; 98(6):888-895.
35. Jiang XX, Zhang Y, Liu B, Zhang SX, Wu Y, Yu XD and Mao N. Human mesenchymal stem cells inhibit differentiation and function of monocyte-derived dendritic cells. Blood. 2005; 105(10):4120-4126.
36. Nauta AJ, Kruisselbrink AB, Lurvink E, Willemze R and Fibbe WE. Mesenchymal stem cells inhibit generation and function of both CD34+-derived and monocyte-derived dendritic cells. J Immunol. 2006; 177(4):2080-2087.
37. Francois M, Romieu-Mourez R, Li M and Galipeau J. Human MSC suppression correlates with cytokine induction of indoleamine 2,3-dioxygenase and bystander M2 macrophage differentiation. Mol Ther. 2012; 20(1):187-195.
38. Nasi A, Fekete T, Krishnamurthy A, Snowden S, Rajnavolgyi E, Catrina AI, Wheelock CE, Vivar N and Rethi B. Dendritic cell reprogramming by endogenously produced lactic acid. J Immunol. 2013; 191(6):3090-3099.
39. Gottfried E, Kunz-Schughart LA, Ebner S, Mueller-Klieser W, Hoves S, Andreesen R, Mackensen A and Kreutz M. Tumor-derived lactic acid modulates dendritic cell activation and antigen expression. Blood. 2006; 107(5):2013-2021.
40. Huang da W, Sherman BT and Lempicki RA. Systematic and integrative analysis of large gene lists using DAVID bioinformatics resources. Nature protocols. 2009; 4(1):44-57.
41. Huang da W, Sherman BT and Lempicki RA. Bioinformatics enrichment tools: paths toward the comprehensive functional analysis of large gene lists. Nucleic acids research. 2009; 37(1):1-13.
42. Cotter D, Guda P, Fahy E and Subramaniam S. MitoProteome: mitochondrial protein sequence database and annotation system. Nucleic acids research. 2004; 32(Database issue):D463-467.
43. Abumaree M, Al Jumah M, Pace RA and Kalionis B. Immunosuppressive properties of mesenchymal stem cells. Stem Cell Rev. 2012; 8(2):375-392.
44. Del Prete A, Zaccagnino P, Di Paola M, Saltarella M, Oliveros Celis C, Nico B, Santoro G and Lorusso M. Role of mitochondria and reactive oxygen species in dendritic cell differentiation and functions. Free radical biology & medicine. 2008; 44(7):1443-1451.
45. Everts B and Pearce EJ. Metabolic control of dendritic cell activation and function: recent advances and clinical implications. Front Immunol. 2014; 5:203.
46. Ganeshan K and Chawla A. Metabolic regulation of immune responses. Annual review of immunology. 2014; 32:609-634.
47. Eggenhofer E, Luk F, Dahlke MH and Hoogduijn MJ. The life and fate of mesenchymal stem cells. Front Immunol. 2014; 5:148.
48. Shi C and Pamer EG. Monocyte recruitment during infection and inflammation. Nat Rev Immunol. 2011; 11(11):762-774.
49. Wagner B and Henschler R. Fate of intravenously injected mesenchymal stem cells and significance for clinical application. Adv Biochem Eng Biotechnol. 2013; 130:19-37.
50. Ramasamy R, Fazekasova H, Lam EW, Soeiro I, Lombardi G and Dazzi F. Mesenchymal stem cells inhibit dendritic cell differentiation and function by preventing entry into the cell cycle. Transplantation. 2007; 83(1):71-76.
51. Djouad F, Charbonnier LM, Bouffi C, Louis-Plence P, Bony C, Apparailly F, Cantos C, Jorgensen C and Noel D. Mesenchymal stem cells inhibit the differentiation of dendritic cells through an interleukin-6-dependent mechanism. Stem Cells. 2007; 25(8):2025-2032.
52. Spaggiari GM, Abdelrazik H, Becchetti F and Moretta L. MSCs inhibit monocyte-derived DC maturation and function by selectively interfering with the generation of immature DCs: central role of MSC-derived prostaglandin E2. Blood. 2009; 113(26):6576-6583.
53. Chen HW, Chen HY, Wang LT, Wang FH, Fang LW, Lai HY, Chen HH, Lu J, Hung MS, Cheng Y, Chen MY, Liu SJ, Chong P, Lee OK and Hsu SC. Mesenchymal stem cells tune the development of monocyte-derived dendritic cells toward a myeloid-derived suppressive phenotype through growth-regulated oncogene chemokines. J Immunol. 2013; 190(10):5065-5077.
54. Saeidi M, Masoud A, Shakiba Y, Hadjati J, Mohyeddin Bonab M, Nicknam MH, Latifpour M and Nikbin B. Immunomodulatory effects of human umbilical cord Wharton’s jelly-derived mesenchymal stem cells on differentiation, maturation and endocytosis of monocyte-derived dendritic cells. Iranian journal of allergy, asthma, and immunology. 2013; 12(1):37-49.
55. Colegio OR, Chu NQ, Szabo AL, Chu T, Rhebergen AM, Jairam V, Cyrus N, Brokowski CE, Eisenbarth SC, Phillips GM, Cline GW, Phillips AJ and Medzhitov R. Functional polarization of tumour-associated macrophages by tumour-derived lactic acid. Nature. 2014; 513(7519):559-63.
56. Dong H and Bullock TN. Metabolic influences that regulate dendritic cell function in tumors. Front Immunol. 2014; 5:24.
57. Zaccagnino P, Saltarella M, Maiorano S, Gaballo A, Santoro G, Nico B, Lorusso M and Del Prete A. An active mitochondrial biogenesis occurs during dendritic cell differentiation. The international journal of biochemistry & cell biology. 2012; 44(11):1962-1969.
58. Ohkouchi S, Block GJ, Katsha AM, Kanehira M, Ebina M, Kikuchi T, Saijo Y, Nukiwa T and Prockop DJ. Mesenchymal stromal cells protect cancer cells from ROS-induced apoptosis and enhance the Warburg effect by secreting STC1. Mol Ther. 2012; 20(2):417-423.
59. Galvan-Pena S and O’Neill LA. Metabolic reprograming in macrophage polarization. Front Immunol. 2014; 5:420.
60. Liu C, Wu J, Zhu J, Kuei C, Yu J, Shelton J, Sutton SW, Li X, Yun SJ, Mirzadegan T, Mazur C, Kamme F and Lovenberg TW. Lactate inhibits lipolysis in fat cells through activation of an orphan G-protein-coupled receptor, GPR81. J Biol Chem. 2009; 284(5):2811-2822.
61. Sakurai T, Davenport R, Stafford S, Grosse J, Ogawa K, Cameron J, Parton L, Sykes A, Mack S, Bousba S, Parmar A, Harrison D, Dickson L, Leveridge M, Matsui J and Barnes M. Identification of a novel GPR81-selective agonist that suppresses lipolysis in mice without cutaneous flushing. European journal of pharmacology. 2014; 727:1-7.
62. Benyo Z, Gille A, Bennett CL, Clausen BE and Offermanns S. Nicotinic acid-induced flushing is mediated by activation of epidermal langerhans cells. Molecular pharmacology. 2006; 70(6):1844-1849.
63. Hoque R, Farooq A, Ghani A, Gorelick F and Mehal WZ. Lactate reduces liver and pancreatic injury in Toll-like receptor- and inflammasome-mediated inflammation via GPR81-mediated suppression of innate immunity. Gastroenterology. 2014; 146(7):1763-1774.
64. Doherty JR and Cleveland JL. Targeting lactate metabolism for cancer therapeutics. J Clin Invest. 2013; 123(9):3685-3692.
65. Selleri S, Dieng MM, Nicoletti S, Louis I, Beausejour C, Le Deist F and Haddad E. Cord-Blood-Derived Mesenchymal Stromal Cells Downmodulate CD4(+) T-Cell Activation by Inducing IL-10-Producing Th1 Cells. Stem Cells Dev. 2013; 22(7):1063-1075.
66. Ling W, Zhang J, Yuan Z, Ren G, Zhang L, Chen X, Rabson AB, Roberts AI, Wang Y and Shi Y. Mesenchymal stem cells use IDO to regulate immunity in tumor microenvironment. Cancer Res. 2014; 74(5):1576-1587.
67. Smyth GK. Linear models and empirical bayes methods for assessing differential expression in microarray experiments. Statistical applications in genetics and molecular biology. 2004; 3:Article3.
68. Benjamini Y and Hochberg Y. Controlling the False Discovery Rate: A Practical and Powerful Approach to Multiple Testing. Journal of the Royal Statistical Society Series B (Methodological). 1995; 57(1):289-300.
69. Benito M, Parker J, Du Q, Wu J, Xiang D, Perou CM and Marron JS. Adjustment of systematic microarray data biases. Bioinformatics. 2004; 20(1):105-114.
70. Sturn A, Quackenbush J and Trajanoski Z. Genesis: cluster analysis of microarray data. Bioinformatics. 2002; 18(1):207-208.
71. Beyer M, Mallmann MR, Xue J, Staratschek-Jox A, Vorholt D, Krebs W, Sommer D, Sander J, Mertens C, Nino-Castro A, Schmidt SV and Schultze JL. High-resolution transcriptome of human macrophages. PLoS One. 2012; 7(9):e45466.
72. Becker L, Liu NC, Averill MM, Yuan W, Pamir N, Peng Y, Irwin AD, Fu X, Bornfeldt KE and Heinecke JW. Unique proteomic signatures distinguish macrophages and dendritic cells. PLoS One. 2012; 7(3):e33297.
73. Murray PJ, Allen JE, Biswas SK, Fisher EA, Gilroy DW, Goerdt S, Gordon S, Hamilton JA, Ivashkiv LB, Lawrence T, Locati M, Mantovani A, Martinez FO, et al. Macrophage activation and polarization: nomenclature and experimental guidelines. Immunity. 2014; 41(1):14-20.
74. Roszer T. Understanding the Mysterious M2 Macrophage through Activation Markers and Effector Mechanisms. Mediators Inflamm. 2015; 2015:816460.
75. Martinez FO and Gordon S. The M1 and M2 paradigm of macrophage activation: time for reassessment. F1000Prime Rep. 2014; 6:13.
76. Ohradanova-Repic A, Machacek C, Fischer MB and Stockinger H. Differentiation of human monocytes and derived subsets of macrophages and dendritic cells by the HLDA10 monoclonal antibody panel. Clin Transl Immunology. 2016; 5(1):e55.