
INTRODUCTION
The standard treatment for locally advanced rectal cancer is neoadjuvant chemoradiotherapy (NCRT) followed by radical surgery (total mesorectal excision, TME) 4-8 weeks later [1]. Several studies have demonstrated superior local control with this strategy, which even leads to a clinical complete response (cCR), defined as the absence of detectable residual tumor cells, in a substantial proportion of patients treated by NCRT. Nevertheless, a wait-and-see policy might be more beneficial for rectal cancer patients with no residual tumor or involved lymph nodes after NCRT [2, 3]. The first study of the wait-and-see policy, which entails observational management of rectal cancer patients with a cCR after NCRT, was reported by Habr-Gama et al. [4]. A series of retrospective studies from the same group [3] showed that patients with a cCR who were managed with an observational approach had survival rates similar to patients with a pathologic clinical response (pCR) who underwent radical surgery. Although this was a small study, the wait-and-see policy attracted much interest among clinicians, and additional studies [2, 5-11] have confirmed the efficacy of an observational approach using MRI and endoscopy with biopsy to evaluate clinical responses.
Patients treated using the wait-and-see policy who achieve a complete tumor response avoid the risk of surgical morbidity and mortality. However, guidelines regarding the use of cCRs to predict pCR and develop a clinical, pathologic, and imaging follow-up schedule are lacking. For this reason, despite having cCR, patients who did not undergo an operation face a high risk of local recurrence (LR), even though a substantial proportion of patients suffering LR can be treated through salvage treatments. Additionally, the long-term efficacy of this wait-and-see approach is unidentified clearly, which limits its use.
Here, we conducted a systematic review and meta-analysis of the medical literature related to nonoperation management of rectal cancer after NCRT to determine oncologic outcomes of the wait-and-see strategy.
RESULTS
Our initial search identified 2, 470 citations (Figure 1). 2, 163 citations with titles that did not satisfy eligibility criteria were excluded. After reading the abstracts of the remaining articles, 26 full-text trials were read (Table 1). Information was also used from one presentation abstract for which full text was not available [29]. Several papers by Habr-Gama and colleagues describing studies of Brazilian patients were examined [4, 14, 15, 18, 20, 22, 23, 26], but only one of them that included all data of interest was recruited for this meta-analysis [4]. Finally, nine comparative studies of 26 trials which focused on oncologic outcome in patients with cCR in a wait-and-see group compared to those with pCR in a radical surgery group were identified [2, 4-9, 11, 13] (Table 2). Tables 2 and 3 show the main characteristics of these nine comparative studies. Figure 2 shows the risk of bias.
Table 1: Clinical characteristics and oncologic outcome of all recent studies focused on wait-and-see policy
Study (year) |
No. of OB (inclusion interval) |
Age (range) |
Gender (M/F) |
Distance from AV(cm) |
cT stage |
cN stage |
Dose of Radiation (No. of Patients) |
Chemo |
Time of Assessment (weeks) |
Follow-up (months, range) |
LR |
Salvage Treatment |
1-Year Survival(%) |
2-Year Survival(%) |
3-Year Survival(%) |
4-Year Survival(%) |
5-Year Survival(%) |
|||||||
No. |
% |
Time (months) |
DFS |
OS |
DFS |
OS |
DFS |
OS |
DFS |
OS |
DFS |
OS |
||||||||||||
Rupinski et al [12] (2015) |
11 (2012-2015) |
NS |
NS |
NS |
NS |
NS |
50Gy(7); 25Gy(4); 25Gy + 4Gy boost(1) |
5-FU+LV |
8-12 |
median 7 (NS) |
NS |
NS |
NS |
NS |
NS |
NS |
NS |
NS |
NS |
NS |
NS |
NS |
NS |
NS |
Araujo et al [9](2015) |
42 (2002-2013) |
median 63.6 (NS) |
17/25 |
NS |
NS |
NS |
45.0-50.4Gy |
5-FU+LV; capecitabine |
6-8 |
median 47.7 (NS) |
8 |
19 |
median 24.5 (8-32) |
3 APR (1 R1); 1 LAR; 1 refused |
40(95.2) |
NS |
36(85.7) |
NS |
31(73.8) |
NS |
30(71.4) |
NS |
60.9 |
NS |
Li et al [2](2015) |
30 (2006-2013) |
median 62 (55-82) |
18/12 |
mean 3.5 (0-7) |
T1-4 |
N0/N+ |
50Gy ; 25Gy |
capecitabine |
8-10 |
mean 58 (19-108) |
2 |
6.7 |
median 22 (18-26) |
1 TME; 1 LE |
30(100.0) |
30(100.0) |
29(96.7) |
30(100.0) |
28(93.3) |
30(100.0) |
28(93.3) |
30(100.0) |
27(90.0) |
30(100.0) |
Lee et al [13](2015) |
8 (2006-2011) |
? 70 (50-82) |
7/1 |
? 4(2-4) |
T2-4 |
N0/N+ |
50.4Gy |
5-FU-based |
6-10 |
NS |
2 |
25 |
NS |
1 palliative Chemo; 1 APR |
6(75.0) |
NS |
6(75.0) |
NS |
6(75.0) |
NS |
NS |
NS |
NS |
NS |
Appelt et al [10](2015) |
40 (2009-2013) |
NS |
NS |
NS |
T2-3 |
N0/N+ |
60Gy to rectal wall + 50Gy to nodes |
tegafur-uracil(UFT) |
6 |
median 23.9 ( 15.3-31.0) |
9 |
22.5 |
median 10.4 (8.0-13.6) |
9 RS |
34(85.0) |
40(100.0) |
31(77.5) |
40(100.0) |
— |
— |
— |
— |
— |
— |
Smith RK et al [8](2015) |
18 (2001-2013) |
mean 62.3 (NS) |
15/3 |
mean 4.1 |
T1-3 |
N0/N+ |
NS |
5-FU; capecitabine |
7-24 |
mean 68.4 (NS) |
1 |
5.6 |
9.4 |
1 radiation |
17(94.4) |
18(100.0) |
17(94.4) |
18(100.0) |
16(88.9) |
18(100.0) |
16(88.9) |
18(100.0) |
16(88.9) |
18(100.0) |
Habr-Gama et al [14](2014) |
90 (1991-2011) |
mean 58.9±57.5 (NS) |
60/30 |
mean 3.3±2.0 |
T2-4 |
N0/N+ |
50.4-54Gy; 45Gy + 9Gy boost |
5-FU+LV |
8 |
median 60 (12-233) |
28 |
31 |
median 9.5 (3-64) |
25 RS; 1 BT; 1 (LR and DM) Chemo; 1 no therapy |
73(81.1) |
NS |
67(74.4) |
NS |
67(74.4) |
NS |
64(71.1) |
NS |
63(70.0) |
NS |
Habr-Gama et al [15](2013) |
47 (2006-2010) |
mean 60.2±12.7 (NS) |
27/20 |
mean 3.7±1.7 |
T2-4 |
N0/N+ |
45Gy + 9Gy boost |
5-FU+LV |
10 |
median 56 (NS) |
12 |
25.5 |
median 45 (16-144) |
early LR: 3 RS; 3 FTLE; 1 BT + APR; 1 Chemo. late LR: 2 RS; 2 FTLE |
35(74.5) |
NS |
NS |
NS |
NS |
NS |
NS |
NS |
NS |
NS |
Seshadri et al [11](2013) |
23 (1991-2008) |
median 50 (25-71) |
14/9 |
median 3 (0-6) |
T2-3 |
NS |
NS |
Ns |
4-6 |
median 72 (12-180) |
7 |
30.4 |
median 12 (5-30) |
3APR; 2 refused; 1 CAA; 1 LAR; |
17(73.9) |
23(100.0) |
16(69.6) |
21(91.3) |
15(65.2) |
23(100.0) |
14(60.9) |
17(73.9) |
14(60.9) |
17(73.9) |
Smith JD et al [7](2012) |
32 (2006-2010) |
median 70 (NS) |
18/14 |
? 6 (0.5-12) |
T2-3 |
N0/N+ |
median 50.4Gy (45.0-56.0) |
5-FU; capecitabine |
4-10 |
median 28 (9-70) |
6 |
18.8 |
median 11.5 (7-14) |
2 APR; 3 LAR;1 TAE then APR (R1) |
28(87.5) |
32(100.0) |
28(87.5) |
31(96.9) |
— |
— |
— |
— |
— |
— |
Perez et al [16](2012) |
16 (2005-2009) |
NS |
Ns |
Ns |
Ns |
Ns |
45 Gy + 9Gy boost |
5-FU+LV |
12 |
mean 42.6±15.6 (NS) |
1 |
6.3 |
11 |
1 TSLE |
15(93.8) |
16(100.0) |
14(87.5) |
15(93.8) |
14(87.5) |
15(93.8) |
— |
— |
— |
— |
Dalton et al [6](2012) |
6 (2004-2009) |
median 64 (54-71) |
5/1 |
mean 5.06±3.27 |
T2-4 |
N0/N+ |
45Gy |
capecitabine |
6-8 |
mean 25.5 (12-45) |
0 |
0 |
No LR |
— |
6(100.0) |
6(100.0) |
6(100.0) |
6(100.0) |
— |
— |
— |
— |
— |
— |
Maas et al [5](2011) |
21 (2004-2010) |
median 65 (49-79) |
14/7 |
mean 2.9 (0-10) |
T1-4 |
N0/N+ |
50.4Gy |
capecitabine |
6-8 |
median 15 (5-67) |
1 |
4.8 |
22 |
1 TEM |
21(100.0) |
21(100.0) |
19(90.5) |
21(100.0) |
— |
— |
— |
— |
— |
— |
Lambregts et al [17](2011) |
19 (NS) |
NS |
NS |
NS |
T1-4 |
N0/N+ |
50.4Gy |
capecitabine |
6-8 |
median 22 (12-60) |
1 |
5.3 |
22 |
1 TEM |
19(100.0) |
19(100.0) |
18(94.7) |
NS |
NS |
NS |
NS |
NS |
NS |
NS |
Habr-Gama et al [18](2011) |
67 (1991-2009) |
NS |
NS |
NS |
T2-4 |
N0/N+ |
50.4-54Gy; 45Gy + 9Gy boost |
5-FU-based |
8 |
mean 65 (NS) |
8 |
11.9 |
median 39 (NS) |
3 TSLE; 1 BT; 4 RS |
NS |
NS |
NS |
NS |
NS |
NS |
NS |
NS |
48(72.0) |
64(96.0) |
Hughes et al [19](2010) |
10 (1993-2005) |
median 78.5(NS) |
NS |
NS |
T3-4 |
NS |
45Gy |
5-FU+LV; 5-FU; capecitabine; irinotecan; oxaliplatin |
6-8 |
NS |
6 |
60.0 |
NS |
NS |
NS |
NS |
NS |
NS |
NS |
NS |
NS |
NS |
NS |
NS |
Habr-Gama et al [20](2009) |
22 (2005-2008) |
mean 57.6±11.8(NS) |
14/5 |
mean 4.22±1.25 |
T2-3 |
N0/N+ |
45.0Gy + 9Gy boost |
5-FU+LV |
10 |
mean 23.2±10.7 (NS) |
22 |
13.6 |
NS |
3 RS |
19(86.4) |
22(100.0) |
NS |
NS |
NS |
NS |
NS |
NS |
NS |
NS |
Lim et al [21](2007) |
27 (1998-2005) |
median 76(49-94) |
35/13 |
NS |
NS |
NS |
52Gy (25-61.4Gy) |
5-FU+LV; 5-FU |
4-6 |
49 (NS) |
9 |
39.0 |
NS |
NS |
NS |
NS |
NS |
NS |
NS |
NS |
NS |
NS |
NS |
NS |
Habr-Gama et al [22](2006) |
99 (1991-2005) |
mean 60.8±14.1 (NS) |
47/52 |
mean 3.9±1.7 |
T2-4 |
N0/N+ |
50.4Gy |
5-FU+LV |
8 |
mean 59.7±45.7 (NS) |
6 |
6.1 |
median 49.5 (18-79) |
2 APR; 1 LAR; 1 LE; 1 BT; 1 APR then Chemo (LR and DM) |
98(99.0) |
99(100.0) |
91(91.9) |
94(94.9) |
91(91.9) |
94(94.9) |
89(89.9) |
94(94.9) |
87(87.9) |
93(93.9) |
Habr-Gama et al [23](2006) |
99 (1991-2005) |
NS |
NS |
NS |
NS |
NS |
50.4Gy |
5-FU+LV |
8 |
NS |
6 |
6.1 |
mean 96 (NS) |
5 salvage surgery (NS); 1 unclear (LR and DM) |
NS |
NS |
NS |
NS |
NS |
NS |
NS |
NS |
NS |
NS |
Wang et al [24](2005) |
80 (1978-1997) |
NS |
NS |
NS |
NS |
NS |
mostly 52Gy (40-60Gy) |
NO |
median 4 months (1-11, from RT start) |
NS |
62 |
77.5 |
median 18 (3-108) |
Ns |
34.0% (LR) |
NS |
59.0% (LR) |
NS |
NS |
NS |
NS |
NS |
79.0% (LR ) |
NS |
Habr-Gama et al [4](2004) |
71 (1991-2008) |
mean 58.1 (35-92) |
36/35 |
mean 3.6 (0-7) |
T2-4 |
N0/N+ |
50.4Gy |
5-FU+LV |
8 |
mean 57.3 (12-156) |
2 |
2.8 |
median 60 (56-64) |
1 TEM; 1 BT |
71(100.0) |
71(100.0) |
70(98.6) |
71(100.0) |
70(98.6) |
71(100.0) |
69(97.2) |
71(100.0) |
68(95.8) |
71(100.0) |
Nakagawa et al [25](2002) |
10 (1993-1997) |
median 50.5 (23-70) |
NS |
NS |
NS |
NS |
45Gy (1); 50.4Gy (9) |
5-FU+LV |
3-4 |
NS |
8 |
80.0 |
meidan 6 (3.7-8.8) |
6 RS; 1 no surgery (LR and DM); 1 refused |
2(20.0) |
NS |
NS |
NS |
NS |
NS |
NS |
NS |
NS |
NS |
Habr-Gama et al [26](1998) |
30 (1991-1996) |
NS |
NS |
NS |
NS |
NS |
50.4Gy |
5-FU+LV |
6-8 |
NS |
NS |
NS |
NS |
NS |
NS |
NS |
NS |
NS |
NS |
NS |
NS |
NS |
NS |
NS |
Rossi et al [27](1998) |
6 (1993-1996) |
NS |
NS |
NS |
NS |
NS |
50.4Gy + boost (20-30Gy, 5) ; 45Gy(1) |
5-FU + LV + levamisole |
4 |
median 23 (8-40) |
5 |
83.3 |
median 8 (1-8) |
4 APR; 1 vaginal resection |
1(16.7) |
6(100.0) |
1(16.7) |
5(83.3) |
— |
— |
— |
— |
— |
— |
Gerard et al [28](1996) |
28 (1986-1992) |
NS |
NS |
NS |
NS |
NS |
median 70Gy |
NO |
NS |
median 46 (9-95) (from radiation) |
7 |
25.0 |
median 18 (7-48) |
1 APR; 2 laser; 4 unclear (LR and DM) |
NS |
28(100.0) |
23(82.1) |
27(96.4) |
NS |
NS |
NS |
NS |
NS |
NS |
Abbreviation: ? =authors described unclearly. AV= anal verge. N+= positive clinical nodes status. NS=not stated. LR=local recurrence. DM=distant metastasis. DFS=disease free survival. OS=overall survival. APR= abdominoperineal resection. LAR=low anterior resection. CAA=colo-anal anastomosis. BT= brachytherapy. Chemo=chemotherapy. LE=local excision. TSLE=transanal local excision. TEM=transanal endoscopy microsurgery.
Table 2: Characteristics of included comparative studies
Studies (year) |
No.of Patients |
Age |
Gender(M/F) |
Clinical stage of Population |
Distance From AV(range) |
Type of NT |
Time(weeks) |
Type of Study |
||||||
OB |
Surgery |
OB |
Surgery |
OB |
Surgery |
OB |
Surgery |
OB |
Surgery |
Assessment of cCR |
to Sugery |
|||
Araujo et al [9](2015) |
42 |
69 |
median 63.6 (NS) |
median 60.1 (NS) |
17/25 |
34/35 |
NS |
NS |
≤5cm(35); ≥5cm(7) |
≤5cm(41); ≥5cm(28) |
5-FU or CAPE+RT |
6-8 |
6-8 |
prospective cohort study,single center |
Li et al [2](2015) |
30 |
92 |
median 62 (55-82) |
median 56 (34-73) |
18/12 |
60/32 |
TNM1-3 |
TNM1-3 |
mean 3.5 (0-7) |
mean 3.8 (0-7) |
CAPE+RT |
8-10 |
8-10 |
prospective cohort study,multi-center |
Lee et al [13](2015) |
8 |
28 |
? 70(50-82) |
? 64 (46-80) |
7/1 |
21/7 |
NS |
NS |
? 4(2-4) |
median 4 (0-8) |
5-FU+RT |
6-10 |
6-10 |
prospective cohort study,single center |
Smith RK [8]et al (2015) |
18 |
30 |
mean 62.3 (NS) |
mean 60.4 (NS) |
15/3 |
20/10 |
TNM1-4 |
TNM1-3 |
mean 4.1 (Ns) |
mean 6.0 (Ns) |
5-FU or CAPE+RT |
7-24 |
7-24 |
retrospective cohort study,single center |
Seshadri et al [11](2013) |
23 |
10 |
mean 50(25-71) |
mean 55 (30-69) |
14/9 |
6/4 |
NS |
NS |
median 3 (0-6) |
median 4 (0-7) |
5-FU+RT |
4-6 |
median 14 (5-44) |
retrospective cohort study,single center |
Smith JD et al [7](2012) |
32 |
57 |
median 70 (NS) |
median 60 (NS) |
18/14 |
27/30 |
TNM1-3 |
TNM1-3 |
6 (0.5-12)? |
? 7 (2-12) |
5-FU+RT |
4-10 |
median 6.9 (5-17) |
prospective cohort study,single center |
Dalton et al [6](2012) |
6 |
6 |
median 64(54-71) |
NS |
5/1 |
Ns |
NS |
NS |
mean 5.06±3.27 |
NS |
NS |
6-8 |
6-8 |
prospective cohort study,single center |
Maas et al [5](2011) |
21 |
20 |
median 65(49-79) |
median 66 (37-81) |
14/7 |
16/4 |
NS |
NS |
mean 2.9 (0-10) |
mean 3.4 (0-9) |
CAPE+RT |
6-8 |
6-8 |
prospective cohort study,single center |
Habr-Gama et al [4](2004) |
71 |
22 |
mean 58.1(35-92) |
mean 53.6 (25-73) |
36/35 |
12/10 |
NS |
NS |
mean 3.6 (0-7) |
mean 3.8 (2-7) |
5-FU+RT |
8 |
8 |
prospective cohort study,single center |
Abbreviations: OB=observation. ? =authors described unclearly. AV= anal verge. NS= not stated. CAPE=capecitabine.
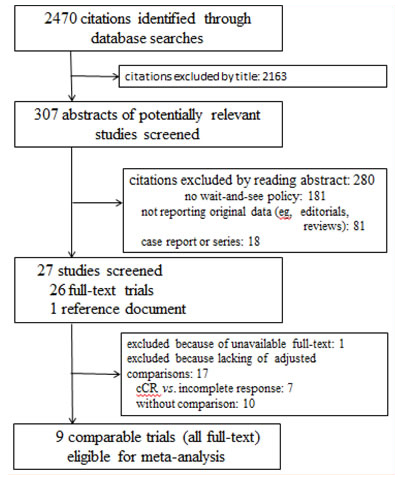
Figure 1: Study selection process for systematic review and meta-analysis
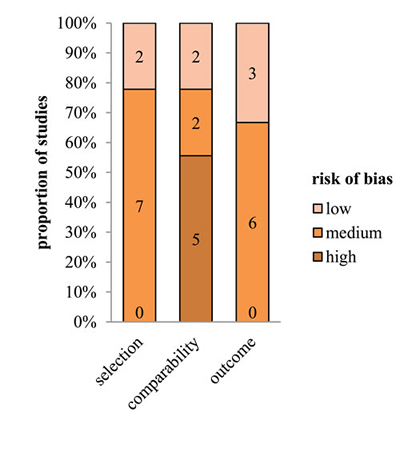
Figure 2: Quality assessment using the Newcastle-Ottawa Scale for risk of bias of studies included in the meta-analysis. The absolute numbers of studies are shown in boxes. Low risk of bias is indicated by four stars for selection, two stars for comparability, and three stars for outcome. Medium risk of bias is indicated by two or three stars for selection, one for comparability, and two for outcome. High risk of bias is indicated by one star for selection or outcome, or zero for any of the three components. Studies were eligible for meta-analysis if LR and distant metastasis data were included. In selection of patients, no articles were high risk, 7 were medium risk, and 2 were low risk. The risk of bias in outcome was similar to that for patient selection (0, 6, and 3, respectively). For comparability, there were 5 high risk, 2 medium risk, and 2 low risk articles. The funnel pots used to assess publication bias indicated no obvious bias.
Of the 585 patients included in the nine comparative articles, 42.9% (251/585) belonged to the cCR with observation group and 57.1% (334) to the pCR with radical surgery group. The male/female ratio was 144/107 and 196/132 in the two groups, respectively. Observation group patients seemed to be older than those in the radical surgery group [2, 4, 7-9, 13]. Except for one observation group patient with liver metastasis in Smith et al. [8], no patients had distant metastasis (DM) according to the study descriptions. Most patients had medial/distal and locally advanced rectal cancer. Patients received doses of radiation ranging from 45 to 54Gy. Chemotherapy regimens were based on 5-FU with/without capecitabine and LV, or capecitabine alone. The interval between NCRT completion and assessment/surgery was usually 6-8 weeks.
Table 3: Clinical stage before neoadjuvant therapy and LR, DM, and total failure rates in included studies
Studies (year) |
NO.of Patients |
OB Group |
Surgery Group |
Interval of Follow-Up (range) |
No.of LR (%) |
No.of DM (%) |
No.of All Failure (%) |
|||||||||||||||
OB |
Surgery |
cT1 |
cT2 |
cT3 |
cT4 |
cN0 |
cN+ |
cT1 |
cT2 |
cT3 |
cT4 |
cN0 |
cN+ |
OB |
Surgery |
OB |
Surgery |
OB |
Surgery |
OB |
Surgery |
|
Araujo et al [9](2015) |
42 |
69 |
NS |
NS |
NS |
NS |
NS |
NS |
NS |
NS |
NS |
NS |
NS |
NS |
median 47.7 (NS) |
median 46.7 (NS) |
8(19.0) |
1(1.4) |
7(16.6) |
7(10.1) |
12(28.5) |
8(11.5) |
Li et al [2](2015) |
30 |
92 |
3 |
5 |
15 |
7 |
14 |
16 |
10 |
14 |
48 |
20 |
39 |
53 |
mean 58 (19-108) |
mean 58 (18-108) |
2(6.7) |
2(2.2) |
1(3.3) |
6(6.5) |
3(10.0) |
8(8.7) |
Lee et al [13](2015) |
8 |
28 |
0 |
5 |
2 |
1 |
5 |
3 |
0 |
6 |
21 |
1 |
13 |
15 |
median 41 (6-80) |
median 41 (6-80) |
2(25.0) |
1(3.6) |
0 |
3(10.7) |
2(25.0) |
4(14.3) |
Smith RK et al [8](2015) |
18 |
30 |
1 |
1 |
16 |
0 |
11 |
7 |
0 |
4 |
25 |
1 |
18 |
12 |
mean 68.4 (NS) |
mean 46.3 (NS) |
1(5.6) |
0 |
1(5.6) |
1(3.3) |
2(11.1) |
1(3.3) |
Seshadri et al [11](2013) |
23 |
10 |
0 |
9 |
14 |
0 |
NS |
NS |
0 |
4 |
6 |
0 |
NS |
NS |
median 72 (12-180) |
median 37 (12-180) |
7(30.4) |
0 |
3(13.0) |
2(20.0) |
10(43.5) |
2(20.0) |
Smith JD et al [7](2012) |
32 |
57 |
0 |
10 |
22 |
0 |
14 |
18 |
0 |
11 |
39 |
0 |
20 |
31 |
median 28 (9-70) |
median 42 (1-70) |
6(18.8) |
0 |
3(9.4) |
3(5.3) |
6(18.8) |
3(5.3) |
Dalton et al [6](2012) |
6 |
6 |
0 |
1 |
4 |
1 |
1 |
5 |
NS |
NS |
NS |
NS |
NS |
NS |
mean 25.5 (12-45) |
mean 39.3 (15-57) |
0 |
0 |
0 |
0 |
0 |
0 |
Maas et al [5](2011) |
21 |
20 |
1 |
5 |
13 |
2 |
6 |
15 |
0 |
1 |
17 |
2 |
3 |
17 |
median 15 (5-67) |
median 35 (1-77) |
1(4.8) |
0 |
0 |
1(5.0) |
1(4.8) |
1(5.0) |
Habr-Gama et al [4](2004) |
71 |
22 |
0 |
14 |
49 |
8 |
55 |
16 |
0 |
1 |
19 |
2 |
16 |
6 |
mean 57.3 (12-156) |
mean 48 (12-83) |
2(2.8) |
0 |
3(4.2) |
3(13.6) |
5(7.0) |
3(13.6) |
Abbreviations: DRE, digital rectal examination; CEA, carcinoembryonic antigen; CT, computed tomography; MRI, magnetic resonance; TU, transrectal ultrasound; PET/CT, positron-emission tomography/computed tomography.
Notes: The chest X-ray and chest CT is alternative. Biopsy is recommended if possible when endoscopy is performed in most of the studies. Li et al. and Habr-Gama et al. emphasize the importance of DRE in particular when confirming cCR.
16.3% (41/251) of observation group patients suffered a treatment failure (LR and/or DM); 11.5% (29) of these had LR and 7.2% (18) had DM. 79.3% (23/29) patients received salvage treatments. These 29 patients with LR were treated as follows: 34.5% (14/29) with LR were treated with radical surgery (R0) including abdominoperineal resection (APR), LAR, or CAA; 2 (4.9%) received APR (R1) and then chemotherapy; 3 (7.3%) received LE or TEM; 2 (4.9%) received radiotherapy; 2 (4.9%) received palliative chemotherapy; and 3 (7.3%) for whom radical surgery was indicated refused it. Additionally, 3 of these patients were not able to undergo surgery because they had LR with concurrent DM. In the radical surgery group, 8.4% (29/344) experienced failure; 1.2% (4) had LR and 7.6% (26) had DM (Table 1). To calculate the LR and DM rates for each year of patient data, we summarized the data from patients with LR, DM, DFS, and OS according to specific time points (Tables 4 and 5).
Table 4: Local recurrence and distant metastasis after 1, 2, 3, and 5 years in observation and radical surgery groups
Studies (year) |
No.of Patients |
1-Year |
2-Year |
3-Year |
4-Year |
5-Year |
||||||||||||||||
OB |
Surgery |
LR (%) |
DM (%) |
LR (%) |
DM (%) |
LR (%) |
DM (%) |
LR (%) |
DM (%) |
LR (%) |
DM (%) |
|||||||||||
OB |
Surgery |
OB |
Surgery |
OB |
Surgery |
OB |
Surgery |
OB |
Surgery |
OB |
Surgery |
OB |
Surgery |
OB |
Surgery |
OB |
Surgery |
OB |
Surgery |
|||
Araujo et al [9](2015) |
42 |
69 |
1(2.4) |
0 |
2(4.8) |
1(1.4) |
4(9.5) |
1(1.4) |
3(7.0) |
5(7.2) |
8(19.0) |
1(1.4) |
6(14.3) |
5(7.2) |
8(19.0) |
1(1.4) |
7(16.7) |
6 |
8(19.0) |
1(1.4) |
7(16.7) |
7(10.1) |
Li et al [2](2015) |
30 |
92 |
0 |
0 |
0 |
0 |
1(3.3) |
1(1.1) |
0 |
0 |
2(6.7) |
2(2.2) |
0 |
1(1.1) |
2(6.7) |
2(2.2) |
0 |
3(3.3) |
2(6.7) |
2(2.2) |
1(3.3) |
5(5.4) |
Lee et al [13](2015) |
8 |
28 |
2(2.5) |
0 |
0 |
0 |
2(2.5) |
1(3.6) |
0 |
2(7.1) |
2(2.5) |
1(3.6) |
0 |
3(10.7) |
NS |
NS |
NS |
NS |
NS |
NS |
NS |
NS |
Smith RK et al [8] (2015) |
18 |
30 |
1(5.6) |
0 |
0 |
0 |
1(5.6) |
0 |
0 |
1(3.3) |
1(5.6) |
0 |
1(5.6) |
1(3.3) |
1(5.6) |
0 |
1(5.6) |
1(3.3) |
1(5.6) |
0 |
1(5.6) |
1(3.3) |
Seshadri et al [11](2013) |
23 |
10 |
5(21.7) |
0 |
1(4.3) |
NS |
6(26.1) |
0 |
1(4.3) |
NS |
7(30.4) |
0 |
1(4.3) |
NS |
7(30.4) |
0 |
2(8.7) |
NS |
7(30.4) |
0 |
2(8.7) |
NS |
Smith JD et al [7](2012) |
32 |
57 |
4(12.5) |
0 |
1(3.1) |
0 |
6(18.8) |
0 |
2(6.2) |
1(3.1) |
— |
— |
— |
— |
— |
— |
— |
— |
— |
— |
— |
— |
Dalton et al [6](2012) |
6 |
6 |
0 |
0 |
0 |
0 |
0 |
0 |
0 |
0 |
— |
— |
— |
— |
— |
— |
— |
— |
— |
— |
— |
— |
Maas et al [5](2011) |
21 |
20 |
0 |
0 |
0 |
0 |
1(4.8) |
0 |
0 |
0 |
— |
— |
— |
— |
— |
— |
— |
— |
— |
— |
— |
— |
Habr-Gama et al [4](2004) |
71 |
22 |
0 |
0 |
0 |
0 |
0 |
0 |
1(1.4) |
3(13.6) |
0 |
0 |
1(1.4) |
3(13.6) |
0 |
0 |
2(2.8) |
3(13.6) |
1(1.4) |
0 |
2(2.8) |
3(13.6) |
Table 5: Long-term survival in the observation and radical surgery groups of included studies
Studies (year) |
NO.of Patients |
1-Year Survival (%) |
2-Year Survival (%) |
3-Year Survival (%) |
4-Year Survival (%) |
5-Year Survival (%) |
||||||||||||||||
DFS |
OS |
DFS |
OS |
DFS |
OS |
DFS |
OS |
DFS |
OS |
|||||||||||||
OB |
Surgery |
OB |
Surgery |
OB |
Surgery |
OB |
Surgery |
OB |
Surgery |
OB |
Surgery |
OB |
Surgery |
OB |
Surgery |
OB |
Surgery |
OB |
Surgery |
OB |
Surgery |
|
Araujo et al [9](2015) |
42 |
69 |
40(95.2) |
68(98.6) |
NS |
NS |
36(85.7) |
62(89.9) |
NS |
NS |
31(73.8) |
63(91.3) |
NS |
NS |
30(71.4) |
62(89.9) |
NS |
NS |
26(60.9) |
57(82.8) |
30(71.6) |
62(89.9) |
Li et al [2](2015) |
30 |
92 |
30(100.0) |
92(100.0) |
30(100.0) |
92(100.0) |
29(96.7) |
91(98.9) |
30(100.0) |
92(100.0) |
28(93.3) |
89(96.7) |
30(100.0) |
92(100.0) |
28(93.3) |
87(94.6) |
30(100.0) |
90(97.8) |
27(90.0) |
85(92.4) |
30(100.0) |
88(95.7) |
Lee et al [13](2015) |
8 |
28 |
6(75.0) |
28(100.0) |
NS |
NS |
6(75) |
25(89.3) |
NS |
NS |
6(75.0) |
24(85.7) |
NS |
NS |
NS |
NS |
NS |
NS |
NS |
NS |
NS |
NS |
Smith RK [8]et al (2015) |
18 |
30 |
17(94.4) |
0 |
18(100.0) |
30(100.0) |
17(94.4) |
29(96.7) |
18(100.0) |
30(100.0) |
16(88.9) |
29(96.7) |
18(100.0) |
29(96.7) |
16(88.9) |
29(96.7) |
18(100.0) |
29(96.7) |
16(88.9) |
29(96.7) |
18(100.0) |
29(96.7) |
Seshadri et al [11](2013) |
23 |
10 |
17(73.9) |
NS |
23(100.0) |
NS |
16(69.6) |
NS |
21(91.3) |
NS |
15(65.2) |
NS |
20(87.0) |
NS |
14(60.9) |
NS |
17(73.9) |
NS |
14(60.9) |
NS |
17(73.9) |
NS |
Smith JD et al [7](2012) |
32 |
57 |
28(87.5) |
57(100.0) |
32(100.0) |
57(100.0) |
28(87.5) |
56(98.2) |
31(96.9) |
57(100.0) |
— |
— |
— |
— |
— |
— |
— |
— |
— |
— |
— |
— |
Dalton et al [6](2012) |
6 |
6 |
6(100.0) |
6(100.0) |
6(100.0) |
6(100.0) |
6(100.0) |
6(100.0) |
6(100.0) |
6(100.0) |
— |
— |
— |
— |
— |
— |
— |
— |
— |
— |
— |
— |
Maas et al [5](2011) |
21 |
20 |
21(100.0) |
19(98.0) |
21(100.0) |
19(98.0) |
19(90.5) |
19(98.0) |
21(100.0) |
19(98.0) |
— |
— |
— |
— |
— |
— |
— |
— |
— |
— |
— |
— |
Habr-Gama et al [4](2004) |
71 |
22 |
71(100.0) |
22(100.0) |
71(100.0) |
22(100.0) |
70(98.6) |
19(86.4) |
71(100.0) |
20(90.9) |
70(98.6) |
19(86.4) |
71(100.0) |
20(90.9) |
69(97.2) |
19(86.4) |
71(100.0) |
20(90.9) |
68(95.8) |
19(86.4) |
71(100.0) |
20(90.9) |
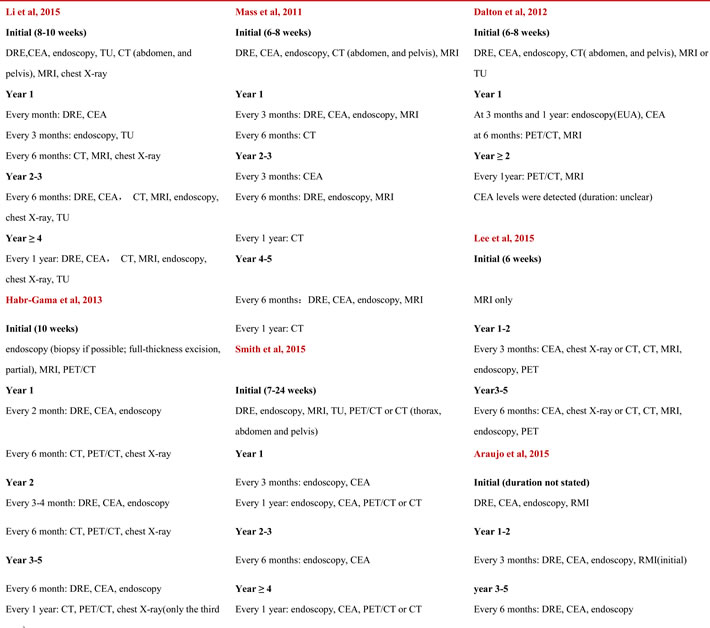
Table 6: Follow-up schedules for confirming initial and sustained cCR in included studies
Using meta-analysis, we found that the observation group had a higher risk of 1, 2, 3, and 5-year LR than the surgery group (RR 8.18, 95% CI 2.22-30.07, P = 0.002; RR 6.96, 95% CI 2.58-56.84, P = 0.0001; RR 6.97, 95% CI 2.44-19.93, P = 0.003; RR 5.69, 95% CI 1.99-16.25, P = 0.001; respectively; Figure 3). However, the two groups had a similar risk of DM, DFS, and OS in each year (Figures 4, 5, and 6). The risk of 1, 2, 3, and 5-year DM was similar in nonoperation and radical surgery groups (RR 3.93, 95% CI 0.60-0.25.95, P = 0.160; RR 0.71, 95% CI 0.31-1.62, P = 0.420; RR 0.93, 95% CI 0.44-1.96, P = 0.12; RR 0.95, 95% CI 0.47-1.91, P = 0.88, respectively). Two articles that did not mention DFS and OS after surgery were excluded from this analysis [11, 13]. Patients in the observation and surgery groups had similar 1, 2, 3, and 5-year DFS (RR 0.95, 95% CI 0.91-0.99, P = 2.23; RR 0.97, 95% CI 0.92-1.03, P = 0.280; RR 0.95, 95% CI 0.85-1.06, P = 0.39; RR 0.96, 95% CI 0.85-1.08, P = 0.850, respectively). 3.6% (19/526) of patients died during the course of follow-up visits, mainly due to rectal tumor disease; 5.5% (12/220) of observation group patients died, while 2.3% (7/306) of surgery group patients died. The observation and surgery groups did not differ in 1, 2, 3, and 5-year OS (RR 1.01, 95% CI 0.98-1.04, P = 0.700; RR 0.1.02, 95% CI 0.98-1.06, P = 0.410; RR 0.95, 95% CI 0.97-1.06, P = 0.560; RR 1.01, 95% CI 0.92-1.10, P = 0.820, respectively).
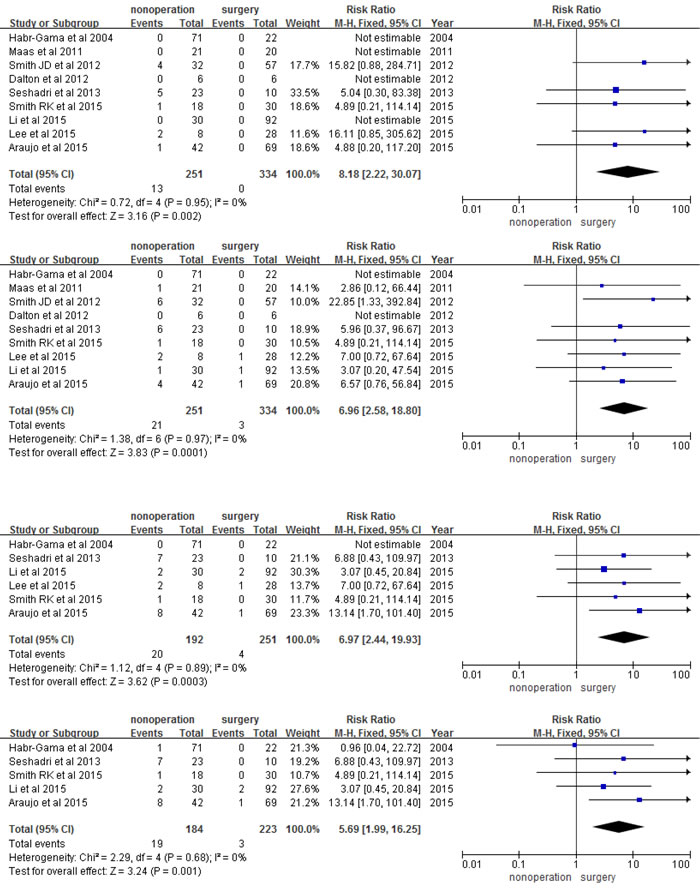
Figure 3: 1, 2, 3, and 5-year local recurrence
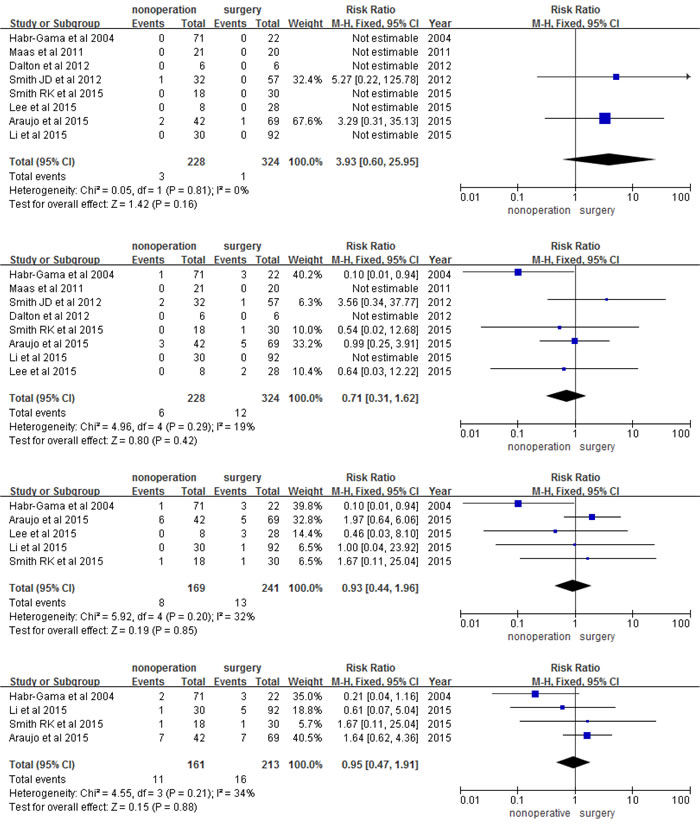
Figure 4: 1, 2, 3, and 5-year distant metastasis
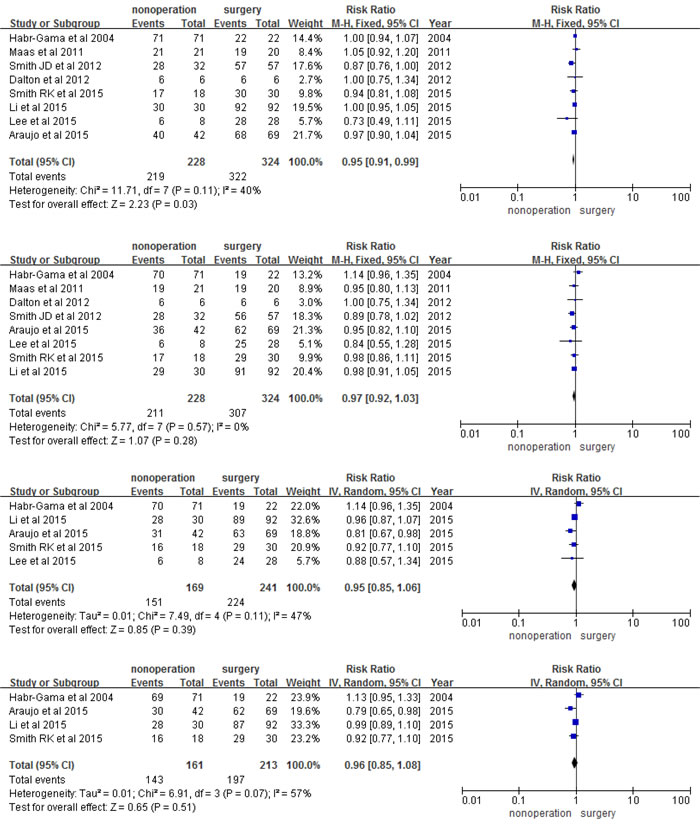
Figure 5: 1, 2, 3, and 5-year disease free survival
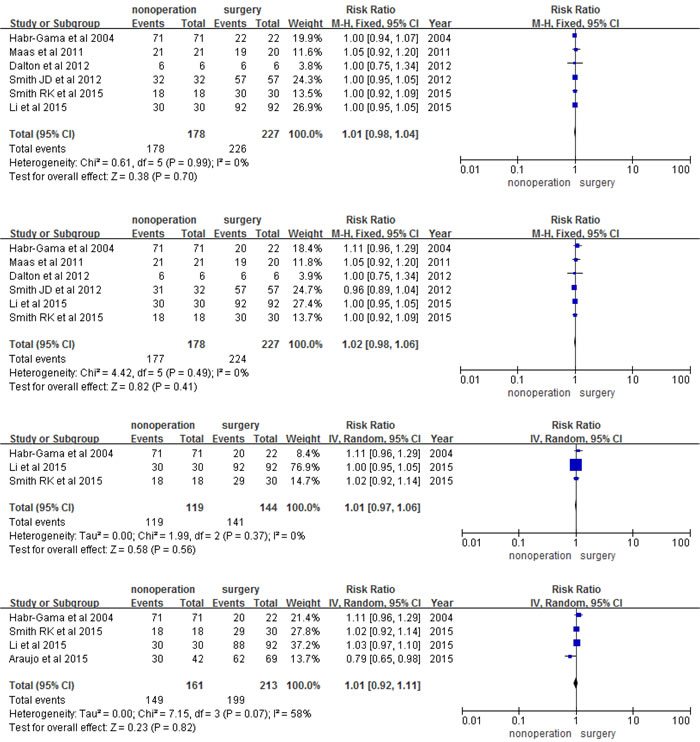
Figure 6: 1, 2, 3, and 5-year overall survival
DISCUSSION
Previous studies indicate that pCR is predictive of good prognosis. In a pooled analysis of 484 patients with pCR, Mass [30] demonstrated that the 5-year DFS rates in patients with or without pCR were 83.3% and 65.6%, respectively (HR 0.44, 95% CI 0.34-0.57; P < 0.0001). For patients with pCR without residual tumor cells in the rectal wall and nodes, it has been debated widely whether radical surgery is necessary. Following NCRT, evidence from digital rectal examinations (DRE), MRIs, and endoscopies with biopsy and transrectal ultrasounds indicates that cCR is attained in about 26.8% of patients [31, 32]. Recently, however, Habr-Gama and colleagues [3] reported that 68.1% (47/69) of patients had cCR in that study.
Achieving cCR may allow patients to avoid radical surgery, which is accompanied by the risk of complications and mortality [33]. Additionally, although NCRT can help distal rectal cancer patients avoid excision of the anal sphincter, a notable proportion of patients required APR and permanent colostomies. However, even patients who undergo LAR to keep the anal sphincter have high rates of incontinence, anal mucus loss, anal blood loss, and daily pad use [34-36]. A modest but significant proportion of patients who have completed NCRT and have sustained cCR may be able to avoid radical surgery and associated complications if a wait-and-see policy is employed, although some of these patients may still require salvage radical surgery because of LR or DM [37]. A wait-and-see policy would also benefit patients with cCR who refuse surgery because of religious reasons, fistulas, or poor physical condition [2]. The wait-and-see policy for rectal cancer patients with a cCR after NCRT is based on careful selection and follow-up using endoscopy and up-to-date imaging, and appears both feasible and safe. The Brazil study [4] was the first to propose that nonoperation management could be used for patients with cCR. The Brazil study series [3, 4, 38, 39] also improved the process for nonoperation management, including patient selection, how and when to identify cCR, follow-up schedule, and salvage treatment. In the present study, we found that there is no difference in long-term survival, as measured by DM, DFS, and OS, in patients with cCR treated with a wait-and-see strategy compared to those with pCR who underwent radical surgery. Nonoperation management is, however, associated with a higher risk of LR. In the result of this meta-analysis the reason for patients treated by observation management had a LR rate but a similar DFS rate is that one study from Seshadri et al [11] with a higher risk of LR were excluded because of lack of the data of DFS. Although it is effective in many cases, the wait-and-see treatment strategy still needs to be improved.
Currently, a limitation of nonoperation management is the possibility of poor correlations between clinical findings and final pathologic findings from resected specimens. For example, cCR does not always correspond to pCR as indicated by DRE, CT, PET/CT, MRI, endoscopy with biopsy, and TU. Patients showing cCR who do not have pCR and who are not treated with radical surgery likely have a high risk of recurrence. Previous studies, including ours, clearly show that cCR does not always indicate pCR, and moreover, following NCRT, up to 7% of patients with pCR may have an incomplete clinical response characterized by residual rectal ulcers [2, 29].
Another obstacle for nonoperation management is that it does not address residual tumor cells that may remain in perirectal nodes, including lymph nodes and tumor deposits. Recently, the downstaging of nodes invaded has been examined by some authors. Perez [40] reported that histologic regression can be observed in nodes after NCRT. Moreover, the primary tumor regression grade (TRG) may predict lymph node response (LRG) [41-44]. Thus, the presence of residual tumor cells in nodes may be predicted by tumor response within the rectum. Indeed, most studies of observation management demonstrate an extremely low rate of recurrence in perirectal nodes [2-10]. However, CTs, MRIs, and transrectal ultrasounds are still crucial in determining node status when confirming cCR.
Until now, there is no standard guideline regarding of patients selection, when and how to perform nonoperation management for those with a cCR after NCRT. Firstly, Clinicians should select patients who may have a higher priority to perform the nonoperation management. Recent studies have established some guidelines for the selection of patients who are candidates for nonoperation management. First, the primary tumor should be located within 7 cm of the anal verge, which would be identifiable via DRE [38]. Second, Habr-Gama et al. [38] reported that only patients with tumor sizes of less than 7 cm should be considered for a wait-and-see policy. They recommended that these patients should be treated with radical surgery.
Secondly, early identification of cCR is also a key for ensuring the feasibility and safety of wait-and-see treatment. Initially, Habr-Gama et al. [26] achieved cCR using DRE, endoscopy, and excision of the residual scar; later, they focused on establishing more standardized requirements for cCR. In 2013, this team [3] proposed that the absence of residual ulceration, mass, or significant rectal wall irregularities as identified by MRI, PET/CT, or TU, in addition to CEA levels before and after NCRT, DRE, and endoscopy with biopsy (any residual scar, ulcer, or even local excision) be used to define cCR. Any ulcers, palpable nodules, or significant stenosis would suggest that cCR was not achieved. Habr-Gama et al. [31] suggested that patients with rectal cancer within 7 cm of the anal verge were suitable for cCR assessment; DRE accuracy in assessing this distance can reach 50% and is helpful for estimating cCR.
Thirdly, the time interval between NCRT and response assessment is critical. Most studies examined here assessed response between 6 and 10 weeks after treatment. Moore et al. [45] found that longer intervals were associated with much higher rates of complete tumor response in rectal cancer patients. A study of 1, 593 rectal patients from a Dutch hospital found that pCR rates were highest after a 10- to 11-week interval, and pCR rates did not increase at longer intervals [46]. A recent cohort study including 122 cases with cCR reported that in the surgery group, 5 of the 11 non-pCR patients had a TRG of 0 and were LN+, while 6 had a TRG of 1 without positive lymph nodes (minor residual tumor cells) [2]. Interestingly, the pCR and non-pCR patients had similar 5-year failure (LR and/or DM) rates (P = 0.350). This result might also be explained by an insufficient time interval (6-8 weeks) between NCRT completion and surgery, as further tumor cell necrosis and death might have occurred if the interval was longer [18]. Habr-Gama and colleagues have also suggested using an interval longer than 6 weeks for the assessment of residual disease in both primary tumors and perirectal nodes [20, 47, 48]. Thus, 8-11 weeks post-NCRT may be the optimal interval for identifying cCR.
Fourthly, the success of the wait-and-see strategy depends on a sustained cCR. Reports from Habr-Gama’s group and others are not consistent regarding the time point for assessment of sustained cCR, which ranged from 12 to 14 months after NCRT completion, or regarding the time point for identifying patients failing to maintain cCR [2, 3, 5, 6, 8, 9, 20]. Only seven studies established a rigorous follow-up system (Table 6), and they suggested that cCR should only be considered sustained after at least 12 months. Although the timing is uncertain, a comprehensive and effective set of tools, including DRE, MRI, endoscopy plus biopsy (any residual scar tissue), PET/CT, TU, and CEA levels, is available for assessing cCR. Additionally, timely identification of failure to maintain cCR might render salvage treatments more effective. Until now, because the use of nonoperation management with short follow-up times has been relatively rare, it has not been clear that salvage treatments are safe and effective for patients with LR or/and DM. Surgical salvage might be the most effective way to cure patients with LR and resectable DM. In the studies by Habr-Gama et al.[14], most patients were treated by surgical salvage, including APR, LAR, and FTLE, but other studies reported that up to 25% could not be treated with salvage surgery [25, 28]. However, these later studies did not perform regular follow-ups, which may have delayed the detection of LR and DM, in turn reducing the viability of salvage surgery treatment. Thus, meticulous follow-up assessments may be crucial to the success of wait-and-see treatment strategies.
Although our present study provides valuable information regarding the efficacy of nonoperation management in rectal cancer after NCRT, future studies should address some of its limitations. For example, meta-analysis of aggregate data does not allow for the examination of some factors that can be explored in meta-analysis of individual patient data, including differences among patient subgroups [49]. Additionally, there is a high risk of comparability bias in the 9 comparative studies we evaluated in the present meta-analysis. Furthermore, all of the studies examined used different wait-and-see treatment strategies. Finally, and perhaps most importantly, all of the studies examined here were nonrandomized and relatively small-scale. Regardless, our findings suggest that wait-and-see strategies should be evaluated in larger studies, which will help clarify the potential benefits of nonoperation management in rectal cancer patients.
MaTERIALS AND METHODS
Search strategy and selection criteria
We searched the electronic PubMed, Medline, and Embase databases for relevant articles and international meeting databases, including ECCO, ESTRO, and ESSO for abstracts published by October 1 2015. We searched for “rectal cancer” and “clinical complete response”, and all relevant keyword variations were used for both terms. Studies were included if: they were published in English; patients with local rectal cancer (cTNM stage: I to III) received radiotherapy with or without concurrent chemotherapy and achieved cCR; patients with cCR were treated with a wait-and-see strategy; data and time to event for LR, DM, DFS, and OS were provided. Studies without our primary end point, with previously irradiated patients, and case reports related to nonoperation management were excluded.
One reviewer (LJL) checked the titles and abstracts of the identified studies to select studies potentially meeting the inclusion criteria related to this topic. Two independent reviewers (SSX and YNY) examined full text copies of initially selected studies to decide which met the inclusion criteria. Two additional reviewers traced studies which were cited by the selected studies. Finally, two corresponding authors (JL and LJL) reviewed the selected studies to confirm their relevance.
Outcomes
The primary endpoint of interest was local LR. Secondary endpoints were DM, DFS, and OS. All time-to-event variables were calculated from the date of NCRT completion. DFS was defined as time to any LR or/and DM. OS was defined as time from NCRT completion to death from any cause, or to end of follow-up (censored) according to included studies. All LR or/and DM events were defined as failures.
Risk of bias assessment
We used the Newcastle-Ottawa Scale to measure the methodologic quality and risk of bias of the nonrandomized studies, including risk of bias in the selection and comparability of cohorts and outcomes [50]. The two independent reviewers (SSX and YNY) conducted the risk of bias assessment.
Statistical analysis
We assessed heterogeneity using Cochran’s Q statistic, and heterogeneity was considered statistically significant when P < 0.10 and the I2 > 50% [51]. We used the fixed-effect model with Mantel-Haenszel method to calculate summarized relative risk (RR) and 95 % CI. When significant heterogeneity existed, we used the random-effects method (Inverse Variance) to calculate summarized RR and 95% CI [52]. We assessed publication bias by funnel plots [53]. For all tests except for heterogeneity, a probability level < 0.05 was considered statistically significant. All calculations and graphs of LR, DM, DFS, and 1, 2, 3, and 5-year OS were completed using Review Manager 5.3 (The Nordic Cochrane Centre, The Cochrane Collaboration, 2014).
ACKNOWLEDGMENTS
We thank the investigators of all trials included in this meta-analysis for their data. Especially, we thank Jiannan Yang from the Medical Records Room, Affiliated Hospital/Clinical Medical College of Chengdu University, for his extensive help with confirming the study design and statistical results.
Author contributions
JL, LJL and LY designed this article. JL, LJL, LY, JTY, and BL analyzed the data. LJL, YNY, and SSX were principal investigators of the trials included in this meta-analysis. All authors participated in the interpretation and writing of this paper. All authors approved the final version before submission.
FUNDING
This study is financially supported by Scientific Research Project of Affiliated Hospital/Clinical Medical College of Chengdu University (grant number 201509).
CONFLICTS OF INTEREST
We declare no competing interests.
REFERENCES
1. Minsky BD. Is ‘watch and wait’ a safe option for rectal cancer? Nat Rev Gastroenterol Hepatol 2013; 10:698-700.
2. Li J, Liu H, Yin J, Liu S, Hu J, Du F, Yuan J, Lv B, Fan J, Leng S, Zhang X. Wait-and-see or radical surgery for rectal cancer patients with a clinical complete response after neoadjuvant chemoradiotherapy: a cohort study. Oncotarget. 2015; 6: 42354-61. doi:10.18632/oncotarget.6093.
3. Habr-Gama A, Vianna MR, São Julião GP, Rawet V, Gama-Rodrigues J, Proscurshim I, Alves J, Fernandez LM, Perez RO. Management of adenomas within the area of rectal cancer that develop complete pathological response. Int J Colorectal Dis. 2015;30:1285-7.
4. Habr-Gama A, Perez RO, Nadalin W, Sabbaga J, Ribeiro U Jr, Silva e Sousa AH Jr, Campos FG, Kiss DR, Gama-Rodrigues J. Operative versus nonoperative treatment for stage 0 distal rectal cancer following chemoradiation therapy: long term results. Ann Surg. 2004; 240: 711-717.
5. Maas M, Beets-Tan RG, Lambregts DM, Lammering G, Nelemans PJ, Engelen SM, van Dam RM, Jansen RL, Sosef M, Leijtens JW, Hulsewé KW, Buijsen J, Beets GL. Wait-and-see policy for clinical complete responders after chemoradiation for rectal cancer. J Clin Oncol. 2011; 29:4633-4640.
6. Dalton RS, Velineni R, Osborne ME, Thomas R, Harries S, Gee AS, Daniels IR. A single-centre experience of chemoradiotherapy for rectal cancer: is there potential for nonoperative management? Colorectal Dis. 2012; 14:567-571.
7. Smith JD, Ruby JA, Goodman KA, Saltz LB, Guillem JG, Weiser MR, Temple LK, Nash GM, Paty PB. Nonoperative management of rectal cancer with complete clinical response after neoadjuvant therapy. Ann Surg. 2012; 256:965-972.
8. Smith RK, Fry RD, Mahmoud NN, Paulson EC. Surveillance after neoadjuvant therapy in advanced rectal cancer with complete clinical response can have comparable outcomes to total mesorectal excision. Int J Colorectal Dis. 2015; 30:769-74.
9. Araujo RO, Valadão M, Borges D, Linhares E, de Jesus JP, Ferreira CG, Victorino AP, Vieira FM, Albagli R. Nonoperative management of rectal cancer after chemoradiation opposed to resection after complete clinical response. A comparative study. Eur J Surg Oncol. 2015; 41:1456-63.
10. Appelt AL, Pløen J, Harling H, Jensen FS, Jensen LH, Jørgensen JC, Lindebjerg J, Rafaelsen SR, Jakobsen A. High-dose chemoradiotherapy and watchful waiting for distal rectal cancer: a prospective observational study. Lancet Oncol. 2015; 16:919-27.
11. Seshadri RA, Kondaveeti SS, Jayanand SB, John A, Rajendranath R, Arumugam V, Ellusamy HR, Sagar TG. Complete clinical response to neoadjuvant chemoradiation in rectal cancers: can surgery be avoided? Hepato-Gastroentero. 2013; 60:410-414.
12. Rupinski M, Szczepkowski M, Malinowska M, Mroz A1, Pietrzak L, Wyrwicz L, Rutkowski A, Bujko K. Watch and wait policy after preoperative radiotherapy for rectal cancer; management of residual lesions that appear clinically benign. Eur J Surg Oncol. 201; 22: 00817-3.
13. Lee SY, Kim CH, Kim YJ, Kim HR. Oncologic outcomes according to the treatment strategy in radiologic complete responders after neoadjuvant chemoradiation for rectal cancer. Oncology. 2015 Oct 2.
14. Habr-Gama A, Gama-Rodrigues J, São Julião GP, Proscurshim I, Sabbagh C, Lynn PB, Perez RO. Local recurrence after complete clinical response and watch and wait in rectal cancer after neoadjuvant chemoradiation: impact of salvage therapy on local disease control. Int J Radiat Oncol Biol Phys. 2014;88:822-8.
15. Habr-Gama A, Sabbaga J, Gama-Rodrigues J, São Julião GP, Proscurshim I, Bailão Aguilar P, Nadalin W, Perez RO. Watch and wait approach following extended neoadjuvant chemoradiation for distal rectal cancer: are we getting closer to anal cancer management? Dis Colon Rectum. 2013; 56:1109-17.
16. Perez RO, Habr-Gama A, Gama-Rodrigues J, Proscurshim I, Julião GP, Lynn P, Ono CR, Campos FG, Silva e Sousa AH Jr, Imperiale AR, Nahas SC, Buchpiguel CA. Accuracy of positron emission tomography/computed tomography and clinical assessment in the detection of complete rectal tumor regression after neoadjuvant chemoradiation: long-term results of a prospective trial (National Clinical Trial 00254683). Cancer. 2012; 118:3501-11.
17. Lambregts DM, Maas M, Bakers FC, Cappendijk VC, Lammering G, Beets GL, Beets-Tan RG. Long-term follow-up features on rectal MRI during a wait-and-see approach after a clinical complete response in patients with rectal cancer treated with chemoradiotherapy. Dis Colon Rectum 2011; 54: 1521-1528.
18. Habr-Gama A, Perez RO, São Julião GP, Proscurshim I, Gama-Rodrigues J. Nonoperative approaches to rectal cancer: a critical evaluation. Semin Radiat Oncol. 2011; 21:234-9.
19. Hughes R, Harrison M, Glynne-Jones R. Could a wait and see policy be justified in T3/4 rectal cancers after chemo-radiotherapy? Acta Oncol. 2010; 49: 378-81.
20. Habr-Gama A, Perez RO, Sabbaga J, Nadalin W, São Julião GP, Gama-Rodrigues J. Increasing the rates of complete response to neoadjuvant chemoradiotherapy for distal rectal cancer: results of a prospective study using additional chemotherapy during the resting period. Dis Colon Rectum. 2009; 52:1927-1934.
21. Lim L, Chao M, Shapiro J, Millar JL, Kipp D, Rezo A, Fong A, Jones IT, McLaughlin S, Gibbs P. Long-term outcomes of patients with localized rectal cancer treated with chemoradiation or radiotherapy alone because of medical inoperability or patient refusal. Dis Colon Rectum. 2007; 50: 2032-9.
22. Habr-Gama A, Perez RO, Proscurshim I, Campos FG, Nadalin W, Kiss D, Gama-Rodrigues J. Patterns of failure and survival for nonoperative treatment of stage c0 distal rectal cancer ollowing neoadjuvant chemoradiation therapy. J Gastrointest Surg. 2006; 10:1319-28.
23. Habr-Gama A. Assessment and management of the complete clinical response of rectal cancer to chemoradiotherapy. Colorectal Dis. 2006; 8(Suppl 3):21-4.
24. Wang Y, Cummings B, Catton P, Dawson L, Kim J, Ringash J, Wong R, Yi QL, Brierley J. Primary radical external beam radiotherapy of rectal adenocarcinoma: Long term outcome of 271 patients. Radiother Oncol. 2005; 77:126-32.
25. Nakagawa WT, Rossi BM, de O Ferreira F, Ferrigno R, David Filho WJ, Nishimoto IN, Vieira RA, Lopes A. Chemoradiation instead of surgery to treat mid and low rectal tumors: is it safe? Ann Surg Oncol. 2002; 9:568-73.
26. Habr-Gama A, de Souza PM, Ribeiro U Jr, Nadalin W, Gansl R, Sousa AH Jr, Campos FG, Gama-Rodrigues J. Low rectal cancer: impact of radiation and chemotherapy on surgical treatment. Dis Colon Rectum. 1998; 41:1087-1096.
27. Rossi BM, Nakagawa WT, Novaes PE, Filho WD, Lopes A. Radiation and chemotherapy instead of surgery for low infiltrative rectal adenocarcinoma: a prospective trial. Ann Surg Oncol. 1998; 5:113-8.
28. Gerard JP, Roy P, Coquard R, Barbet N, Romestaing P, Ayzac L, Ardiet JM, Thalabard JC. Combined curative radiation therapy alone in (T1) T2-3 rectal adenocarcinoma: a pilot study of 29 patients. Radiother Oncol. 1996; 38:131-7.
29. Yu SK, Brown G, Heald RJ. Deferral of rectal surgery following a continued response to preoperative chemoradiotherapy (Watch and Wait) study: a phase II multicenter study in the United Kingdom. J Clin Oncol 2011; 29(Suppl 4): abstract 489.
30. Maas M, Nelemans PJ, Valentini V, Das P, Rödel C, Kuo LJ, Calvo FA, García-Aguilar J, Glynne-Jones R, Haustermans K, Mohiuddin M, Pucciarelli S, Small W Jr, et al. Long-term outcome in patients with a pathological complete response after chemoradiation for rectal cancer: a pooled analysis of individual patient data. Lancet Oncol. 2010; 11: 835-44.
31. Chau I, Brown G, Cunningham D, Tait D, Wotherspoon A, Norman AR, Tebbutt N, Hill M, Ross PJ, Massey A, Oates J. Neoadjuvant capecitabine and oxaliplatin followed by synchronous chemoradiation and total mesorectal excision in magnetic resonance imaging-defined poor-risk rectal cancer. J Clin Oncol. 2006; 24:668-74.
32. Artioukh DY, Smith RA, Gokul K. Risk factors for impaired healing of the perineal wound after abdominoperineal resection of rectum for carcinoma. Colorectal Dis. 2007; 9:362-7.
33. Habr-Gama A, São Julião GP, Perez RO. Nonoperative management of rectal cancer: identifying the ideal patients. Hematol Oncol Clin North Am. 2015; 29:135-51.
34. Chadi SA, Berho M, Wexner SD. Surgeon perspectives on the use and effects of neoadjuvant chemoradiation in the treatment of rectal cancer: a comprehensive review of the literature. Langenbecks Arch Surg. 2015; 400:661-73.
35. Hendren SK, O’Connor BI, Liu M, Asano T, Cohen Z, Swallow CJ, Macrae HM, Gryfe R, McLeod RS. Prevalence of male and female sexual dysfunction is high following surgery for rectal cancer. Ann Surg. 2015; 242:212-223.
36. Marijnen CA, van de Velde CJ, Putter H, van den Brink M, Maas CP, Martijn H, Rutten HJ, Wiggers T, Kranenbarg EK, Leer JW, Stiggelbout AM. Impact of short-term preoperative radiotherapy on health-related quality of life and sexual functioning in primary rectal cancer: report of a multicenter randomized trial. J Clin Oncol. 2005; 23:1847-1858.
37. Glynne-Jones R, Hughes R. Critical appraisal of the ‘wait and see’ approach in rectal cancer for clinical complete responders after chemoradiation. Br J Surg. 2012; 99:897-909.
38. Habr-Gama A, Perez RO, Proscurshim I, Gama-Rodrigues J. Complete clinical response after neoadjuvant chemoradiation for distal rectal cancer. Surg Oncol Clin N Am. 2010; 19: 829-845.
39. Perez RO, Habr-Gama A, São Julião GP, Proscurshim I, Fernandez LM, de Azevedo RU, Vailati BB, Fernandes FA, Gama-Rodrigues J.: Transanal endoscopic microsurgery (TEM) following neoadjuvant chemoradiation for rectal cancer: outcomes of salvage Resection for local recurrence. Ann Surg Oncol. 2016; 23:1143-8.
40. Perez RO, Habr-Gama A, Nishida Arazawa ST, Rawet V, Coelho Siqueira SA, Kiss DR, Gama-Rodrigues JJ. Lymph node micrometastasis in stage II distal rectal cancer following neoadjuvant chemoradiation therapy. Int J Colorectal Dis. 2005; 20: 434-9.
41. Hughes R, Glynne-Jones R, Grainger J, Richman P, Makris A, Harrison M, Ashford R, Harrison RA, Livingstone JI, McDonald PJ, Meyrick Thomas J, Mitchell IC, Northover JM, et al. Can pathological complete response in the primary tumour following preoperative pelvic chemoradiotherapy for T3-T4 rectal cancer predict for sterilisation of pelvic lymph nodes, a low risk of local recurrence and the appropriateness of local excision? Int J Colorectal Dis. 2006; 21:11-7.
42. Read TE, Andujar JE, Caushaj PF, Johnston DR, Dietz DW, Myerson RJ, Fleshman JW, Birnbaum EH, Mutch MG, Kodner IJ. Neoadjuvant therapy for rectal cancer: histologic response of the primary tumor predicts nodal status. Dis Colon Rectum. 2004; 47:825-31.
43. Caricato M, Ausania F, De Dominicis E, Vincenzi B, Rabitti C, Tonini G, Cellini F, Coppola R. Tumor regression in mesorectal lymph nodes after neoadjuvant chemoradiation for rectal cancer. Eur J Surg Oncol. 2007; 33:724-728.
44. Li J, Yuan J, Liu H, Yin J, Liu S, Du F, Hu J, Li C, Niu X, Lv B, Xing S. Lymph nodes regression grade is a predictive marker for rectal cancer after neoadjuvant therapy and radical surgery. Oncotarget. 2016; doi:10.18632/oncotarget.7703.
45. Moore HG, Gittleman AE, Minsky BD, Wong D, Paty PB, Weiser M, Temple L, Saltz L, Shia J, Guillem JG. Rate of pathologic complete response with increased interval between preoperative combined modality therapy and rectal cancer resection. Dis Colon Rectum. 2004; 47: 279-286.
46. Sloothaak DA, Geijsen DE, van Leersum NJ, Punt CJ, Buskens CJ, Bemelman WA, Tanis PJ; Dutch Surgical Colorectal Audit. Dutch Surgical Colorectal Audit. Optimal time interval between neoadjuvant chemoradiotherapy and surgery for rectal cancer. Br J Surg. 2013; 100: 933-9.
47. Habr-Gama A, Perez RO, Wynn G, Marks J, Kessler H, Gama-Rodrigues J. Complete clinical response after neoadjuvant chemoradiation therapy for distal rectal cancer: characterization of clinical and endoscopic findings for standardization. Dis Colon Rectum. 2010; 53:1692-1698.
48. Habr-Gama A, Perez RO, Proscurshim I, Rawet V, Pereira DD, Sousa AH, Kiss D, Cecconello I. Absence of lymph nodes in the resected specimen after radical surgery for distal rectal cancer and neoadjuvant chemoradiation therapy: what does it mean? Dis Colon Rectum. 2008; 51:277-283.
49. Riley RD, Lambert PC, Abo-Zaid G. Meta-analysis of individual participant data: rationale, conduct, and reporting. BMJ 2010; 340: c221.
50. Wells GASB, O’Connell D , Peterson J , Welch V , Losos M , Tugwell P. The Newcastle-Ottawa Scale (NOS) for assessing the quality of nonrandomized studies in meta-analyses. [cited 25 Nov 2015]; Available from: http://www.ohri.ca/programs/clinical_ epidemiology/oxford.htm
51. Higgins JP, Thompson SG, Deeks JJ, Altman DG. Measuring inconsistency in meta-analyses . BMJ. 2003; 327: 557- 60.
52. Deeks JJ, Higgins JPT, Altman DG (editors). Chapter 9: Analysing data and undertaking meta-analyses. In: Higgins JPT, Green S (editors). Cochrane Handbook for Systematic Reviews of Interventions Version 5.1.0 (updated March 2011). The Cochrane Collaboration, 2011. Available from http://www.cochrane-handbook.org.
53. Sterne JAC, Egger M, Moher D (editors). Chapter 10: Addressing reporting biases. In: Higgins JPT, Green S (editors). Cochrane Handbook for Systematic Reviews of Intervention. Version 5.1.0 (updated March 2011). The Cochrane Collaboration, 2011. Available from http://www.cochrane-handbook.org.