
INTRODUCTION
Pancreatic ductal adenocarcinoma (PDAC) is the most common malignancy in the pancreas, with a resectable rate of only 20% and an overall 5-year survival rate of approximately 6% [1]. It was reported that around 330,000 patients died of PDAC during 2012, making it the seventh leading cause of cancer-related death worldwide [2]. Despite the improvement in diagnostic and therapeutic strategies, the prognosis for PDAC remains extremely dismal [3]. Hence, it is of vital importance to find more effective molecular prognostic markers for the treatment of PDAC patients in clinical practice [4, 5].
Specificity protein 1 (Sp1), a founding member of the Sp transcription factor family, is a sequence-specific and DNA-binding protein which affects cell proliferation, differentiation and apoptosis [6]. Accumulating evidence shows that the overexpression of Sp1 occurs frequently in a wide range of tumors [7, 8] and is correlated with unsatisfactory clinical outcome in these tumors [9–11]. Notably, previous studies revealed that Sp1 plays a critical role in the pathogenesis, aggressiveness and angiogenesis of PDAC [12–15]. Recently, evidence suggested that Sp1 may promote tumor growth by regulating the function of COX2, whose expression was also elevated in PDAC and correlated with pancreatic cancer cell proliferation and migration [16, 17]. In 2013, Lai et al. showed that the ZBTB10-Sp1 pathway was involved in follicle stimulating hormone-induced COX2 expression in ovarian epithelial cancer cells [18]. Silva et al. also demonstrated that vorinostat, an HDAC inhibitor, promoted cell-cycle arrest, inhibited growth, and induced apoptosis and differentiation of acute myeloid leukemia and myelodysplastic syndrome cells by inhibiting DNA binding of Sp1 to the proximal promoter regions of some genes including COX2 [19]. In PDAC, another study revealed that celecoxib inhibited angiogenesis and metastasis via the suppression of Sp1 [14]. However, until now, the correlation between Sp1 and COX2 and their synergistic effect on the prognosis of PDAC patients remains unknown.
In this study, we evaluated the expression of Sp1 and COX2 by immunohistochemistry on tissue microarray slides and studied their prognostic value in the PDAC patients. We also investigated their correlation in PDAC cell lines. To our knowledge, this is the first study to analyze the correlation between Sp1 and COX2 and to investigate their combined prognostic value in PDAC.
RESULTS
Correlations between Sp1/COX2 and clinicopathological characteristics
Sp1 expression was significantly higher in PDAC cases with lymph node metastasis (P=0.02) than those without lymph node metastasis. Likewise, COX2 expression correlated with lymph node metastasis (P=0.03). However, no significant differences in Sp1 or COX2 expression were identified in patients of different age, sex, tumor stage, primary tumor location, lymphovascular invasion, nuclear grade, and clinical manifestation (Table 1).
Table 1: Correlation between Sp1, COX2 and clinicopathological features of PDAC patients
Factors |
N |
Sp1 |
COX2 |
||||
|---|---|---|---|---|---|---|---|
Negative |
Positive |
P-value |
Negative |
Positive |
P-value |
||
Gender |
|||||||
Male |
56 |
21 |
35 |
0.56 |
17 |
39 |
0.83 |
Female |
32 |
14 |
18 |
9 |
23 |
||
Age |
|||||||
≤60 |
41 |
17 |
24 |
0.76 |
11 |
30 |
0.60 |
>60 |
47 |
18 |
29 |
15 |
32 |
||
T stage |
|||||||
≤T2 |
74 |
31 |
43 |
0.35 |
20 |
54 |
0.38 |
T3 |
14 |
4 |
10 |
6 |
8 |
||
N stage |
|||||||
N0 |
52 |
26 |
26 |
0.02* |
20 |
32 |
0.03* |
N1 |
36 |
9 |
27 |
6 |
30 |
||
Primary tumor location |
|||||||
Body and Tail |
30 |
15 |
15 |
0.16 |
8 |
22 |
0.67 |
Head and Neck |
58 |
20 |
38 |
18 |
40 |
||
Lymphovascular invasion |
|||||||
No |
50 |
22 |
28 |
0.35 |
15 |
35 |
0.92 |
Yes |
38 |
13 |
25 |
11 |
27 |
||
Nuclear grade |
|||||||
≤II |
73 |
31 |
42 |
0.26 |
19 |
54 |
0.20 |
>II |
15 |
4 |
11 |
7 |
8 |
||
Jaundice |
|||||||
No |
62 |
28 |
34 |
0.11 |
20 |
42 |
0.39 |
Yes |
26 |
7 |
19 |
6 |
20 |
||
Abdominal pain |
|||||||
No |
39 |
14 |
25 |
0.51 |
15 |
24 |
0.10 |
Yes |
49 |
21 |
28 |
11 |
38 |
||
Abbreviation: N, number; Sp1, specificity protein 1; COX2, cyclooxygenase-2. *P < 0.05 indicates a significant association among the variables.
Correlation between Sp1 and COX2
To determine whether Sp1 expression is positively related to COX2 expression in PDAC samples, serial sections from the same PDAC tissue were scored for intracellular staining intensity of either Sp1 or COX2. Figure 1 depicts the co-distribution of Sp1 and COX2 in PDAC. Spearman’s rank test demonstrated a significant correlation between Sp1 and COX2 (r=0.599; P<0.001).
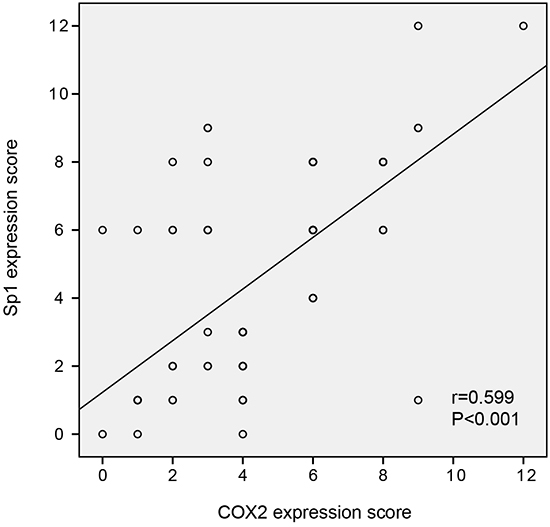
Figure 1: The correlation between Sp1 and COX2 expression in PDAC tissues. Spearman’s rank test demonstrated a significant correlation between Sp1 and COX2 (r=0.599; P<0.001).
Correlation between Sp1/COX2 and the prognosis
To investigate the prognostic value of Sp1 and COX2 in the survival of PDAC patients, a Kaplan–Meier analysis was conducted. We demonstrated that the median OS in Sp1-positive patients was 9.9 months which was significantly shorter than those of Sp1-negative patients (P=0.002, Figure 2A). Similarly, COX2-positive patients showed a worse prognosis (median OS: 10.4 months) than COX2-negative patients (median OS: 40.2 months) (P=0.01, Figure 2B). Intriguingly, patients with both Sp1- and COX2-positive expression exhibited worst OS than other conditions (P=0.005, Figure 2C). Likewise, when the latter three conditions were combined into a single variable named “all others”, a similar result was found (P=0.01, Figure 2D).
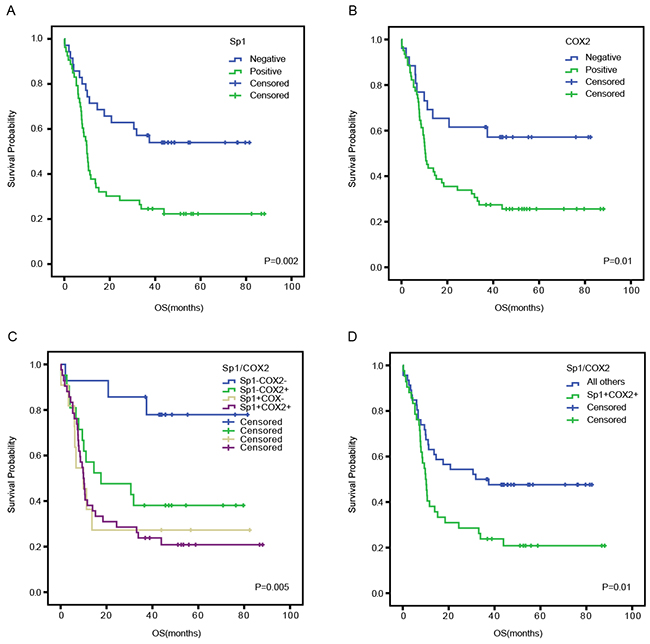
Figure 2: Overall survival curves based on Sp1 and COX2 expression in PDAC tissues. The overall survival curves were based on Sp1 A., COX2 B., and the combination of Sp1 and COX2 (as polytomous variables and binary categorical variables, respectively) C and D.. All others: Sp1+COX2-, Sp1-COX2+, and Sp1-COX2-.
Univariate and multivariate analysis
To evaluate the prognostic value of Sp1, COX2, and other clinicopathological characteristics, we performed a univariate analysis. N stage (P=0.006), nuclear grade (P=0.02), positive Sp1 or COX2 expression (P=0.003 and P=0.01, respectively), and combined positive expression of Sp1 and COX2 (P=0.01) were significantly associated with poor OS. According to the multivariate analysis, Sp1 expression (P=0.03; HR=4.48; 95% CI 1.14–17.62), COX2 expression (P=0.04; HR=3.84; 95% CI 1.08–13.71) and nuclear grade (P=0.009; HR=0.37; 95% CI 0.18–0.78) were independent prognostic factors for OS of PDAC patients. However, the N stage (P=0.07; HR=0.59; 95% CI 0.33–1.04) and combined positive expression of Sp1 and COX2 (P=0.16; HR=0.33; 95% CI 0.07–1.55) were not independently associated with OS (Table 2).
Table 2: Univariate and multivariate survival analysis of clinicopathological variables in PDAC patients
Factors |
N |
OS median(range) |
Univariate analysis |
Multivariate analysis |
||||
|---|---|---|---|---|---|---|---|---|
HR |
95%CI |
P-value |
HR |
95%CI |
P-value |
|||
Gender |
||||||||
Male |
56 |
11.1(0.2-88.0) |
0.58 |
0.33-1.03 |
0.07 |
|||
Female |
32 |
36.7(0.1-76.4) |
1 |
|||||
Age |
||||||||
>60 |
47 |
11.3(0.2-86.7) |
1.05 |
0.63-1.77 |
0.84 |
|||
≤60 |
41 |
15.2(0.1-88.0) |
1 |
|||||
T stage |
||||||||
T3 |
14 |
23.5(0.2-88.0) |
1.03 |
0.50-2.09 |
0.95 |
|||
≤T2 |
74 |
12.6(0.1-86.7) |
1 |
|||||
N stage |
||||||||
N0 |
52 |
33.5(0.2-88.0) |
0.69 |
0.53-0.90 |
0.006* |
0.59 |
0.33-1.04 |
0.07 |
N1 |
36 |
9.8(0.1-86.7) |
1 |
1 |
||||
Primary tumor location |
||||||||
Head and Neck |
58 |
14.8(0.1-88.0) |
0.83 |
0.49-1.43 |
0.51 |
|||
Body and Tail |
30 |
10.5(1.3-79.6) |
1 |
|||||
Lymph vascular invasion |
||||||||
Yes |
38 |
10.6(0.2-82.4) |
1.39 |
0.82-2.33 |
0.22 |
|||
No |
50 |
18.0(0.1-88.0) |
1 |
|||||
Nuclear grade |
||||||||
≤II |
73 |
18.4(0.2-88.0) |
0.68 |
0.49-0.93 |
0.02* |
0.37 |
0.18-0.78 |
0.01* |
>II |
15 |
7.0(0.1-79.6) |
1 |
1 |
||||
Jaundice |
||||||||
No |
62 |
14.2(0.2-82.4) |
0.98 |
0.55-1.74 |
0.94 |
|||
Yes |
26 |
11.5(0.1-88.0) |
1 |
|||||
Abdominal pain |
||||||||
No |
39 |
10.6(0.1-88.0) |
0.71 |
0.42-1.19 |
0.19 |
|||
Yes |
49 |
17.6(2.7-86.7) |
1 |
|||||
Sp1 |
||||||||
Positive |
53 |
9.9(0.1-88.0) |
2.42 |
1.35-4.33 |
0.003* |
4.48 |
1.14-17.62 |
0.03* |
Negative |
35 |
37.4(0.2-81.5) |
1 |
1 |
||||
COX2 |
||||||||
Positive |
62 |
10.4(0.2-88.0) |
2.28 |
1.18-4.42 |
0.01* |
3.84 |
1.08-13.71 |
0.04* |
Negative |
26 |
40.2(0.1-82.4) |
1 |
1 |
||||
Sp1/COX2 |
||||||||
Sp1+/COX2+ |
42 |
10.1(0.2-88.0) |
1.95 |
1.15-3.30 |
0.01* |
0.33 |
0.07-1.55 |
0.16 |
All others |
46 |
34.2(0.1-82.4) |
1 |
1 |
||||
Abbreviation: N, number; HR, hazard ratio; 95%CI, 95% confidence interval.
All others: Sp1+COX2-, Sp1-COX2+, and Sp1-COX2-.
Sp1 promoted the expression of COX2 in PDAC cell lines
To confirm the association between Sp1 and COX2, we performed in vitro experiments. The expression of Sp1 and COX2 in HPDE pancreatic cells and two PDAC cell lines, Bxpc-3 and SW1990, were evaluated by western blot analysis. Higher expression of Sp1 and COX2 were observed in PDAC cells lines than in HPDE cells (Figure 3A). Sp1 was silenced by transient transfection of siRNAs in Bxpc-3 and SW1990 cell lines, which are characterized by high SP1 expression. The expression of Sp1 was successfully suppressed at 48 h after transfection and verified by western blot analysis. Accordingly, downregulated expression of COX2 was observed in Sp1 knockdown Bxpc-3 and SW1990 cell lines (Figure 3B).
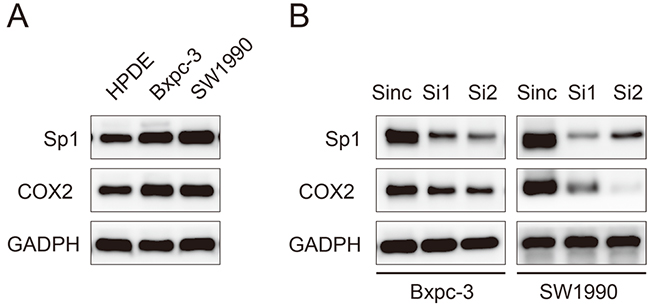
Figure 3: Sp1 promotes the expression of COX2 in human pancreatic cancer cell lines. A. Western blot analysis of Sp1 and COX2 in HPDE, Bxpc-3, and SW1990 cells. B. Western blot analysis of Sp1 and COX2 in Sinc-, Si1-, and Si2-treated Bxpc-3 and SW1990 cells.
DISCUSSION
Our study corroborated previous studies that Sp1 and COX2 are upregulated in PDAC tissues and are inversely correlated with survival. Notably, we further found a novel correlation between the expression of Sp1 and COX2 in PDAC samples and validated this association in PDAC cell lines. To the best of our knowledge, this is the first study to investigate the correlation between Sp1 and COX2 and their prognostic value in PDAC.
As previous studies showed, Sp1 and COX2 play a critical role in the pathogenesis, aggressiveness, and angiogenesis of PDAC and their high expression usually indicates the presence of lymph node metastasis, advanced cancer stage, and reduced OS. We identified a positive correlation between Sp1, COX2, and the nodal stage in PDAC (P=0.02 and P=0.03, respectively). Node positivity is one of the typical indicators of pancreatic cancer metastasis. Jiang et al. clearly showed that every PDAC patient with SP1 overexpression had lymph node metastasis [12]. Wenjun Li et al. also reported that COX2 promoted PDAC cell migration through modifying the epithelial–mesenchymal transition process [17]. Collectively, it was suggested that the upregulated expression of COX2 by Sp1 in PDAC cells promotes tumor cell epithelial–mesenchymal transition and facilitates their migration and metastasis into lymphatic vessels [20]. This finding might assist in the decision to remove lymph nodes during surgery. However, neither Sp1 nor COX2 was correlated with tumor stage, lymphovascular invasion, and other clinicopathological factors, which may partially be explained by the small sample size of our study.
Several previous studies suggested that Sp1 may regulate the expression and function of COX2 in ovarian epithelial cancer and of acute myeloid leukemia [18, 19]. In this study, we also demonstrated a positive correlation between Sp1 and COX2 in PDAC samples (r=0.599; P<0.001) and further confirmed this observation in PDAC cell lines by transiently knocking down SP1. The potential clinical importance of this finding lies in the facts that current chemotherapeutic regimens do not provide PDAC patients with substantial survival benefit [21] and COX2 has been exploited in clinical trials of PDAC as a therapeutic target with inconsistent results and inevitable side effects [22–25]. Our study supported the idea that Sp1 regulates the expression of COX2 in PDAC cells. Such a finding may suggest a safe and efficacious mode of suppressing COX2 by targeting Sp1, which lacks the side effects related to COX2-inhibitory activity but has improved antineoplastic properties.
Both Sp1 and COX2 were found to be independent prognostic factors for PDAC in the present study, and their discriminative ability was almost the same. These findings strongly suggested the combination of Sp1 and COX2 may be of improved value in predicting PDAC patient survival. As expected, Kaplan–Meier analysis revealed that Sp1- and COX2-positive patients tended to have poorer prognosis than other conditions. However, the combined positive expression of Sp1 and COX2 was not demonstrated to be an independent prognostic factor in the Cox regression model, which may be explained by a defect in sample number and bias in the immunohistochemical evaluation.
In conclusion, our research demonstrated that Sp1 upregulates the expression of COX2 in PDAC, and that both are of significant prognostic value for PDAC patients. Further well-designed studies with larger sample sizes and new quantitative molecular techniques are required to evaluate this correlation.
MATERIALS AND METHODS
Cell culture
Pancreatic cancer cell lines Bxpc-3 and SW1990 were purchased from the Cell Bank of Chinese Academy of Science in Shanghai, China. Cells were cultured in RPMI-1640 (Gibco, Carlsbad, CA, USA) supplemented with 10% fetal bovine serum (Gibco) at 37°C in a humidified atmosphere of 95% air and 5% CO2, and subcultured by harvesting with trypsin-EDTA.
RNA interference
RNA interference was conducted as previously described [26]. Small interfering RNAs (siRNAs) targeting Sp1 were chemically synthesized (Invitrogen, Shanghai, China). The siRNA oligonucleotides included Si1 (CAGCGUUUCUGCAGCUACCUUGACU) and Si2 (GACAGGUCAGUUGGCAGACUCUACA), while a vector (UUCUCCGAACGUGUCACGUdTdT) not targeting any annotated human genes was used as a negative control (Sinc). Transfection of siRNA duplexes into pancreatic cancer cells was carried out using Lipofectamine 2000 (Invitrogen) according to the manufacturer’s instructions. At 48 h post-transfection, cells were harvested for western blot analysis.
Western blot analysis
Cells were washed three times with cold PBS and lysed on ice in RIPA buffer containing PMSF protease inhibitor. The protein concentrations were determined using the BCA method (Beyotime Biotechnology, Haimen, China). A total of 30 μg of protein was separated by 10% SDS-PAGE and electro-blotted onto nitrocellulose membranes using a semi-dry blotting apparatus. After blocking in 3% bovine serum albumin, the membranes were incubated overnight at 4°C with primary antibodies against Sp1 and COX2 (Cell Signaling Technology, Beverly, MA, USA), and GAPDH (Santa Cruz Biotechnology, Santa Cruz, CA, USA) at 1μg/ml. The membranes were then incubated in the secondary antibodies for 1h at room temperature on a shaker. The protein bands were visualized by using a commercially available enhanced chemiluminescence kit (Thermo Scientific, Hudson, NH, USA). GAPDH was used as a loading control.
Patients and specimens
From January 2009 to December 2012, 88 PDAC patients were enrolled at the Department of General Surgery, Shanghai General Hospital, Shanghai Jiao Tong University. Cancerous and adjacent normal tissue was collected during surgery, and histopathologically confirmed and staged according to the Union for International Cancer Control. Clinicopathological characteristics included age, sex, primary tumor location, clinical manifestation, and pathological stage (Table 3). Patients’ written informed consents and approval from the Ethics Committees of Shanghai General Hospital were obtained for the use of these clinical materials.
Table 3: Detailed characteristics of PDAC patients
Characteristics |
Categories |
Number |
|---|---|---|
Gender |
Male |
56 |
Female |
32 |
|
Age median(range) |
62(36-85) |
|
T stage |
T1 |
5 |
T2 |
69 |
|
T3 |
14 |
|
N stage |
N0 |
52 |
N1 |
36 |
|
TNM stage |
IA |
4 |
IB |
37 |
|
IIA |
11 |
|
IIB |
36 |
|
Primary tumor location |
Head and Neck |
58 |
Body and Tail |
30 |
|
Lymph vascular invasion |
Yes |
38 |
No |
50 |
|
Nuclear grade |
I |
1 |
II |
72 |
|
III |
15 |
|
Jaundice |
Yes |
26 |
No |
62 |
|
Abdominal pain |
Yes |
49 |
No |
39 |
Tissue microarray construction
The microarray was made in collaboration with Shanghai Biochip, Shanghai, China. Representative tumor regions were defined as tumor areas containing more than 75% cancer cells without necrosis. Bleeding areas were neglected. Tissue cylinders (1.5 mm in diameter) were then punched from the defined regions of the block using a tissue microarray (Century, IL, CA, USA) and placed into recipient paraffin blocks. Two sets of three paraffin-embedded tissue microarray blocks were made, each containing 88 tumor tissue spots. Sections of the resulting tissue microarray blocks were transferred to glass slides.
Immunohistochemistry
The standard IHC protocol used was described previously [27]. Briefly, the tissue microarrays were dewaxed and dehydrated in a xylene and alcohol bath solution. Endogenous peroxidase activity was then blocked with 0.3% hydrogen peroxide for 10 mins. After that, antigen retrieval was performed by setting the slides in 0.01 M citrate buffer (pH 6.0) at 98°C for 5 min using a microwave oven. The slides were cooled to room temperature and blocked by incubating with normal goat serum at room temperature for 1h, followed by incubation with the primarily antibodies (Cell Signaling Technology, Beverly, MA, USA) at 4°C overnight. The sections were then incubated with the HRP-labeled secondary antibody and were visualized by 3, 3′-diaminobenzidine staining.
Evaluation of immunohistochemistry
Sp1 and COX2 immunostaining signals were evaluated by two pathologists blinded to the clinical information. Tissues with brown cytoplasmic or nuclear staining for Sp1 and COX2 were considered positive. After scanning the stained sections at lower (×100) magnification, five areas with the greatest number of Sp1- or COX2-positive cells were selected. Then, these cells were counted and estimated (per mm2) at higher (×400) magnification. After the counting process, the percentage of Sp1- or COX2-positive cells was scored into the following five categories: 1 (< 25%); 2 (25% to 50%); 3 (50% to 75%); and 4 (> 75%). The staining intensity of positive cells was scored as 0 (absent); 1 (weak infiltration); 2 (moderate infiltration), and 3 (strong infiltration) (Figure 4). The final score was the product of the intensity and the percentage. The distribution pattern of Sp1 and COX2 expression score in PDAC was demonstrated in Figure 5A. For statistical analyses, these categories were further dichotomized into Sp1/COX2-negative (0-3) or -positive (4-12) (Figure 5B).
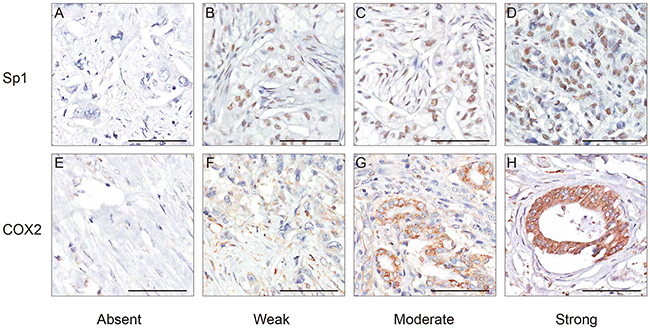
Figure 4: Representative immunohistochemical staining of Sp1 and COX2 in PDAC. A. Absent staining of Sp1, score 0. B. Weak staining of Sp1, score 3. C. Moderate staining of Sp1, score 6. D. Strong staining of Sp1, score 12. E. Absent staining of COX2, score 0. F. Weak staining of COX2, score 1. C. Moderate staining of COX2, score 6. D. Strong staining of COX2, score 12. Bar: 100 μm.
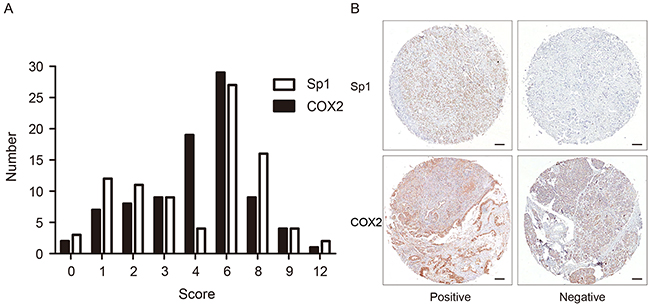
Figure 5: The distribution pattern and representative images of Sp1- and COX2- positive/negative expression. A. The expression score and distribution pattern of Sp1 and COX2. B. Representative images of Sp1 and COX2 staining with positive/negative expression in PDAC tissues.Bar: 100 μm.
Statistical analysis
All statistical analyses were performed using SPSS statistical software (version 21.0; SPSS Inc., Chicago, IL, USA). The relationships between Sp1 and COX2 protein expression and histological or clinical factors were investigated using the Pearson Chi-square test and Continuity Correction. The correlation between Sp1 and COX2 was evaluated with the Spearman’s rank test. Kaplan–Meier analysis was used to demonstrate differences in overall survival (OS). The Cox regression model was used to evaluate the correlation between prognostic factors and OS. Factors correlated with the OS in the univariate analysis were further tested by multivariate analysis. The hazard ratio (HR) and corresponding 95% confidence interval (95% CI) were calculated for each factor. Results were considered statistically significant when P<0.05.
ACKNOWLEDGMENTS
The National Science Foundation of China supported this work [Grant Number: 81502017, 81502018, 81572315, 81171887 and 91229117]
CONFLICTS OF INTEREST
All authors declare no conflicts of interest.
REFERENCES
1. Stathis A and Moore MJ. Advanced pancreatic carcinoma: current treatment and future challenges. Nature reviews Clinical oncology. 2010; 7:163-172.
2. Torre LA, Bray F, Siegel RL, Ferlay J, Lortet-Tieulent J and Jemal A. Global cancer statistics, 2012. CA Cancer J Clin. 2015; 65:87-108.
3. Heinemann V, Haas M and Boeck S. Systemic treatment of advanced pancreatic cancer. Cancer treatment reviews. 2012; 38:843-853.
4. Garcea G, Neal CP, Pattenden CJ, Steward WP and Berry DP. Molecular prognostic markers in pancreatic cancer: a systematic review. European journal of cancer. 2005; 41:2213-2236.
5. Takai E, Totoki Y, Nakamura H, Morizane C, Nara S, Hama N, Suzuki M, Furukawa E, Kato M, Hayashi H, Kohno T, Ueno H, Shimada K, Okusaka T, Nakagama H, Shibata T, et al. Clinical utility of circulating tumor DNA for molecular assessment in pancreatic cancer. Scientific reports. 2015; 5:18425.
6. Li L and Davie JR. The role of Sp1 and Sp3 in normal and cancer cell biology. Annals of anatomy. 2010; 192:275-283.
7. Vizcaino C, Mansilla S and Portugal J. Sp1 transcription factor: A long-standing target in cancer chemotherapy. Pharmacology & therapeutics. 2015; 152:111-124.
8. Safe S and Abdelrahim M. Sp transcription factor family and its role in cancer. European journal of cancer. 2005; 41:2438-2448.
9. Wang L, Wei D, Huang S, Peng Z, Le X, Wu TT, Yao J, Ajani J and Xie K. Transcription factor Sp1 expression is a significant predictor of survival in human gastric cancer. Clinical cancer research. 2003; 9:6371-6380.
10. Jiang W, Jin Z, Zhou F, Cui J, Wang L and Wang L. High co-expression of Sp1 and HER-2 is correlated with poor prognosis of gastric cancer patients. Surgical oncology. 2015; 24:220-225.
11. Wang J, Kang M, Qin YT, Wei ZX, Xiao JJ and Wang RS. Sp1 is over-expressed in nasopharyngeal cancer and is a poor prognostic indicator for patients receiving radiotherapy. International journal of clinical and experimental pathology. 2015; 8:6936-6943.
12. Jiang NY, Woda BA, Banner BF, Whalen GF, Dresser KA and Lu D. Sp1, a new biomarker that identifies a subset of aggressive pancreatic ductal adenocarcinoma. Cancer epidemiology, biomarkers & prevention. 2008; 17:1648-1652.
13. Sankpal UT, Maliakal P, Bose D, Kayaleh O, Buchholz D and Basha R. Expression of specificity protein transcription factors in pancreatic cancer and their association in prognosis and therapy. Current medicinal chemistry. 2012; 19:3779-3786.
14. Wei D, Wang L, He Y, Xiong HQ, Abbruzzese JL and Xie K. Celecoxib inhibits vascular endothelial growth factor expression in and reduces angiogenesis and metastasis of human pancreatic cancer via suppression of Sp1 transcription factor activity. Cancer research. 2004; 64:2030-2038.
15. Tan Y, Yin H, Zhang H, Fang J, Zheng W, Li D, Li Y, Cao W, Sun C, Liang Y, Zeng J, Zou H, Fu W and Yang X. Sp1-driven up-regulation of miR-19a decreases RHOB and promotes pancreatic cancer. Oncotarget. 2015; 6:17391-17403. doi: 10.18632/oncotarget.3975.
16. Tucker ON, Dannenberg AJ, Yang EK, Zhang F, Teng L, Daly JM, Soslow RA, Masferrer JL, Woerner BM, Koki AT and Fahey TJ, 3rd. Cyclooxygenase-2 expression is up-regulated in human pancreatic cancer. Cancer research. 1999; 59:987-990.
17. Li W, Mao Z, Fan X, Cui L and Wang X. Cyclooxygenase 2 promoted the tumorigenecity of pancreatic cancer cells. Tumour biology. 2014; 35:2271-2278.
18. Lai Y, Zhang X, Zhang Z, Shu Y, Luo X, Yang Y, Wang X, Yang G, Li L and Feng Y. The microRNA-27a: ZBTB10-specificity protein pathway is involved in follicle stimulating hormone-induced VEGF, Cox2 and survivin expression in ovarian epithelial cancer cells. International journal of oncology. 2013; 42:776-784.
19. Silva G, Cardoso BA, Belo H and Almeida AM. Vorinostat induces apoptosis and differentiation in myeloid malignancies: genetic and molecular mechanisms. PloS one. 2013; 8:e53766.
20. Xu Y, Hu B, Qin L, Zhao L, Wang Q, Wang Q, Xu Y and Jiang J. SRC-1 and Twist1 expression positively correlates with a poor prognosis in human breast cancer. International journal of biological sciences. 2014; 10:396-403.
21. Wormann SM and Algul H. Risk factors and therapeutic targets in pancreatic cancer. Frontiers in oncology. 2013; 3:282.
22. Lipton A, Campbell-Baird C, Witters L, Harvey H and Ali S. Phase II trial of gemcitabine, irinotecan, and celecoxib in patients with advanced pancreatic cancer. Journal of clinical gastroenterology. 2010; 44:286-288.
23. El-Rayes BF, Zalupski MM, Shields AF, Ferris AM, Vaishampayan U, Heilbrun LK, Venkatramanamoorthy R, Adsay V and Philip PA. A phase II study of celecoxib, gemcitabine, and cisplatin in advanced pancreatic cancer. Investigational new drugs. 2005; 23:583-590.
24. Ferrari V, Valcamonico F, Amoroso V, Simoncini E, Vassalli L, Marpicati P, Rangoni G, Grisanti S, Tiberio GA, Nodari F, Strina C and Marini G. Gemcitabine plus celecoxib (GECO) in advanced pancreatic cancer: a phase II trial. Cancer chemotherapy and pharmacology. 2006; 57:185-190.
25. Dragovich T, Burris H, 3rd, Loehrer P, Von Hoff DD, Chow S, Stratton S, Green S, Obregon Y, Alvarez I and Gordon M. Gemcitabine plus celecoxib in patients with advanced or metastatic pancreatic adenocarcinoma: results of a phase II trial. American journal of clinical oncology. 2008; 31:157-162.
26. Xu TP, Liu XX, Xia R, Yin L, Kong R, Chen WM, Huang MD and Shu YQ. SP1-induced upregulation of the long noncoding RNA TINCR regulates cell proliferation and apoptosis by affecting KLF2 mRNA stability in gastric cancer. Oncogene. 2015; 34:5648-5661.
27. Jiao F, Hu H, Han T, Yuan C, Wang L, Jin Z, Guo Z and Wang L. Long noncoding RNA MALAT-1 enhances stem cell-like phenotypes in pancreatic cancer cells. International journal of molecular sciences. 2015; 16:6677-6693.