
INTRODUCTION
Hepatocellular carcinoma (HCC) represents the most common primary liver cancer and is increasing in incidence [1]. The introduction of sorafenib has changed the clinical landscape of the disease, showing modest efficacy and reasonable tolerability [2–4]. Markers of sorafenib efficacy or resistance have yet to be identified [5–7].
The inhibition of VEGFR-2 by sorafenib is known to repress phosphoinositide 3-kinase (PI3K) and its downstream serine protein kinase (Akt), decreasing the activity of endothelium-derived nitric oxide synthase (eNOS) and reducing the production of the potent vasodilator nitric oxide (NO) [8–10]. NO, constitutively expressed by vascular endothelial cells, controls a variety of physiologic functions including neovascularization, angiogenesis [8, 9, 11] and pathological conditions [12, 13]. In particular, it appears to play a proangiogenic role in tumor angiogenesis [14].
Numerous studies have reported that specific eNOS single nucleotide polymorphisms (SNPs) affect gene transcription, resulting in a variation in eNOS protein levels and activity and consequently influencing NO [15, 16].
Among known polymorphisms, eNOS-786 T>C in the promoter region, a 27bp variable number of tandem repeats in intron 4 (eNOS VNTR 4a/b) and eNOS+894 G>T in exon 7 have received the greatest attention [15, 17, 18]. Numerous studies have investigated the extent to which eNOS polymorphisms influence the risk of developing cancer [19–21] and cardiovascular diseases [22–26], with conflicting results. However, it is still unclear how these polymorphisms affect gene expression and enzyme activity in cells and how they influence response to anti-angiogenic drugs [27]. The aim of the ePHAS study (eNOS polymorphisms in HCC and sorafenib) was to evaluate the prognostic value of eNOS polymorphisms in two independent cohorts of advanced HCC patients undergoing treatment with sorafenib.
RESULTS
Patient characteristics
The main clinical pathological characteristics of patients are shown in Table 1. In the training cohort the median follow-up was 50 months (range 1-82). Median progression-free survival (PFS) was 3.9 months (95% CI 2.7-5.7) and median overall survival (OS) was 11.3 months (95% CI 6.7-14.9). The dose of sorafenib was reduced in 9 (21.9%) patients. The median follow-up in the validation cohort was 47 months (range 1-52). Median PFS was 4.6 (95% CI 2.6-5.7), while median OS was 12.4 months (95% CI 8.2-17.2). Seventeen (19.5%) patients required a reduction in the dose of sorafenib. Clinical pathological characteristics were similar between the two cohorts, with the exception of median age and etiology.
Table 1: Patient characteristics
Clinical and pathologic indexes |
Training cohort (n=41) |
Validation cohort (n=87) |
|
|---|---|---|---|
No. of Patients (%) |
No. of Patients (%) |
p |
|
Median age, years (range) |
72 (28-87) |
67 (24-86) |
0.016 |
Gender |
|||
Male |
32 (78.1) |
60 (69.0) |
|
Female |
9 (21.9) |
27 (31.0) |
0.392 |
Smoking habits |
|||
No |
18 (50.0) |
12 (42.9) |
|
Yes |
18 (50.0) |
16 (57.1) |
0.752 |
Etiology |
|||
Metabolic syndrome |
8 (19.5) |
5 (5.7) |
|
Alcohol |
6 (14.6) |
6 (6.9) |
|
Viral |
27 (65.8) |
71 (81.7) |
|
Cryptogenic |
0 |
5 (5.7) |
0.017 |
BCLC stage |
|||
B |
8 (20.0) |
20 (25.9) |
|
C |
32 (80.0) |
57 (74.1) |
0.624 |
MELD score |
|||
≤10 |
30 (81.1) |
37 (62.7) |
|
>10 |
7 (18.9) |
22 (37.3) |
0.093 |
Serum α-FP level |
|||
≤400 KUI/L |
20 (52.6) |
52 (69.3) |
|
>400 KUI/L |
18 (47.4) |
23 (30.7) |
0.124 |
Diabetes |
|||
No |
24 (60.0) |
68 (78.2) |
|
Yes |
16 (40.0) |
19 (21.8) |
0.056 |
Sorafenib dose reduction |
|||
No |
32 (78.1) |
70 (80.5) |
|
Yes |
9 (21.9) |
17 (19.5) |
0.753 |
Portal vein thrombosis |
|||
No |
21 (70.0%) |
39 (67.2%) |
|
Yes |
9 (30.0%) |
19 (32.8%) |
0.982 |
Liver cirrhosis |
|||
No |
1 (2.4%) |
2 (2.2%) |
|
Yes |
40 (97.6%) |
85 (97.8%) |
0,954 |
Disease extension |
|||
Liver only |
23 (69.6%) |
42 (72.4%) |
|
Metastatic disease |
7 (30.4%) |
16 (27.6%) |
0.861 |
BCLC: Barcelona-Clinic Liver Cancer; MELD: Model For End-Stage Liver Disease
Clinical variables
PFS and OS data in relation to baseline patient characteristics and toxicity in both cohorts are shown in Table 2. In particular, we found that validation cohort patients with a MELD score ≤10 showed better PFS (5.7 vs. 1.6 months, P < 0.0001) and OS (13.6 vs. 4.4 months, P = 0.004) than those with a MELD score > 10. These data were not significant in the training cohort. With regard to hypertension, training cohort patients with increased systolic blood pressure (> 140 mmHg) and/or increased diastolic blood pressure (> 90 mmHg) after 15 days’ treatment with sorafenib showed better PFS (6.1 vs. 2.8 months, P = 0.005) and OS (14.6 vs.7.5 months, P = 0.027) than those with no hypertension. No data on hypertension were available for the validation cohort.
Table 2: PFS and OS in relation to clinical characteristics and toxicity in the two independent cohorts
Training set |
Validation set |
|||||||||||||
|---|---|---|---|---|---|---|---|---|---|---|---|---|---|---|
No. of Patients |
No. of Events |
Median PFS (95% CI) |
P |
No. of Events |
Median OS (95% CI) |
P |
No. of Patients |
No. of Events |
Median PFS (95% CI) |
P |
No. of Events |
Median OS (95% CI) |
P |
|
Gender |
||||||||||||||
Male |
32 |
31 |
3.7 (2.6-4.7) |
28 |
8.7 (3.9-14.9) |
60 |
50 |
3.9 (2.4-6.2) |
43 |
11.3 (8.2-17.2) |
||||
Female |
9 |
7 |
8.2 (2.2-11.2) |
0.166 |
7 |
14.6 (6.6-23.0) |
0.266 |
27 |
23 |
5.0 (2.1-6.3) |
0.516 |
19 |
14.1 (5.6-27.0) |
0.842 |
Smoking habits |
||||||||||||||
No |
18 |
17 |
4.3 (2.6-8.5) |
16 |
10.8 (6.8-14.6) |
12 |
9 |
13.8 (2.1-27.1) |
6 |
27.8 (14.1-35.0) |
||||
Yes |
18 |
17 |
4.2 (2.6-6.2) |
0.997 |
17 |
9.8 (2.9-15.8) |
0.578 |
16 |
11 |
2.4 (1.1-15.2) |
0.112 |
9 |
5.2 (2.5-39.0) |
0.125 |
Etiology |
||||||||||||||
Metabolic syndrome |
8 |
8 |
3.0 (0.9-6.0) |
6 |
6.8 (1.0-nr) |
5 |
4 |
2.4 (2.1-8.7) |
3 |
7.5 (3.7-9.9) |
||||
Alcohol |
6 |
6 |
6.7 (2.6-34.2) |
6 |
15.3 (2.7-34.2) |
6 |
5 |
13.5 (2.0-31.4) |
5 |
14.4 (3.0-50.8) |
||||
Viral |
27 |
24 |
4.7 (2.6-5.8) |
23 |
11.2 (6.9-15.1) |
71 |
59 |
3.9 (2.5-5.7) |
50 |
12.4 (8.2-18.0) |
||||
Cryptogenic |
0 |
0 |
- |
0.195 |
0 |
- |
0.458 |
5 |
5 |
3.4 (1.7-27.0) |
0.599 |
4 |
10.5 (2.5-nr) |
0.729 |
BCLC stage |
||||||||||||||
B |
8 |
7 |
4.3 (0.5-21.6) |
6 |
10.0 (0.5-23.0) |
11 |
6 |
9.0 (4.8-27.1) |
2 |
18.0 (14.4-nr) |
||||
C |
32 |
30 |
3.8 (2.7-5.7) |
0.780 |
28 |
12.0 (6.7-14.9) |
0.747 |
38 |
30 |
2.5 (2.0-8.7) |
0.084 |
24 |
19.5 (3.7-28.8) |
0.100 |
MELD score |
||||||||||||||
≤10 |
30 |
29 |
3.9 (2.6-6.0) |
26 |
12.0 (3.9-14.9) |
37 |
32 |
5.7 (3.9-12.8) |
29 |
13.6 (9.7-27.8) |
||||
>10 |
7 |
6 |
3.8 (1.2-34.2) |
0.706 |
6 |
8.5 (2.9-34.2) |
0.863 |
22 |
22 |
1.6 (1.1-2.4) |
<0.0001 |
20 |
4.4 (2.5-10.9) |
0.004 |
Serum α-FP level |
||||||||||||||
≤400 KUI/L |
20 |
18 |
3.8 (2.6-6.0) |
16 |
10.1 (3.9-23.6) |
52 |
44 |
5.0 (3.4-6.3) |
38 |
12.4 (7.2-19.5) |
||||
>400 KUI/L |
18 |
17 |
4.6 (2.6-10.8) |
0.327 |
16 |
12.0 (3.9-14.9) |
0.809 |
23 |
20 |
2.4 (1.3-4.8) |
0.044 |
18 |
7.5 (2.5-13.9) |
0.043 |
Hypertension* |
||||||||||||||
No |
21 |
20 |
2.8 (2.2-3.9) |
19 |
7.5 (3.2-14.9) |
- |
0 |
- |
0 |
- |
||||
Yes |
18 |
17 |
6.1 (3.7-10.8) |
0.005 |
15 |
14.6 (11.2-23.0) |
0.027 |
- |
0 |
- |
- |
0 |
- |
|
Skin toxicity |
||||||||||||||
No |
23 |
21 |
3.8 (2.3-5.2) |
19 |
6.9 (3.2-14.9) |
53 |
43 |
2.8 (2.4-5.6) |
34 |
13.6 (6.1-17.2) |
||||
Yes |
18 |
17 |
6.2 (2.6-10.8) |
0.065 |
16 |
13.9 (7.5-16.7) |
0.124 |
34 |
30 |
5.3 (3.7-12.8) |
0.035 |
28 |
11.3 (7.2-28.6) |
0.349 |
Diarrhea |
||||||||||||||
No |
35 |
32 |
3.8 (2.6-5.8) |
29 |
10.4 (6.7-14.9) |
65 |
52 |
3.7 (2.5-6.2) |
45 |
10.9 (6.4-18.0) |
||||
Yes |
6 |
6 |
5.0 (2.7-21.6) |
0.447 |
6 |
13.9 (2.7-23.6) |
0.876 |
22 |
21 |
5.0 (2.1-9.9) |
0.365 |
17 |
13.9 (10.5-28.8) |
0.301 |
Asthenia |
||||||||||||||
No |
28 |
27 |
3.9 (2.6-5.3) |
26 |
10.8 (5.2-14.9) |
86 |
72 |
4.7 (2.6-5.7) |
61 |
12.4 (8.2-17.2) |
||||
Yes |
13 |
11 |
4.7 (1.9-8.7) |
0.681 |
9 |
13.7 (3.9-16.7) |
0.997 |
1 |
1 |
2.1 (-) |
0.281 |
1 |
3.0 (-) |
0.045 |
Mucositis |
||||||||||||||
No |
40 |
37 |
3.8 (2.6-5.7) |
34 |
11.2 (6.7-14.9) |
81 |
68 |
4.6 (2.6-5.7) |
57 |
11.8 (8.2-17.2) |
||||
Yes |
1 |
1 |
15.3 (-) |
0.397 |
1 |
15.8 (-) |
0.762 |
6 |
5 |
4.8 (1.1-nr) |
0.439 |
5 |
9.8 (2.2-nr) |
0.917 |
PFS, progression-free survival; OS, overall survival; BCLC, Barcelona-Clinic Liver Cancer; MELD, Model For End-Stage Liver Disease
* diastolic pressure >90 mmHg or systolic pressure >140 mmHg recorded 15 days after the start of sorafenib treatment
eNOS genotypes and haplotype analysis
eNOS-786 and eNOS+894 genotypes were successfully determined in all of the samples. eNOS VNTR genotype was not evaluable in 3 samples (2 in the training set and one in the validation set) because of their poor quality.
Genotype frequencies of eNOS-786, eNOS VNTR and eNOS+894 are shown in Supplementary Table 1 and all genotype frequencies followed the Hardy-Weinberg equilibrium. We observed a linkage disequilibrium between eNOS-786 and eNOS VNTR in both the training and validation cohorts (correlation coefficient, r2 = 0.227; D’= 0.85 and r2 =0.172; D’= 0.746, respectively) and identified a total of 4 haplotypes (HT). The most frequent haplotype in either cohort was HT1 (T-4b at eNOS-786/eNOS VNTR) (58.1% in the training cohort and 62% in the validation cohort), followed by HT2 (C-4b) (24.2% and 23.4%, respectively), HT3 (C-4a) (16% and 12.2%, respectively) and HT4 (T-4a), this last occurring at a frequency of < 5% (1.6% and 2.4%, respectively).
eNOS genotypes and clinical outcome in the training cohort
In univariate analysis we found that all 3 SNPs were associated with PFS but not with OS (Table 3 and Supplementary Figure 1). eNOS-786 TT, eNOS VNTR 4bb and eNOS+894 GG genotypes were significantly associated with a lower median PFS (2.6, 2.8 and 2.8 months, respectively) than other genotypes (5.8, 8.5, and 5.5 months, respectively) (P = 0.0001, P = 0.046 and P = 0.049, respectively). Interestingly, patients homozygous for HT1 had a lower median PFS than those with other haplotypes (2.6 vs. 5.8 months, P < 0.0001) (Table 3 and Figure 1A).
Table 3: Univariate analysis of PFS according to eNOS polymorphisms in the training and validation cohorts
Training cohort |
Validation cohort |
|||||||||
|---|---|---|---|---|---|---|---|---|---|---|
No. of Patients |
No. of Events |
Median PFS (95% CI) |
HR (95% CI) |
P |
No. of Patients |
No. of Events |
Median PFS (95% CI) |
HR (95% CI) |
P |
|
Overall |
38 |
3.9 (2.7-5.7) |
- |
- |
73 |
4.6 (2.6-5.7) |
- |
- |
||
eNOS-786 |
||||||||||
TT |
15 |
15 |
2.6 (1.1-2.8) |
4.43 (2.08-9.42) |
0.0001 |
37 |
35 |
2.0 (1.6-2.1) |
5.81 (3.43-9.82) |
<0.0001 |
CC+TC |
26 |
23 |
5.8 (3.8-8.7) |
1.00 |
50 |
38 |
6.9 (5.6-14.5) |
1.00 |
||
eNOS VNTR |
||||||||||
4bb |
26 |
25 |
2.8 (2.3-4.6) |
2.08 (1.01-4.29) |
0.046 |
62 |
52 |
2.5 (2.1-4.8) |
1.97 (1.18-3.31) |
0.010 |
4ab+4aa |
13 |
11 |
8.5 (3.8-15.3) |
1.00 |
24 |
21 |
6.1 (4.7-23.9) |
1.00 |
||
eNOS+894 |
||||||||||
GG |
18 |
16 |
2.8 (2.3-3.8) |
2.00 (1.00-3.99) |
0.049 |
42 |
40 |
2.5 (2.0-3.7) |
2.17 (1.35-3.49) |
0.001 |
GT+TT |
23 |
22 |
5.5 (3.7-8.5) |
1.00 |
45 |
33 |
6.9 (4.8-12.8) |
1.00 |
||
eNOS Haplotypes * (786/VNTR) |
||||||||||
HT1/HT1 |
14 |
14 |
2.6 (1.1-2.8) |
5.43 (2.46-11.98) |
<0.0001 |
35 |
33 |
2.0 (1.6-2.1) |
5.16 (3.06-8.68) |
<0.0001 |
Other |
25 |
22 |
5.8 (3.8-8.7) |
1.00 |
51 |
40 |
6.7 (5.0-13.8) |
1.00 |
||
PFS, progression-free survival; OS, overall survival; HR, hazard ratio.
*Haplotypes (HT) 1 shows the allele T at eNOS-786 and allele 4b at eNOS VNTR. “Other” indicates haplotypes other than the one indicated.
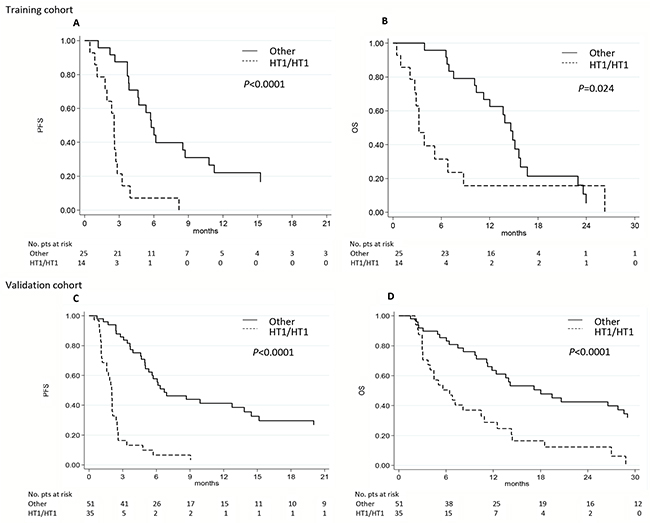
Figure 1: eNOS haplotypes and clinical outcome in the two independent cohorts. A-C. Progression-free survival (PFS) and B-D. overall survival (OS) in relation to eNOS haplotypes (HT) in the training and validation cohorts. Other, haplotypes other than the one indicated.
With regard to OS, only patients homozygous for haplotype HT1 had a lower median OS than those with other haplotypes (3.2 vs.14.6 months, respectively; P = 0.024) (Table 4 and Figure 1B).
Table 4: Univariate analysis of OS according to eNOS polymorphisms in the training and validation cohorts
Training cohort |
Validation cohort |
|||||||
|---|---|---|---|---|---|---|---|---|
No. of Events |
Median OS (95% CI) |
HR (95% CI) |
P |
No. of Events |
Median OS (95% CI) |
HR (95% CI) |
P |
|
Overall |
35 |
11.3 (6.7-14.9) |
- |
- |
62 |
12.4 (8.2-17.2) |
- |
- |
eNOS-786 |
||||||||
TT |
13 |
3.9 (2.1-8.7) |
1.85 (0.91-3.77) |
0.088 |
29 |
6.4 (3.7-10.5) |
3.41 (1.96-5.95) |
<0.0001 |
CC+TC |
22 |
14.6 (10.4-15.8) |
1.00 |
33 |
19.5 (12.4-29.0) |
1.00 |
||
eNOS VNTR |
||||||||
4bb |
22 |
6.9 (3.2-14.9) |
1.21 (0.57-2.59) |
0.621 |
44 |
10.5 (6.4-14.1) |
1.76 (1.00-3.09) |
0.048 |
4ab+4aa |
11 |
14.6 (10.1-15.8) |
1.00 |
18 |
19.5 (8.2-31.5) |
1.00 |
||
eNOS+894 |
||||||||
GG |
13 |
7.5 (3.2-16.7) |
1.38 (0.67-2.84) |
0.387 |
35 |
7.5 (4.9-17.2) |
1.79 (1.07-2.99) |
0.027 |
GT+TT |
22 |
12.8 (6.8-15.6) |
1.00 |
27 |
14.1 (11.2-27.0) |
1.00 |
||
eNOS Haplotypes * (786/VNTR) |
||||||||
HT1/HT1 |
12 |
3.2 (2.1-6.8) |
2.35 (1.12-4.91) |
0.024 |
27 |
6.4 (3.7-10.5) |
3.01 (1.73-5.23) |
<0.0001 |
Other |
21 |
14.6 (10.4-15.8) |
1.00 |
35 |
18.0 (11.3-28.6) |
1.00 |
||
PFS, progression-free survival; OS, overall survival; HR, hazard ratio.
*Haplotypes (HT) 1 shows the allele T at eNOS-786 and allele 4b at eNOS VNTR. “Other” indicates haplotypes other than the one indicated.
Following adjustment for clinical covariates (age, gender, etiology, BCLC stage, serum α-FP level and MELD score), multivariate analysis confirmed eNOS-786 and the specific haplotype of eNOS gene as the only independent prognostic factors predicting PFS (HR 10.24, 95%CI 2.88-36.45, P = 0.0003; HR 9.76, 95%CI 3.19-29.85, P < 0.0001, respectively) and OS (HR 4.98, 95%CI 1.48-16.69, P = 0.009; HR 2.64, 95%CI 1.10-6.34, P = 0.03, respectively) (Table 5). These data remained statistically significant after Bonferroni correction.
Table 5: Multivariate analysis in the training and validation cohorts
Training cohort |
Validation cohort |
|||||||
|---|---|---|---|---|---|---|---|---|
PFS |
OS |
PFS |
OS |
|||||
HR (95% CI) |
P |
HR (95% CI) |
P |
HR (95% CI) |
P |
HR (95% CI) |
P |
|
eNOS-786 |
||||||||
CT+CC |
1.00 |
1.00 |
1.00 |
1.00 |
||||
TT |
10.24 (2.88-36.45) |
0.0003 |
4.98 (1.48-16.69) |
0.009 |
5.87 (1.28-26.99) |
0.023 |
0.56 (0.04-8.29) |
0.677 |
eNOS VNTR |
||||||||
4ab+4aa |
1.00 |
1.00 |
1.00 |
1.00 |
||||
4bb |
0.83 (0.31-2.21) |
0.703 |
0.46 (0.16-1.29) |
0.141 |
3.31 (0.67-16.31) |
0.141 |
7.04 (0.70-70.73) |
0.097 |
eNOS+894 |
||||||||
GT+TT |
1.00 |
1.00 |
1.00 |
1.00 |
||||
GG |
1.16 (0.48-2.79) |
0.741 |
0.59 (0.21-1.64) |
0.309 |
1.48 (0.44-5.04) |
0.528 |
11.95 (1.15-24.12) |
0.038 |
eNOS Haplotypes* |
||||||||
Other |
1.00 |
1.00 |
1.00 |
1.00 |
||||
HT1/HT1 |
9.76 (3.19-29.85) |
<0.0001 |
2.64 (1.10-6.34) |
0.030 |
11.17 (3.71-33.63) |
<0.0001 |
7.03 (1.86-26.55) |
0.004 |
PFS, progression-free survival; OS, overall survival; HR, hazard ratio.
* HT1 shows the allele T at eNOS-786 and allele 4b at eNOS VNTR. “Other” indicates haplotypes other than the one indicated.
eNOS genotypes and clinical outcome in the validation cohort
In univariate analysis, we confirmed that all 3 SNPs were associated with PFS (Table 3 and Supplementary Figure 2A-2C). eNOS-786 TT, eNOS VNTR 4bb and eNOS+894 GG were significantly associated with a lower median PFS (2.0, 2.5 and 2.5 months, respectively) than the other genotypes (6.9, 6.1 and 6.9 months, respectively) (P < 0.0001, P = 0.01 and P = 0.001, respectively). We also confirmed that patients homozygous for HT1 had a lower median PFS than those with other haplotypes (2.0 vs. 6.7 months, P < 0.0001) (Table 3 and Figure 1C). These results remained statistically significant after Bonferroni correction.
With regard to OS, eNOS-786 TT, eNOS VNTR 4bb and eNOS+894 GG genotypes were significantly associated with a lower median OS (6.4, 10.5 and 7.5 months, respectively) than the other genotypes (19.5, 19.5 and 14.1 months, respectively) (P = 0.0001, P = 0.048, P = 0.027, respectively) (Table 4 and Supplementary Figure 2D–2F). We also found that patients homozygous for haplotype HT1 had a lower median OS than those with other haplotypes (6.4 vs.18.0 months, respectively, P < 0.0001) (Table 4 and Figure 1D). This result remained statistically significant after Bonferroni correction.
Following adjustment for clinical covariates (age, gender, etiology, BCLC stage, serum α-FP level and MELD score), multivariate analysis confirmed the eNOS haplotype as the only independent prognostic factor predicting PFS (HR 11.17, 95%CI 3.71-33.63, P < 0.0001) and OS (HR 7.03, 95%CI 1.86-26.55, P = 0.004). These data remained statistically significant after Bonferroni correction (Table 5). Furthermore, no significant associations were observed between eNOS polymorphisms and hypertension, skin toxicity, asthenia, mucositis or diarrhea in the validation cohort (data not shown).
eNOS genotypes and objective response rate (ORR) in the training and validation cohort
eNOS polymorphisms were also investigated in relation to ORR (Supplementary Table 2). In the training cohort, patients carrying a TT genotype for eNOS-786 showed a higher percentage of progression at the first CT re-evaluation than those carrying other genotypes (76.9% vs. 34.8%, respectively) (P = 0.013). These data were confirmed in the validation cohort (55.6% vs. 3.7%, respectively) (P < 0.0001).
In the training cohort, patients carrying homozygous HT1 showed a higher percentage of progression at the first CT re-evaluation than those carrying other haplotypes (76.9% vs. 31.8%, respectively) (P = 0.009). These data were confirmed in the validation group (57.7% vs. 3.7%, respectively) (P < 0.0001). We also observed that patients homozygous for haplotype HT1 in either cohort showed a lower percentage of complete and partial response (0% and 3.8, respectively) than those carrying other haplotypes (18.2% and 18.5%, respectively) at the first CT re-evaluation.
DISCUSSION
Our study of 2 independent cohorts (training and validation) revealed that advanced HCC patients homozygous for a specific eNOS haplotype showed the worst PFS and OS. Few biomarkers predicting drug response are available in clinical practice for many cancer types [28, 29] and as far as we know this is the first study to demonstrate the role of eNOS polymorphisms in relation to clinical outcome in advanced HCC patients receiving sorafenib.
We found that patients homozygous for eNOS haplotype in most cases showed disease progression at the first CT re-evaluation. Moreover, patients with other genotypes associated with a better PFS and OS showed higher response rates.
Several clinical trials have been performed on the combined use of transarterial chemoembolization (TACE) and sorafenib [4, 30–34]. However, these studies did not succeed in their primary aim because patients were not selected on the basis of molecular markers.
The results obtained from our analysis of eNOS polymorphisms suggest that they could identify potential candidates for treatment with combination therapies including TACE-sorafenib and could help to evaluate the efficacy of sorafenib in patients without good liver function (Child-Pugh B).
In the literature, only a few studies have identified possible markers of response to sorafenib in HCC patients. Post-hoc analysis of the SHARP study demonstrated that low baseline plasma concentrations of VEGF-A and angiopoietin-2 were associated with better OS [6, 35], but this has not been confirmed by other authors. Polymorphism analysis seems to have more advantages than protein or gene expression analysis. Gene expression analysis is performed on biological material collected at a specific time in the natural history of the disease. It is also subject to the influence of a number of laboratory biases. Conversely, polymorphism analysis can be performed at any time during the course of the disease, is not substantially influenced by laboratory biases and is less expensive. In this regard, only one study on polymorphisms and response to sorafenib showed that VEGF-A and VEGF-C polymorphisms were independent factors influencing PFS and OS [36].
Previous studies suggested that DNA variants at the eNOS gene can quantitatively control eNOS expression [25, 37]. The point variation at nucleotide-786bp has been associated with a significant reduction in eNOS gene promoter activity, resulting in lower levels of eNOS mRNA, eNOS protein and enzyme activity [24, 37]. With regard to the variable number tandem repeat, the rare allele 4-repeat homozygote shows the highest eNOS mRNA levels, which are, however, associated with lower eNOS protein levels and enzyme activities [24, 37]. It has also been suggested that this polymorphism modulates eNOS expression though the formation of small RNAs (sirRNAs). Endothelial cells containing 5 repeats show higher quantities of sirRNA and lower levels of eNOS mRNA when compared with cells containing 4 repeats [38, 39]. In addition, eNOS+894G>T variation in exon 7 of the eNOS gene, leading to an amino acid change from Glu to Asp (Glu298Asp), is associated with reduced eNOS protein levels, enzyme activities and basal NO production [40, 41]. Moreover, Wang et al. demonstrated that the functional 27-bp repeat at intron 4 coordinates with the eNOS-786 variant and may directly affect transcription efficiency [25].
In our study, TT homozygotes for the eNOS-786 variant, allele 5-repeat homozygotes for eNOS VNTR and GG homozygotes for +894 variant resulted in lower PFS and OS. In agreement with previous studies, these kinds of variants seem to be associated with higher eNOS protein levels and enzyme activities, and consequently with increased basal NO production. We therefore hypothesized an association between high levels of eNOS protein/activity and sorafenib resistance.
With regard to toxicity, we found that patients with hypertension during sorafenib treatment showed better PFS and OS, as previously observed [42, 43]. An increased in blood pressure seems to be closely related to eNOS. The activation of VEGFR-2 also stimulates the production of NO and inhibits endothelin-1 (ET-1), a potent vasoconstrictor [44, 45]. In patients treated with sorafenib, inhibition of VEGFR-2 may reduce NO, resulting in vasoconstriction and hypertension.
The main strength of our multicenter study is that the analyses were performed on two independent cohorts of patients. Moreover, patients in the validation cohort were treated by different specialists (oncologist, gastroenterologist and hepatologist). The study also has a number of limitations, e.g. its retrospective nature (cases were, however, consecutively selected, thus reducing potential bias). Thus, we were only able to collect data on hypertension for the training cohort. In a previous work we found that the early onset of hypertension was associated with improved clinical outcome in HCC patients treated with sorafenib [46]. Given the possible correlation between eNOS polymorphisms and hypertension [27], it would have been interesting to evaluate this in our validation cohort. As our study was carried out on white individuals only, our findings cannot be automatically extrapolated to patients of other ethnicities. Another limitation of our study is the absence of a control arm not receiving sorafenib. Thus, a clear distinction cannot be made between the prognostic and predictive role of eNOS polymorphisms in relation to survival.
In conclusion, the presence of a specific haplotype of eNOS-786 and eNOS VNTR polymorphisms may identify a subset of HCC patients who are more resistant to sorafenib. These data now require confirmation in a prospective study.
MATERIALS AND METHODS
Patients and treatment
This retrospective multicenter Italian study was conducted on a training cohort of 41 HCC patients consecutively treated at Istituto Scientifico Romagnolo per lo Studio e la Cura dei Tumori from 2012 to 2014. A retrospective validation cohort of 87 HCC patients was consecutively recruited by four other participating centers (Faenza Hospital and the Universities of Ancona, Milan and Bari) from 2012 to 2015.
Patients receiving sorafenib with advanced- or intermediate-stage HCC (either histologically proven or diagnosed according to the AASLD [American Association for the Study of Liver Diseases 2005] guidelines) refractory or no longer amenable to locoregional therapies, were eligible for our analysis. Eligibility criteria were the same as those of Llovet’s pivotal study on sorafenib in HCC: [3] Eastern Cooperative Oncology Group (ECOG) performance status score ≤2 ; Child-Pugh liver function class A; adequate hematologic function (platelet count, ≥60×109/L; hemoglobin ≥8.5 g/dL; and prothrombin time international normalized ratio ≤2.3 or prothrombin time ≤6 seconds above control, adequate hepatic function (albumin ≥2.8 g/dL; total bilirubin ≤3 mg/dL [51.3 μmol/L]; alanine aminotransferase and aspartate aminotransferase ≤5 times the upper limit of the normal range); and adequate renal function (serum creatinine ≤1.5 times the upper limit of the normal range).
All patients received sorafenib according to the standard schedule (400 mg bid continuously), dose reductions applied when clinically indicated. Follow-up consisted of a CT/MRI scan every 8 weeks or as clinically indicated. Tumor response was evaluated by modified Response Evaluation Criteria in Solid Tumors (mRECIST) [47]. Treatment with sorafenib was continued until disease progression, unacceptable toxicity or death.
Hypertension was defined as an increase in systolic blood pressure (> 140 mmHg) and/or in diastolic blood pressure (> 90 mmHg) after 15 days’ treatment with sorafenib. The Model For End-Stage Liver Disease (MELD) score cutoff was 10 [48]. The study was approved by the Local Ethics Committees of each center and informed consent was obtained from each patient for their biological material to be used for research purposes.
DNA isolation and genotyping
On the basis of our previous results confirming that eNOS polymorphism analysis is feasible regardless of the starting material used [49], we performed eNOS genotyping using DNA extracted from whole blood or formalin-fixed paraffin-embedded (FFPE) HCC tissue. For peripheral blood samples collected in EDTA tubes, genomic DNA was extracted from 200 μl of whole blood by QIAamp DNA Minikit (Qiagen SPA, Milan, Italy) in accordance with the manufacturer’s instructions. For tissue samples, paraffin wax was removed with xylene and samples were washed twice with 100% ethanol. DNA was isolated from the deparaffinized tissue using the Recover-AllTM Total Nucleic Acid Isolation Kit for FFPE Tissues (Applied Biosystems, Foster City, CA) in accordance with the manufacturer’s instructions. DNA quantity and quality were assessed by Nanodrop 1000 (Celbio, Milan, Italy).
SNPs in the eNOS gene are well documented polymorphisms and were selected after a review of the medical literature. eNOS-786 T>C (rs2070744) is located in 5′ promoter region, eNOS VNTR 27bp 4a/b in intron 4 and eNOS+894G>T (rs1799983) in exon 7. eNOS VNTR 27bp 4a/b in intron 4 has 2 common alleles: “4a” with 4 repeats and “4b” with 5 repeats.
Genotyping analyses of eNOS-786 and eNOS+894 were performed by TaqMan technology using SNP genotyping assays. Polymerase chain reaction (PCR) was performed and genotypes were analyzed on the 7500 Real-Time PCR System (Applied Biosystems) using a 7500 Software version 2.3. PCRs were performed starting from 20 ng of genomic DNA. Conversely, eNOS VNTR was determined by standard PCR and direct sequencing analysis on an ABI 3130 Genetic Analyser (Applied Biosystems). PCR conditions and primer sequences for eNOS VNTR were reported in our previous study [49]. All samples were analyzed at the same institution (Biosciences Laboratory, IRST IRCCS, Meldola, Italy).
Statistical analysis
Hardy-Weinberg equilibrium, linkage disequilibrium and haplotype analyses were performed using the Haploview program version 4.2 [50]. This software provides Lewontin’s disequilibrium coefficient (D’) as the measure of the nonrandom association of alleles at different loci. The D’ coefficient is equal to 1 only if 2 SNPs have not been separated by recombination (or recurrent mutation) during the history of the sample (complete degree of linkage disequilibrium [LD]).
The primary objective of this study was to evaluate the prognostic value of eNOS polymorphisms in relation to clinical outcome (PFS and OS) in a cohort of advanced HCC patients undergoing sorafenib treatment (training cohort). The second objective was to verify whether eNOS polymorphisms are related to objective response. The prognostic value of eNOS polymorphisms in patients with advanced HCC was then confirmed in an independent cohort (validation cohort).
PFS was defined as the time from the first administration of sorafenib until the first report of objective disease progression or death due to any cause, whichever occurred first, or until the date of the last follow-up. OS was defined as the time from the first administration of sorafenib until death due to any cause, or until the date of the last follow-up. Event-time distributions were estimated using the Kaplan-Meier method and survival curves were compared using the log-rank test.
Cox proportional hazard ratios were identified separately for each polymorphism. The significance threshold for an overall type I error rate of 0.05 was set at P < 0.0062 based on a conservative Bonferroni correction for multiple comparison. We subsequently analyzed significant polymorphisms identified in this step using Cox regression analysis adjusting for baseline covariates (age, gender, etiology, Barcelona-Clinic Liver Cancer [BCLC] stage, serum α-FP level and MELD score).
The association between polymorphisms and objective response (OR, defined as complete/partial response vs. stable disease vs. progressive disease) was examined using the Chi-Square test with a significance level of P = 0.05. All statistical analyses were performed using SAS Statistical Software (version 9.3, SAS Institute Inc., Cary, NC). All P values were two-sided.
ACKNOWLEDGMENTS
The authors would like to thank Ursula Elbling for editing the manuscript.
CONFLICTS OF INTEREST
The authors declare no conflicts of interest.
Authors’ contributions
ACG, GM and PU conceived and designed the study. ACG, GM, PU, LF, MS, FGF, MI, GL, JC, MV, FF, CdC and LMN collected and assembled the study data. ACG, GM, PU, ES, ST, SC, DA, ON and GLF analyzed and interpreted the data. All authors contributed to the drafting and revision of the manuscript and approved the final version.
Abbreviations
HCC, hepatocellular carcinoma; eNOS, endothelial nitric oxide synthase; NO, nitric oxide; SNP, single nucleotide polymorphism; VNTR, variable number tandem repeat; PFS, progression free survival; OS, overall survival; ePHAS, eNOS polymorphisms in HCC and sorafenib
REFERENCES
1. Faloppi L, Scartozzi M, Maccaroni E, Di Pietro Paolo M, Berardi R, Del Prete M, Cascinu S. Evolving strategies for the treatment of hepatocellular carcinoma: from clinical-guided to molecularly-tailored therapeutic options. Cancer Treat Rev. 2011; 37: 169-177.
2. Kane RC, Farrell AT, Madabushi R, Booth B, Chattopadhyay S, Sridhara R, Justice R, Pazdur R. Sorafenib for the treatment of unresectable hepatocellular carcinoma. Oncologist. 2009; 14: 95-100.
3. Llovet JM, Ricci S, Mazzaferro V, Hilgard P, Gane E, Blanc JF, de Oliveira AC, Santoro A, Raoul JL, Forner A, Schwartz M, Porta C, Zeuzem S, et al. Sorafenib in advanced hepatocellular carcinoma. New Engl J Med. 2008; 359: 378-390.
4. Cheng AL, Kang YK, Chen Z, Tsao CJ, Qin S, Kim JS, Luo R, Feng J, Ye S, Yang TS, Xu J, Sun Y, Liang H, et al. Efficacy and safety of sorafenib in patients in the Asia-Pacific region with advanced hepatocellular carcinoma: a phase III randomised, double-blind, placebo-controlled trial. Lancet.Oncol. 2009; 10: 25-34.
5. Shao YY, Hsu CH, Cheng AL. Predictive Biomarkers of antiangiogenic therapy for advanced hepatocellular carcinoma: where are we? Liver Cancer. 2013; 2: 93-107.
6. Llovet JM, Pena CE, Lathia CD, Shan M, Meinhardt G, Bruix J, SHARP Investigators Study Group. Plasma biomarkers as predictors of outcome in patients with advanced hepatocellular carcinoma. Clin Cancer Res. 2012; 18: 2290-2300.
7. Casadei Gardini A, Marisi G, Scarpi E, Scartozzi M, Faloppi L, Silvestris N, Masi G, Vivaldi C, Brunetti O, Tamberi S, Foschi FG, Tamburini E, Tenti E, et al. Effects of metformin on clinical outcome in diabetic patients with advanced HCC receiving sorafenib. Expert Opin Pharmacother. 2015: 1-7.
8. Fulton D, Gratton JP, McCabe TJ, Fontana J, Fujio Y, Walsh K, Franke TF, Papapetropoulos A, Sessa WC. Regulation of endothelium-derived nitric oxide production by the protein kinase Akt. Nature. 1999; 399: 597-601.
9. Govers R, Rabelink TJ. Cellular regulation of endothelial nitric oxide synthase. Am J Physiol Renal Physiol. 2001; 280: F193-206.
10. Wilhelm SM, Adnane L, Newell P, Villanueva A, Llovet JM, Lynch M. Preclinical overview of sorafenib, a multikinase inhibitor that targets both Raf and VEGF and PDGF receptor tyrosine kinase signaling. Mol Cancer Ther. 2008; 7: 3129-3140.
11. Fukumura D, Gohongi T, Kadambi A, Izumi Y, Ang J, Yun CO, Buerk DG, Huang PL, Jain RK. Predominant role of endothelial nitric oxide synthase in vascular endothelial growth factor-induced angiogenesis and vascular permeability. Proc Natl Acad Sci USA. 2001; 98: 2604-2609.
12. Cannon RO, 3rd. Role of nitric oxide in cardiovascular disease: focus on the endothelium. Clin Chem. 1998; 44: 1809-1819.
13. Naseem KM. The role of nitric oxide in cardiovascular diseases. Mol Aspects Med. 2005; 26: 33-65.
14. Ziche M, Morbidelli L. Molecular regulation of tumour angiogenesis by nitric oxide. Eur Cytokine Netw. 2009; 20: 164-170.
15. Nakayama M, Yasue H, Yoshimura M, Shimasaki Y, Kugiyama K, Ogawa H, Motoyama T, Saito Y, Ogawa Y, Miyamoto Y, Nakao K. T-786—>C mutation in the 5'-flanking region of the endothelial nitric oxide synthase gene is associated with coronary spasm. Circulation. 1999; 99: 2864-2870.
16. Wang XL, Mahaney MC, Sim AS, Wang J, Wang J, Blangero J, Almasy L, Badenhop RB, Wilcken DE. Genetic contribution of the endothelial constitutive nitric oxide synthase gene to plasma nitric oxide levels. Arterioscler Thromb Vasc Biol. 1997; 17: 3147-3153.
17. Sim AS, Wang J, Wilcken D, Wang XL. MspI polymorphism in the promoter of the human endothelial constitutive NO synthase gene in Australian Caucasian population. Mol Genet Metab. 1998; 65: 62.
18. Wang XL, Wang J. Endothelial nitric oxide synthase gene sequence variations and vascular disease. Mol Genet Metab. 2000; 70: 241-251.
19. Haque S, Mandal RK, Akhter N, Panda AK, Hussain A, Khan S, Lohani M. G894T and 4a/b polymorphisms of NOS3 gene are not associated with cancer risk: a meta-analysis. APJCP. 2015; 16: 2929-2937.
20. Zhang L, Chen LM, Wang MN, Chen XJ, Li N, Huang YD, Chen M. The G894t, T-786c and 4b/a polymorphisms in Enos gene and cancer risk: a meta-analysis. J Evid Based Med. 2014; 7: 263-269.
21. Zhao C, Yan W, Zu X, Chen M, Liu L, Zhao S, Liu H, Hu X, Luo R, Xia Y, Qi L. Association between endothelial nitric oxide synthase 894G>T polymorphism and prostate cancer risk: a meta-analysis of literature studies. Tumour Biol. 2014; 35: 11727-11733.
22. Hingorani AD, Liang CF, Fatibene J, Lyon A, Monteith S, Parsons A, Haydock S, Hopper RV, Stephens NG, O'Shaughnessy KM, Brown MJ. A common variant of the endothelial nitric oxide synthase (Glu298—>Asp) is a major risk factor for coronary artery disease in the UK. Circulation. 1999; 100: 1515-1520.
23. Yoshimura M, Yasue H, Nakayama M, Shimasaki Y, Ogawa H, Kugiyama K, Saito Y, Miyamoto Y, Ogawa Y, Kaneshige T, Hiramatsu H, Yoshioka T, Kamitani S, et al. Genetic risk factors for coronary artery spasm: significance of endothelial nitric oxide synthase gene T-786—>C and missense Glu298Asp variants. J Investig Med. 2000; 48: 367-374.
24. Dosenko VE, Zagoriy VY, Haytovich NV, Gordok OA, Moibenko AA. Allelic polymorphism of endothelial NO-synthase gene and its functional manifestations. Acta Biochim Pol. 2006; 53: 299-302.
25. Wang J, Dudley D, Wang XL. Haplotype-specific effects on endothelial NO synthase promoter efficiency: modifiable by cigarette smoking. Arterioscler Thromb Vasc Biol. 2002; 22: e1-4.
26. Casas JP, Bautista LE, Humphries SE, Hingorani AD. Endothelial nitric oxide synthase genotype and ischemic heart disease: meta-analysis of 26 studies involving 23028 subjects. Circulation. 2004; 109: 1359-1365.
27. Eechoute K, van der Veldt AA, Oosting S, Kappers MH, Wessels JA, Gelderblom H, Guchelaar HJ, Reyners AK, van Herpen CM, Haanen JB, Mathijssen RH, Boven E. Polymorphisms in endothelial nitric oxide synthase (eNOS) and vascular endothelial growth factor (VEGF) predict sunitinib-induced hypertension. Clin Pharmacol Ther. 2012; 92: 503-510.
28. Van Cutsem E, Lenz HJ, Kohne CH, Heinemann V, Tejpar S, Melezinek I, Beier F, Stroh C, Rougier P, van Krieken JH, Ciardiello F. Fluorouracil, leucovorin, and irinotecan plus cetuximab treatment and RAS mutations in colorectal cancer. J Clin Oncol. 2015; 33: 692-700.
29. Bang YJ, Van Cutsem E, Feyereislova A, Chung HC, Shen L, Sawaki A, Lordick F, Ohtsu A, Omuro Y, Satoh T, Aprile G, Kulikov E, Hill J, et al. Trastuzumab in combination with chemotherapy versus chemotherapy alone for treatment of HER2-positive advanced gastric or gastro-oesophageal junction cancer (ToGA): a phase 3, open-label, randomised controlled trial. Lancet. 2010; 376: 687-697.
30. Lee S, Kim BK, Kim SU, Park Y, Chang S, Park JY, Kim do Y, Ahn SH, Chon CY, Han KH. Efficacy of sorafenib monotherapy versus sorafenib-based loco-regional treatments in advanced hepatocellular carcinoma. PloS one. 2013; 8: e77240.
31. Pawlik TM, Reyes DK, Cosgrove D, Kamel IR, Bhagat N, Geschwind JF. Phase II trial of sorafenib combined with concurrent transarterial chemoembolization with drug-eluting beads for hepatocellular carcinoma. J Clin Oncol. 2011; 29: 3960-3967.
32. Zhao Y, Wang WJ, Guan S, Li HL, Xu RC, Wu JB, Liu JS, Li HP, Bai W, Yin ZX, Fan DM, Zhang ZL, Han GH. Sorafenib combined with transarterial chemoembolization for the treatment of advanced hepatocellular carcinoma: a large-scale multicenter study of 222 patients. Ann Oncol. 2013; 24: 1786-1792.
33. Kudo M, Imanaka K, Chida N, Nakachi K, Tak WY, Takayama T, Yoon JH, Hori T, Kumada H, Hayashi N, Kaneko S, Tsubouchi H, Suh DJ, et al. Phase III study of sorafenib after transarterial chemoembolisation in Japanese and Korean patients with unresectable hepatocellular carcinoma. Eur J Cancer. 2011; 47: 2117-2127.
34. Sansonno D, Lauletta G, Russi S, Conteduca V, Sansonno L, Dammacco F. Transarterial chemoembolization plus sorafenib: a sequential therapeutic scheme for HCV-related intermediate-stage hepatocellular carcinoma: a randomized clinical trial. Oncologist. 2012; 17: 359-366.
35. Miyahara K, Nouso K, Tomoda T, Kobayashi S, Hagihara H, Kuwaki K, Toshimori J, Onishi H, Ikeda F, Miyake Y, Nakamura S, Shiraha H, Takaki A, et al. Predicting the treatment effect of sorafenib using serum angiogenesis markers in patients with hepatocellular carcinoma. J Gastroenterol Hepatol. 2011; 26: 1604-1611.
36. Scartozzi M, Faloppi L, Svegliati Baroni G, Loretelli C, Piscaglia F, Iavarone M, Toniutto P, Fava G, De Minicis S, Mandolesi A, Bianconi M, Giampieri R, Granito A, et al. VEGF and VEGFR genotyping in the prediction of clinical outcome for HCC patients receiving sorafenib: The ALICE-1 study. Int J Cancer. 2014; 135:1247-1256.
37. Senthil D, Raveendran M, Shen YH, Utama B, Dudley D, Wang J, Wang XL. Genotype-dependent expression of endothelial nitric oxide synthase (eNOS) and its regulatory proteins in cultured endothelial cells. DNA Cell Biol. 2005; 24: 218-224.
38. Lu J, Wei Q, Bondy ML, Yu TK, Li D, Brewster A, Shete S, Sahin A, Meric-Bernstam F, Wang LE. Promoter polymorphism (-786t>C) in the endothelial nitric oxide synthase gene is associated with risk of sporadic breast cancer in non-Hispanic white women age younger than 55 years. Cancer. 2006; 107: 2245-2253.
39. Silva PS, Lacchini R, Gomes Vde A, Tanus-Santos JE. Pharmacogenetic implications of the eNOS polymorphisms for cardiovascular action drugs. Arq Bras Cardiol. 2011; 96: e27-34.
40. Tesauro M, Thompson WC, Rogliani P, Qi L, Chaudhary PP, Moss J. Intracellular processing of endothelial nitric oxide synthase isoforms associated with differences in severity of cardiopulmonary diseases: cleavage of proteins with aspartate vs. glutamate at position 298. Proc Natl Acad Sci USA.2000; 97: 2832-2835.
41. Veldman BA, Spiering W, Doevendans PA, Vervoort G, Kroon AA, de Leeuw PW, Smits P. The Glu298Asp polymorphism of the NOS 3 gene as a determinant of the baseline production of nitric oxide. J Hypertens. 2002; 20: 2023-2027.
42. Estfan B, Byrne M, Kim R. Sorafenib in advanced hepatocellular carcinoma: hypertension as a potential surrogate marker for efficacy. Am J Clin Oncol. 2013; 36: 319-324.
43. Akutsu N, Sasaki S, Takagi H, Motoya M, Shitani M, Igarashi M, Hirayama D, Wakasugi H, Yamamoto H, Kaneto H, Yonezawa K, Yawata A, Adachi T, et al. Development of hypertension within 2 weeks of initiation of sorafenib for advanced hepatocellular carcinoma is a predictor of efficacy. Int J Clin Oncol. 2015; 20: 105-110.
44. Merkus D, Sorop O, Houweling B, Boomsma F, van den Meiracker AH, Duncker DJ. NO and prostanoids blunt endothelin-mediated coronary vasoconstrictor influence in exercising swine. Am J Physiol Heart Circ Physiol. 2006; 291: H2075-81.
45. Wiley KE, Davenport AP. Physiological antagonism of endothelin-1 in human conductance and resistance coronary artery. Br J Pharmacol. 2001; 133: 568-574.
46. Casadei Gardini A, Scarpi E, Marisi G, Foschi FG, Donati G, Giampalma E, Faloppi L, Scartozzi M, Silvestris N, Bisulli M, Corbelli J, Gardini A, La Barba G, et al. Early onset of hypertension and serum electrolyte changes as potential predictive factors of activity in advanced HCC patients treated with sorafenib: results from a retrospective analysis of the HCC-AVR group. Oncotarget. 2016; 7: 15243-15251. doi: 10.18632/oncotarget.7444.
47. Lencioni R, Llovet JM. Modified RECIST (mRECIST) assessment for hepatocellular carcinoma. Semin Liver Dis. 2010; 30: 52-60.
48. Cucchetti A, Piscaglia F, Caturelli E, Benvegnu L, Vivarelli M, Ercolani G, Cescon M, Ravaioli M, Grazi GL, Bolondi L, Pinna AD. Comparison of recurrence of hepatocellular carcinoma after resection in patients with cirrhosis to its occurrence in a surveilled cirrhotic population. Ann Surg Oncol. 2009; 16: 413-422.
49. Marisi G, Passardi A, Calistri D, Zoli W, Amadori D, Ulivi P. Discrepancies between VEGF -1154 G>A polymorphism analysis performed in peripheral blood samples and FFPE tissue. Int J Mol Sci. 2014; 15: 13333-13343.
50. Barrett JC, Fry B, Maller J, Daly MJ. Haploview: analysis and visualization of LD and haplotype maps. Bioinformatics. 2005; 21: 263-265.