
INTRODUCTION
Glioblastoma remains one of the deadliest of human cancers [1]. Large-scale genomic analyses of clinical glioblastoma samples have identified at least five subtypes, each with distinct biologic and clinical behaviors [2-5]. These subtypes include classical, mesenchymal, neural, proneural, and the glioma-CpG island methylator phenotype (G-CIMP). Intriguingly, in Genetically Modified Murine Model (GEMM) of glioblastoma, the same set of cancer causing mutations can give rise to multiple glioblastoma subtype [6]. It remains unclear whether these molecular differences arise as a result of distinct cells of origin, epigenetic landscape, or microenvironment.
The sub-ventricular zone (SVZ), which lies adjacent to the lateral wall of the lateral ventricle, is a site where neural stem cells (NSC) and astrocyte precursors are located in the adult brain [7-9]. During neural development, NSCs migrate radially and differentiate into various progenitor cells during this process [10-12]. NSCs and progenitor cells are, thus, located at varying distance from the SVZ. The available data suggest that mutations occurring in these cell populations may give rise to glioblastomas [13, 14]. If the cell of origin contributes toward subtype-specific pathogenesis, then one would expect clustering of select subtypes with respect to distance from the SVZ. Here we tested this hypothesis.
Using Iterative Probabilistic Voxel Labeling (IPVL) [15], a method of automatic tumor segmentation developed by our laboratory, and imaging data obtained through The Cancer Imaging Archive (TCIA), we quantitatively determined the geographic distribution for each of the molecular glioblastoma subtypes and quantified each tumor’s distance to the SVZ. Our analysis indicates that the proneural and neural glioblastoma subtypes are located in close proximity to SVZ. In a GFAP-CreER; PtenloxP/loxP; Trp53loxP/loxP; Rb1loxP/loxP; Rbl1-/- Genetically Modified Murine Model (GEMM) of glioblastoma where tumor can spontaneously arise in different regions of the cerebrum [16], glioblastoma that arose near the SVZ were more likely to be of proneural subtype. These findings provide clinical evidence that subtype biology may be related to differing cells of origin.
RESULTS
Glioblastoma density map
The workflow for CE segmentation and CE centroid placement is described in Methods and shown in Figure 1. Information regarding patient demographics, patient survival, and tumor CE volumes for each patient are available in Table 1. The filled CE volume from all subjects are layered and generated in template space yielding a glioblastoma density map and shown as Figure 2. The centroid of CE volume for each patient was similarly layered to create a density map, which confirmed the same distribution (Supplemental Figure 1). Glioblastoma tumor densities are enriched around the SVZ. 25.7% of all CE volume probabilities were found within 10 mm of the ventricular volume, a region representing only 12.6% percent of the total brain volume. This finding is largely consistent with two previous publications [17, 18].
Table 1: Demographic data
Variable |
All |
G-CIMP+ Proneural |
G-CIMP- Proneural |
Neural |
Classical |
Mesenchymal |
Unknown |
N (%) |
217 (100) |
10 (4.6) |
46 (21.2) |
39 (18.0) |
51 (23.5) |
57 (26.3) |
14 (6.5) |
Male, No. (%) |
128 (59.8) |
6 (66.7) |
25 (55.6) |
25 (64.1) |
23 (45.1) |
39 (68.4) |
10 (76.9) |
Female, No. (%) |
86 (40.2) |
3 (33.3) |
20 (44.4) |
14 (35.9) |
28 (54.9) |
18 (31.6) |
3 (23.1) |
Age, y, mean ± SD |
59.3 ± 14.1 |
41.5 ± 15.4 |
57.9 ± 15.1 |
62.0 ± 13.3 |
61.2 ± 15.0 |
60.7 ± 11.2 |
56.6 ± 12.0 |
KPS, mean ± SD |
77.9 ± 14.1 |
86.7 ± 10.0 |
76.6 ± 9.9 |
78.2 ± 19.3 |
75.0 ± 14.3 |
79.6 ± 13.4 |
75.5 ± 16.3 |
OS, d, mean ± SD |
405.8 ± 336.0 |
680.8 ± 287.1 |
320.4 ± 343.2 |
427.8 ± 300.9 |
433.6 ± 291.8 |
429.0 ± 388.2 |
197.0 ± 159.5 |
PFS, d, mean ± SD |
261.2 ± 271.8 |
441.6 ± 593.0 |
241.9 ± 315.9 |
255.2 ± 189.2 |
241.0 ± 169.2 |
294.1 ± 308.3 |
151.5 ± 118.2 |
CE volume, mean ± SD |
34977 ± 33406 |
26809 ± 12454 |
29015 ± 18364 |
40504 ± 37324 |
32496 ± 20217 |
39371 ± 49242 |
35146 ± 25987 |
CE: contrast enhancing; SD: standard deviation
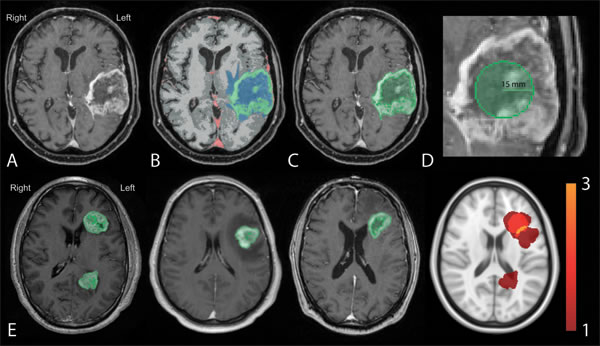
Figure 1: Workflow for generation of total CE and centroid density maps. Preprocessed images A. were registered to the Montreal Neurological Institute (MNI) template and segmented according to the IPVL pipeline B. CE volumes were filled C. and centroid of each were calculated D. E. Filled CE volumes from each subject (first three panels) were summed (right most panel) and then converted to tumor density map.
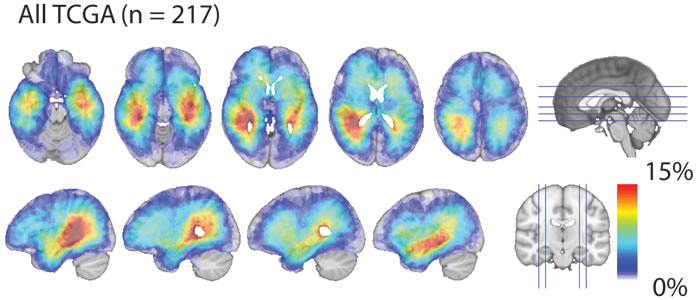
Figure 2: Glioblastoma density map. Total CE probability map revealed that glioblastoma, as a whole, exhibit a strong predilection occurrence in proximity to the SVZ. Red indicates the highest frequency of overlap and light-blue indicating the lowest frequency of overlap.
Glioblastoma subtype specific density maps
We next generated CE density maps for each glioblastoma subtype. We observed that proneural and neural tumors tend to occur in the temporal and frontal lobe. Both of these subtypes demonstrated a predilection towards asymmetry, having higher densities in the left temporal region relative to the right (Figure 3A). In contrast, the classical and mesenchymal subtypes were more diffusely distributed in the cerebrum, with significantly lower probabilities of overlap (p < 0.001) (Figure 3A). The classical subtype had higher probability densities within the periventricular white matter adjacent to the right atrium. Statistical comparisons between the probability density maps for all subtypes using voxel-wise Fisher’s exact testing (see Methods) confirmed the distributions described above demonstrating regions that are highly specific for each subtype. The statistically significant regions associated with each subtype are demonstrated by Figure 3B. The limited number of G-CIMP glioblastomas (n = 11) did not exhibit specific geographic association to any particular regions of the cerebrum.
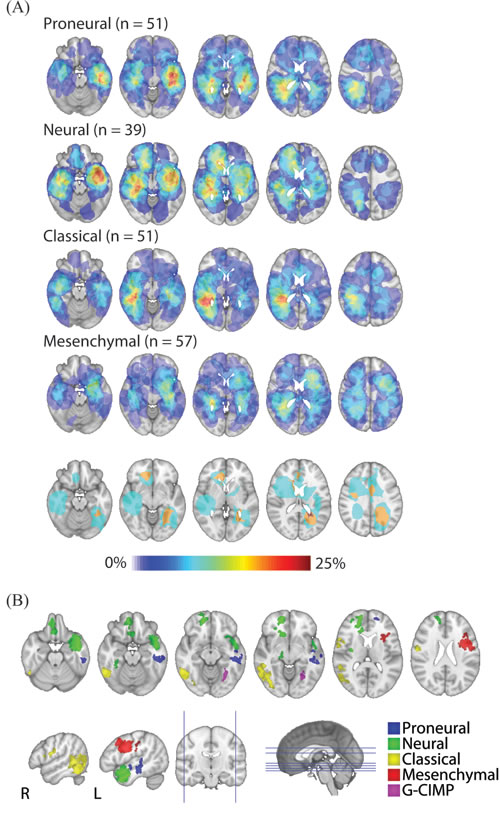
Figure 3: Glioblastoma subtype density maps and regions of statistically significant subtype localization. A. Subtype-specific density maps were generated using total CE volume. Red indicates the highest frequency of overlap and light-blue indicating the lowest frequency of overlap. Proneural and neural tumors tend to occur in the temporal and frontal lobe, having higher densities in the left temporal region relative to the right. In contrast, the classical and mesenchymal subtypes were more diffusely distributed in the cerebrum, with significantly lower probabilities of overlap (p < 0.001). B. Axial (first row) and sagittal (second row) of statistically significant clusters (p < 0.05) by subtype. Statistical comparisons were carried out using voxel-wise Fisher’s exact tests.
Glioblastoma subtypes and SVZ distance
To study the anatomic relation of glioblastoma subtype to the SVZ, we developed a quantitative measure of SVZ distance (See Methods). An illustrative example of the SVZ distance measure is demonstrated in Figure 4A. Applying this measure to our dataset, we found that proneural and neural subtypes were located in closer proximity to the SVZ relative to the mesenchymal and classical subtypes (p = 0.035) (Figure 4B). Since clinical studies of glioblastoma growth based on serial MRI images suggest that the center of tumor mass approximates the site of tumor origin [19], our results suggest that glioblastoma subtypes arise in distinct regions of the cerebrum.
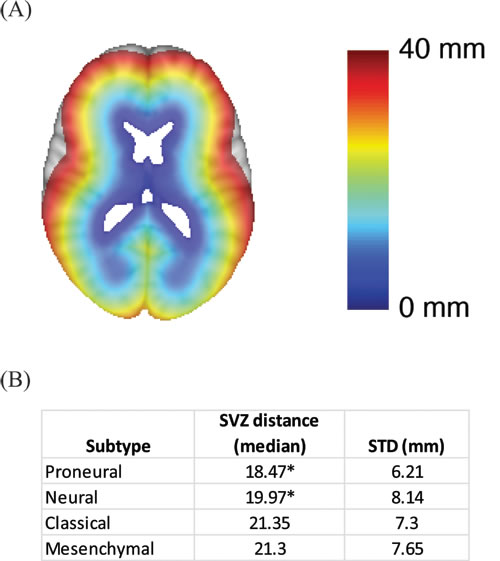
Figure 4: Association between SVZ distance and glioblastoma subtype. A. Graphical illustration of the SVZ distance measurement. SVZ distance is color coded so that blue indicates shorter SVZ distances while red indicates high SVZ distances. B. Median SVZ distances for the glioblastoma subtypes. * indicates statistical significance based on student’s t-test when comparing the SVZ distance of the proneural subtype to those of the classical or the mesenchymal subtype. The same comparisons were performed for the neural subtype.
To confirm our clinical finding, we tested the distribution of glioblastoma subtypes in a GFAP-CreER; PtenloxP/loxP; Trp53loxP/loxP; Rb1loxP/loxP; Rbl1-/- GEMM model where glioblastoma can arise anywhere in the cerebrum [16]. The brains of the mice were sectioned in their entirety and examined for the presence of early glioblastomas, in particular recording their location. For this study, we focused on tumors located in the cortex (external to the corpus callosum and external capsule) and those in close proximity to or extending from the SVZ (including the overlying corpus callosum, rostral migratory stream and olfactory bulb). We characterized Olig2 staining intensity, an established biomarker for proneural glioblastoma [2, 20-22], for each tumor (Figure 5A). The glioblastomas that arose from the GEMM showed a wide range of Olig2 staining intensities, which we graded from a scale of 0 to 3+. Nearly all tumors staining of 2+ and 3+ were classified as proneural or neural subtype when mRNA profiling of these tumors were performed [6]. In contrast, tumors staining 0-1 were classified as mesenchymal or classical subtype. Consistent with our analysis of TCIA, the proneurral/neural glioblastomas (2+ and 3+ Olig 2 staining glioblastomas) tend to locate in proximity to the SVZ. In contrast, the mesenchymal or classical glioblastomas (0 and 1+ Olig 2 staining glioblastomas) were more likely located in the cortex, distant from the SVZ (Figure 5B; p < 0.0001). These observations in the GEMM model confirm our clinical observation from human subjects that proneural glioblastomas are more likely to occur in proximity to the SVZ.
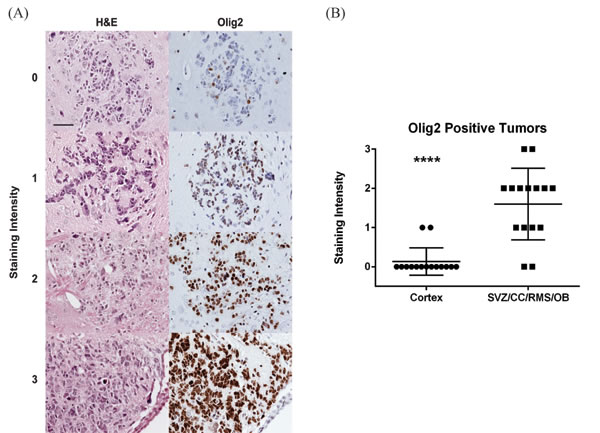
Figure 5: Analysis of glioblastoma location in a GEMM by subtype. The location and Olig2 staining characteristics of early glioblastomas were examined in GEMM model of glioblastoma [16]. A. Tumors were identified based on H&E staining (left column) and an adjacent slide stained for Olig2 (right column). Representative images demonstrating Olig2 staining intensity from 0 to 3 are shown. Scale bar in the upper right hand image is 50 µm and applies to all images. B. Olig2 staining of cortical tumors was compared to tumors of the subventricular zone (SVZ), overlying corpus callosum (CC), rostral migratory stream (RMS) and olfactory bulb (OB) in this scatter plot. Lines represent the mean and standard deviation. ****p < 0.0001.
DISCUSSION
Our study provides a quantitative tumor density map of glioblastoma subtypes and demonstrates that these subtypes occupy distinct regions of the brain. Intriguingly, the subtypes exhibit regional associations with regard to the SVZ, an area of critical importance in neurogenesis and glioblastoma pathogenesis. The proneural and neural glioblastomas exhibit anatomic tropism reminiscent of NSCs (in proximity to the SVZ) and show gene expression patterns resembling these cells [2, 22]. In contrast, the classical and mesenchymal glioblastomas exhibit a more diffuse distribution and are found farther from the SVZ - a distribution that is similar to those of neural progenitor cells. We further confirmed that in a GEMM model where glioblastoma can spontaneous arise in distinct regions of the cerebrum, proneural glioblastomas are more likely to arise in proximity to the SVZ. These findings provide clinical evidence that subtype biology may be related to differing cells of origin.
The asymmetric distribution of proneural and neural subtypes presents an unexpected phenomenon. A large body of work has documented asymmetry in cerebral function and activity [23], with inferred asymmetry in terms of anatomic substrate and physiologic circuit [24-26]. It is possible that molecular microenvironment or differential cell-related asymmetry contributes to glioblastoma pathogenesis. For instance, recent studies suggest that many neurotransmitters serve as trophic factors that mediate mitogenic signaling in glioblastomas [27]. Increased utilization of such neurotransmitters [28], or differential levels of adult neurogenesis may effect regional predisposition for glioblastoma pathogenesis. As an alternative explanation, patients with tumors affecting the left temporal lobe may present with symptoms earlier, potentially increasing their likelihood for detection and enrollment in the TCGA.
Amongst the limitations of our study is the assumption that the center of tumor mass approximates the site of tumor origin. This assumption is largely supported by mathematical studies that use imaging to model the growth pattern of glioblastomas [19]. Another challenge encountered during our study involves the deformation of ventricular contour by glioblastoma mass effect. To address this issue, we utilized established methods of registration [27] to MNI atlas to account for such deformations. Finally, while robust statistical analysis is performed in this dataset in a hypothesis-driven manner, further verification of our results is warranted.
In conclusion, the integration of quantitative MR image analysis of 217 TCIA subjects and molecular subtyping of glioblastoma revealed subtype specific brain localization and differed with regard to the SVZ. Quantitative proximity to the SVZ, as determined by our methods, may be an imaging proxy for the underlying glioblastoma biology.
materials and METHODS
Data acquisition and subtype classification
We searched the TCIA for subjects with at least one artifact-free pre-operative T1 weighted MR image with contrast. In total, 217 subjects with pre-surgical resection MR images were downloaded from the TCIA (http://cancerimagingarchive.net) in November 2014. Level 3 probe collapsed Messenger RNA (mRNA) expression data: Affymetrix HT-HG-U133A GeneChip and RNAseq, was downloaded for available patients via the TCGA Data Portal (http://tcga-data.nci.nih.gov/tcga/). Affymetrix expression data were normalized by robust multichip average (RMA). RNAseq data were RSEM normalized. When not already available in published literature, genomic subtypes were determined for subjects employing single sample Gene Set Enrichment Analysis (ssGSEA) as described previously [29, 30]. Additionally, G-CIMP status was determined using methods described previously [3, 30].
Image preprocessing and registration
MR images were corrected for gradient nonlinearity using previously described methods [18, 31]. Images were additionally preprocessed and intensity corrected utilizing N4 bias field correction [32], then registrations were performed to the Montreal Neurological Institute (MNI) 152 1 mm3 template employing methods from Advanced Normalization Tools (ANTS) [27]. Visual inspections were subsequently performed by three independent reviewers (T.C.S, J.M.T, & K.S.P) to ensure accurate preprocessing. Variability in the technical parameters of the images analyzed is described in our previous study [15].
Tumor segmentation and probability maps
Contrasting-enhancing (CE) regions of tumors were segmented using the iterative probabilistic voxel labeling (IPVL) algorithm developed in the laboratory [15] (Figure 1B) and the enclosed volume was filled (See Methods, Figure 1C). Tumor density maps were calculated as the number of observations at each voxel divided by the number of subjects (Figure 1E). Similarly, centroid density maps were generated using the regionprops(matrix,’centroid’); function in MATLAB (The MathWorks, Inc., Natick, Massachusetts, United States.) where a 15-mm sphere placed at the center of mass for each filled CE volume (Figure 1D). Visual inspection by two independent operators (T.C.S, J.M.T) was performed to ensure adequacy of region filling and centroid estimation. Probability distributions were quantitatively compared using a voxel-wise two-tailed Fisher’s exact test [33] comparing the number of tumors observed for each subtype at each voxel. Only significant clusters which had a >5% probability of occurring by chance were kept.
Subventricular zone distance
To measure SVZ distance with respect to each tumor’s filled CE volume, the MNI template’s lateral ventricle segmentation was used as a basis of comparison. Linear transformation of the glioblastoma volume to the MNI template was performed. SVZ distances were calculated by taking the mean of the distance from the nearest MNI template ventricular border to each point within a subject’s CE volume.
GEMM model of glioblastoma
Quadruple conditional knock-out (cKO) mice have been described elsewhere [16]. Briefly, the genotype of the mice used in this study is GFAP-CreER; PtenloxP/loxP; Trp53loxP/loxP; Rb1loxP/loxP; Rbl1-/-. Deletion of conditional alleles was induced in five week old mice by intraperitoneal tamoxifen injections, 9 mg/40 g body weight daily for three days. Six weeks after tamoxifen injections, mice were euthanized by transcardial perfusion with phosphate buffered saline (PBS). The brain was dissected, cut sagittally down the midline and fixed by immersion in 4% paraformaldehyde in PBS for 12 hrs. The tissue was processed for paraffin embedding and 5 µm thin sections prepared. Every fifth slide was stained with hematoxylin and eosin to identify and localize tumors, which were confirmed by immunohistochemical staining for the proliferation marker, Ki67. To characterize the tumor, selected adjacent slides were stained for Olig2 (dilution 1:500; EMD Millipore, Temecula, CA). Staining intensity was graded as absent or weak (0), positive in >50% of tumor cells (1), positive in >90% of tumor cells (2) or strongly positive (3). Average staining intensity in tumors from each location was calculated and significance determined using the two-tailed t-test.
Abbreviations
T1WI with Contrast: T1wCE; Contrast-Enhancing Volume: CEV; FLAIR Hyperintensity Volume: FHV; Subventricular Zone: SVZ; CpG Island Methylator Phenotype: G-CIMP; The Cancer Genome Atlas: TCGA; The Cancer Imaging Archive: TCIA; Repository for Molecular Brain Neoplasia Data: REMBRANDT
CONFLICTs OF INTEREST
The authors declare that there is no conflict of interest.
GRANT SUPPORT
CCC is supported by the Doris Duke Charitable Foundation, Sontag Foundation, Burroughs Wellcome Fund, Forbeck Foundation, and Kimmel Foundation.
REFERENCES
1. Bartek J Jr., Ng K, Bartek J, Fischer W, Carter B and Chen CC. Key concepts in glioblastoma therapy. J Neurol Neurosurg Psychiatry. 2012; 83:753-760.
2. Phillips HS, Kharbanda S, Chen R, Forrest WF, Soriano RH, Wu TD, Misra A, Nigro JM, Colman H, Soroceanu L, Williams PM, Modrusan Z, Feuerstein BG and Aldape K. Molecular subclasses of high-grade glioma predict prognosis, delineate a pattern of disease progression, and resemble stages in neurogenesis. Cancer cell. 2006; 9:157-173.
3. Noushmehr H, Weisenberger DJ, Diefes K, Phillips HS, Pujara K, Berman BP, Pan F, Pelloski CE, Sulman EP, Bhat KP, Verhaak RG, Hoadley KA, Hayes DN, Perou CM, Schmidt HK, Ding L, et al. Identification of a CpG island methylator phenotype that defines a distinct subgroup of glioma. Cancer cell. 2010; 17:510-522.
4. Li J, Taich ZJ, Goyal A, Gonda D, Akers J, Adhikari B, Patel K, Vandenberg S, Yan W, Bao Z, Carter BS, Wang R, Mao Y, Jiang T and Chen CC. Epigenetic suppression of EGFR signaling in G-CIMP+ glioblastomas. Oncotarget. 2014; 5:7342-7356. doi: 10.18632/oncotarget.2350.
5. Ng K, Kim R, Kesari S, Carter B and Chen CC. Genomic profiling of glioblastoma: convergence of fundamental biologic tenets and novel insights. J Neurooncol. 2012; 107:1-12.
6. Chow LM, Endersby R, Zhu X, Rankin S, Qu C, Zhang J, Broniscer A, Ellison DW and Baker SJ. Cooperativity within and among Pten, p53, and Rb pathways induces high-grade astrocytoma in adult brain. Cancer cell. 2011; 19:305-316.
7. Sanai N, Nguyen T, Ihrie RA, Mirzadeh Z, Tsai HH, Wong M, Gupta N, Berger MS, Huang E, Garcia-Verdugo JM, Rowitch DH and Alvarez-Buylla A. Corridors of migrating neurons in the human brain and their decline during infancy. Nature. 2011; 478:382-386.
8. Eriksson PS, Perfilieva E, Bjork-Eriksson T, Alborn AM, Nordborg C, Peterson DA and Gage FH. Neurogenesis in the adult human hippocampus. Nature medicine. 1998; 4:1313-1317.
9. Quinones-Hinojosa A, Sanai N, Gonzalez-Perez O and Garcia-Verdugo JM. The human brain subventricular zone: stem cells in this niche and its organization. Neurosurgery clinics of North America. 2007; 18:15-20, vii.
10. Sakaguchi M and Okano H. Neural stem cells, adult neurogenesis, and galectin-1: from bench to bedside. Developmental neurobiology. 2012; 72:1059-1067.
11. Taupin P and Gage FH. Adult neurogenesis and neural stem cells of the central nervous system in mammals. Journal of neuroscience research. 2002; 69:745-749.
12. Rakic P. Principles of neural cell migration. Experientia. 1990; 46:882-891.
13. Sanai N, Alvarez-Buylla A and Berger MS. Neural stem cells and the origin of gliomas. The New England journal of medicine. 2005; 353:811-822.
14. Lim DA, Cha S, Mayo MC, Chen MH, Keles E, VandenBerg S and Berger MS. Relationship of glioblastoma multiforme to neural stem cell regions predicts invasive and multifocal tumor phenotype. Neuro-oncology. 2007; 9:424-429.
15. Steed TC, Treiber JM, Patel KS, Taich Z, White NS, Treiber ML, Farid N, Carter BS, Dale AM and Chen CC. Iterative Probabilistic Voxel Labeling: Automated Segmentation for Analysis of The Cancer Imaging Archive Glioblastoma Images. American journal of neuroradiology. 2015; 36:678-85. doi: 10.3174/ajnr.A4171.
16. Wojton J, Chu Z, Mathsyaraja H, Meisen WH, Denton N, Kwon CH, Chow LM, Palascak M, Franco R, Bourdeau T, Thornton S, Ostrowski MC, Kaur B and Qi X. Systemic delivery of SapC-DOPS has antiangiogenic and antitumor effects against glioblastoma. Mol Ther. 2013; 21:1517-1525.
17. Ellingson BM, Lai A, Harris RJ, Selfridge JM, Yong WH, Das K, Pope WB, Nghiemphu PL, Vinters HV, Liau LM, Mischel PS and Cloughesy TF. Probabilistic radiographic atlas of glioblastoma phenotypes. AJNR American journal of neuroradiology. 2013; 34:533-540.
18. Gooya A, Pohl KM, Bilello M, Cirillo L, Biros G, Melhem ER and Davatzikos C. GLISTR: glioma image segmentation and registration. IEEE Trans Med Imaging. 2012; 31:1941-1954.
19. Swanson KR, Bridge C, Murray JD and Alvord EC Jr. Virtual and real brain tumors: using mathematical modeling to quantify glioma growth and invasion. Journal of the neurological sciences. 2003; 216:1-10.
20. Bhat KP, Balasubramaniyan V, Vaillant B, Ezhilarasan R, Hummelink K, Hollingsworth F, Wani K, Heathcock L, James JD, Goodman LD, Conroy S, Long L, Lelic N, Wang S, Gumin J, Raj D, et al. Mesenchymal differentiation mediated by NF-kappaB promotes radiation resistance in glioblastoma. Cancer cell. 2013; 24:331-346.
21. Joo KM, Kim J, Jin J, Kim M, Seol HJ, Muradov J, Yang H, Choi YL, Park WY, Kong DS, Lee JI, Ko YH, Woo HG, Lee J, Kim S and Nam DH. Patient-specific orthotopic glioblastoma xenograft models recapitulate the histopathology and biology of human glioblastomas in situ. Cell Rep. 2013; 3:260-273.
22. Verhaak RG, Hoadley KA, Purdom E, Wang V, Qi Y, Wilkerson MD, Miller CR, Ding L, Golub T, Mesirov JP, Alexe G, Lawrence M, O’Kelly M, Tamayo P, Weir BA, Gabriel S, et al. Integrated genomic analysis identifies clinically relevant subtypes of glioblastoma characterized by abnormalities in PDGFRA, IDH1, EGFR, and NF1. Cancer cell. 2010; 17:98-110.
23. Hugdahl K. Signs of cognitive decline in the elderly population. The journal of nutrition, health & aging. 2010; 14:750.
24. Toga AW and Thompson PM. Mapping brain asymmetry. Nature reviews Neuroscience. 2003; 4:37-48.
25. Sun T, Patoine C, Abu-Khalil A, Visvader J, Sum E, Cherry TJ, Orkin SH, Geschwind DH and Walsh CA. Early asymmetry of gene transcription in embryonic human left and right cerebral cortex. Science. 2005; 308:1794-1798.
26. Sun T and Walsh CA. Molecular approaches to brain asymmetry and handedness. Nature reviews Neuroscience. 2006; 7:655-662.
27. Avants BB, Tustison NJ, Stauffer M, Song G, Wu B and Gee JC. The Insight ToolKit image registration framework. Frontiers in neuroinformatics. 2014; 8:44.
28. Li J, Zhu S, Kozono D, Ng K, Futalan D, Shen Y, Akers JC, Steed T, Kushwaha D, Schlabach M, Carter BS, Kwon CH, Furnari F, Cavenee W, Elledge S and Chen CC. Genome-wide shRNA screen revealed integrated mitogenic signaling between dopamine receptor D2 (DRD2) and epidermal growth factor receptor (EGFR) in glioblastoma. Oncotarget. 2014; 5:882-893. doi:10.18632/oncotarget.1801.
29. Barbie DA, Tamayo P, Boehm JS, Kim SY, Moody SE, Dunn IF, Schinzel AC, Sandy P, Meylan E, Scholl C, Frohling S, Chan EM, Sos ML, Michel K, Mermel C, Silver SJ, et al. Systematic RNA interference reveals that oncogenic KRAS-driven cancers require TBK1. Nature. 2009; 462:108-112.
30. Brennan CW, Verhaak RG, McKenna A, Campos B, Noushmehr H, Salama SR, Zheng S, Chakravarty D, Sanborn JZ, Berman SH, Beroukhim R, Bernard B, Wu CJ, Genovese G, Shmulevich I, Barnholtz-Sloan J, et al. The somatic genomic landscape of glioblastoma. Cell. 2013; 155:462-477.
31. Jovicich J, Czanner S, Greve D, Haley E, van der Kouwe A, Gollub R, Kennedy D, Schmitt F, Brown G, Macfall J, Fischl B and Dale A. Reliability in multi-site structural MRI studies: effects of gradient non-linearity correction on phantom and human data. Neuroimage. 2006; 30:436-443.
32. Tustison NJ, Avants BB, Cook PA, Zheng Y, Egan A, Yushkevich PA and Gee JC. N4ITK: improved N3 bias correction. IEEE Trans Med Imaging. 2010; 29:1310-1320.
33. Ellingson BM, Cloughesy TF, Pope WB, Zaw TM, Phillips H, Lalezari S, Nghiemphu PL, Ibrahim H, Naeini KM, Harris RJ and Lai A. Anatomic localization of O6-methylguanine DNA methyltransferase (MGMT) promoter methylated and unmethylated tumors: a radiographic study in 358 de novo human glioblastomas. Neuroimage. 2012; 59:908-916.