
INTRODUCTION
Formation of the BCR-ABL fusion gene coding for a constitutively active BCR-ABL tyrosine kinase via t(9;22)(q34;q11) reciprocal translocation initiates 95% of chronic myelogenous leukemia (CML), and 25% of adults and 5% of children acute lymphoblastic leukemia (ALL) [1]. Imatinib provides a promising treatment for CML by high selectively binding to the ATP-binding site of BCR-ABL and inhibiting BCR-ABL activation [2]. However, the occurrence of drug resistance was reported in CML patients with advanced stages treated with imatinib [3]. Amplification of the BCR-ABL gene and mutations of the kinase domain of ABL have been described as the molecular mechanisms for the development of imatinib resistance [4-9]. However, overexpression or mutations of BCR-ABL could not explain all drug resistance to imatinib in CML patients, implying that the alternative mechanisms may exist [10-12].
MDR1, the ABCB1 gene product, is an ABC transporter at the cell surface responsible for extruding the compounds out of the cell, and has the potentials of mediating multiple drug resistance (MDR) by reducing intracellular drug concentrations [13]. Previous investigations showed that imatinib is the substrate of MDR1 and considered drug efflux mediated by MDR1 as a causal role for imatinib drug resistance in CML [14, 15]. But the precise mechanisms of MDR1 modulation in chronic myelogenous leukemia cells remain to be unclear. In the current study, we first applied proteomic approach to identify galectin-1 as a candidate of MDR1 modulators for mediating drug resistance in CML cells by comparison of the protein profiles among a model system of leukemia cell lines with a gradual increase of MDR1 expression and drug resistance, and further explored the mechanisms of galectin-1 acting as a novel MDR1 modulator contributing to functional resistance against the cytotoxic drugs.
RESULTS
Characterization of the MDR phenotype in K562, K562/ADM and the revertant K562/ADM cells
Initially, the sensitivity profiles against adriamycin and imatinib were explored in a model system of cell lines including K562, K562/ADM and the revertant K562/ADM cells. As shown in Table 1, the resistant cell line K562/ADM displayed higher resistance against adriamycin and imatinib, with 50-fold and 5-fold increase of IC50 for adriamycin and imatinib respectively, than its sensitive counterpart K562 cells. We observed that the revertant K562/ADM cell line showed less resistance than K562/ADM cell line but higher resistance than K562 cell line against both adriamycin and imatinib, suggesting the resistant cells gradually lose the resistant character when cultured in the absence of the chemical compound.
Table 1: The IC50 of adriamycin and imatinib in K562, K562/ADM and the revertant K562/ADM cells
IC50 |
K562 |
K562/ADM |
revertant K562/ADM |
|---|---|---|---|
ADM(μg/ml) |
0.465±0.04 |
26.56±0.43 |
17.56±0.53 |
imatinib(μM) |
0.2±0.039 |
2.3±0.218 |
1.7±0.12 |
Quantitative PCR (q-PCR) analysis showed that the expression level of MDR1 in the revertant K562/ADM cells is less than the resistant K562/ADM cells, but higher than the sensitive ones, suggesting that the expression level of MDR1 gradually decreases during the course of cultivation in the absence of adriamycin (Figure 1). The results imply that a gradual increase of resistance against adriamycin and imatinib is accompanied by a gradual increase of MDR1 level during the course of development of drug resistance in K562 cells exposed to adriamycin.
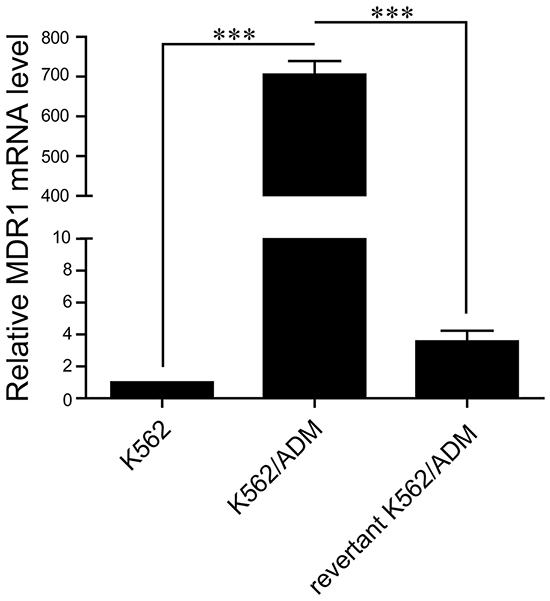
Figure 1: Comparison of MDR1 expressions in three types of K562 cell lines. The mRNA levels of MDR1 in K562, K562/ADM, and the revertant K562/ADM cells were detected by q-PCR. Data are presented as the mean (±SD) of three independent experiments. ***p<0.001.
Identification of galectin-1 as a significantly up-regulated protein in resistant K562 cells by 2D-PAGE and MALDI-TOF-TOF mass spectrometry
In order to elucidate the mechanisms of MDR1 modulation in K562 cells, a proteomic approach was initially applied to identify differentially expressed proteins among three types of K562 cells with different MDR1 expression and potentials of drug resistance. As shown in Figure 2, the well-resolved, reproducible 2D-PAGE patterns of K562 (Figure 2A), K562/ADM (Figure 2B), and the revertant K562/ADM cells (Figure 2C) were established, and yielded about 1000 protein spots each. In total, 11 protein spots were found to be differentially expressed among the investigated cells. All of these were excised and analyzed by MALDI-TOF-TOF mass spectrometry and a subsequent search in the IPI databases for protein identification. The identification information was summarized in Table 2.
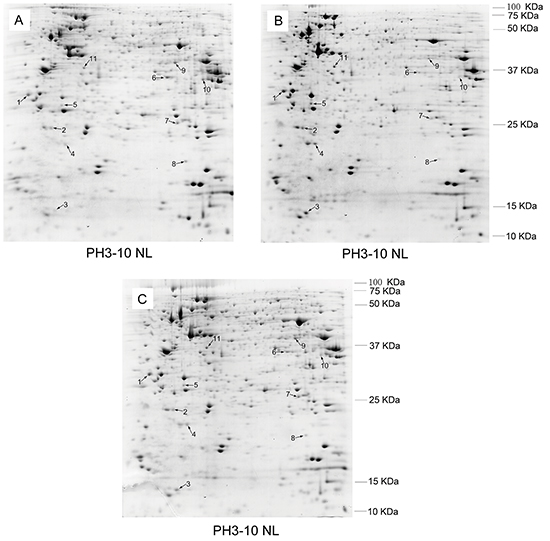
Figure 2: Comparison of the protein expression patterns between K562 A. and the revertant K562/ADM cells B. and the revertant K562/ADM cells C. The proteins were separated by two-dimensional electrophoresis and stained with Coomassie brilliant blue G250. Identified protein spots are indicated by numbers.
Table 2: MALDI-TOF-TOF results of the differentially expressed proteins
Spot No. |
Protein description |
Gene name |
Function |
Accession no. |
Theoretical Mw/pI |
Score |
C.I.% |
Expr. level (K562 vs K562/ADM) |
|---|---|---|---|---|---|---|---|---|
1 |
Complement component 1 Q subcomponent-binding protein |
C1QBP |
Cell apoptosis, proliferation and migration |
IPI00014230 |
31741.8/4.74 |
282 |
100 |
+ |
2 |
Lactoylglutathione lyase |
GLO1 |
Metabolism |
IPI00220766 |
20992.3/5.12 |
523 |
100 |
+ |
3 |
Galectin-1 |
LGALS1 |
Cell apoptosis, proliferation and differentiation |
IPI00219219 |
15048.3/5.34 |
295 |
100 |
+ |
4 |
Sorcin isoform b |
SRI |
Calcium-binding protein |
IPI00414264 |
20616.9/ 5.11 |
150 |
100 |
+ |
5 |
Isoform 2 of Proteasome subunit alpha type-3 |
PSMA3 |
Proteolysis |
IPI00171199 |
27857.8/5.19 |
349 |
100 |
+ |
6 |
Isoform 2 of Heterogeneous nuclear ribonucleoprotein D-like |
HNRPDL |
Cellular transcription |
IPI00845282 |
33739.2/6.85 |
290 |
100 |
- |
7 |
Proteasome subunit alpha type-2 |
PSMA2 |
Proteolysis |
IPI00219622 |
25996.3/6.92 |
259 |
100 |
- |
8 |
Isoform 2 of Transcription factor BTF3 |
BTF3 |
Cellular transcription |
IPI00419473 |
17688.2/6.85 |
185 |
100 |
- |
9 |
Poly(rC)-binding protein 1 |
PCBP1 |
Signal transduction |
IPI00016610 |
37987.1/6.66 |
526 |
100 |
- |
10 |
Isoform A2 Heterogeneous nuclear ribonucleoproteins A2/B1 |
HNRNPA2B1 |
Cellular transcription |
IPI00414696 |
36040.9/8.67 |
714 |
100 |
- |
11 |
Eukaryotic translation initiation factor 3 subunit I |
EIF3I |
Signal transduction |
IPI00012795 |
36478.6/5.38 |
300 |
100 |
+ |
Among the identified differentially expressed proteins, six of them were significantly up-regulated in K562/ADM cells compared with K562 cells, and significantly down-regulated in the revertant K562/ADM cells compared with K562/ADM cells. Whereas, the expression levels of the other five identified proteins in the revertant K562/ADM cells were less than those in K562 cells, and higher than those in K562/ADM cells (Figure 3). The differentially expressed proteins related to cell behaviors, metabolism, calcium-binding, proteolysis, cellular transcription, and signal transduction maybe valuable for further elucidating the chemoresistant mechanisms in CML.
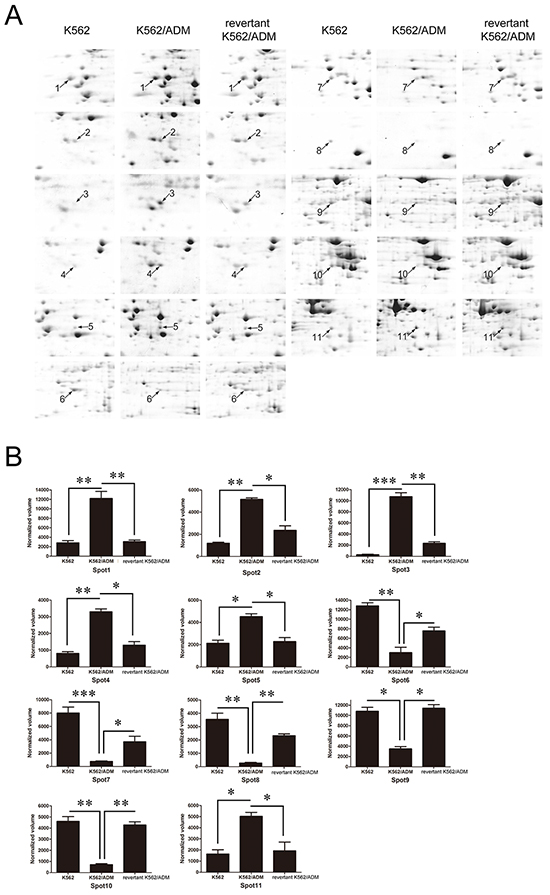
Figure 3: A. Enlarged maps of the protein spots differentially expressed among K562, K562/ADM, and the revertant K562/ADM cells. B. Graphical representation of spot intensities assigned by PDQuest 8.0 software subsequent to normalization. The graphs show the intensities of the protein spots differentially expressed among K562, K562/ADM, and the revertant K562/ADM cells. *p<0.05, **p<0.01, ***p<0.001.
Among the identified proteins, galectin-1 (Gal-1), which exerts effects on cell apoptosis, proliferation and differentiation, increased 4.85 folds in K562/ADM cells compared with the revertant K562/ADM cells, and up-regulated 22.3 folds compared with K562 cells, implying that galectin-1 may contribute to augment of MDR1 expression and drug resistance in CML.
Verification of galectin-1 expression
In order to confirm the trends of the expression levels of galectin-1 identified by the proteomic approach, q-PCR method was first applied to measure the mRNA levels of galectin-1. The results present in Figure 4A indicated that the mRNA level of galectin-1 in K562/ADM was 1.87 folds higher than the revertant K562/ADM cells, and 4.4 folds than K562 cells, respectively. Further western blot analysis revealed a significant up-regulation of galectin-1 expression in K562/ADM cells compared with the other two types of cells with less drug resistance, which were paralleled to the protein level changes observed in the proteomic analysis (Figure 4B).
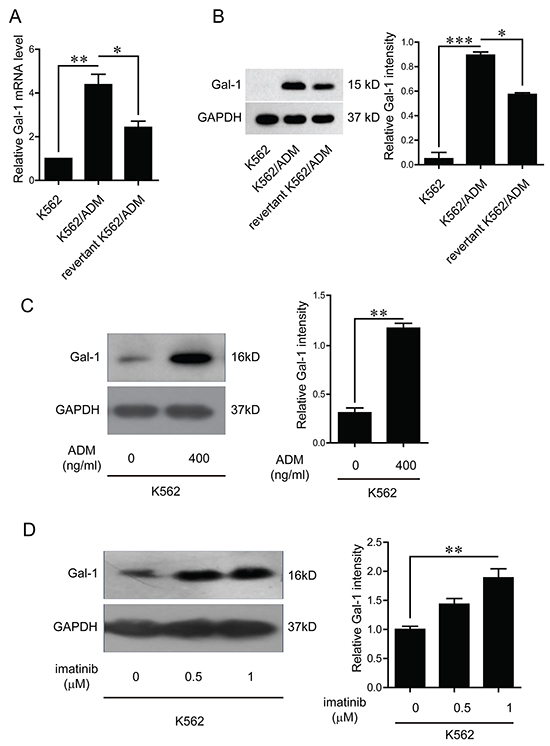
Figure 4: Verification of galectin-1 expression and effects of chemical drugs on galectin-1 product. A. Total RNA was isolated from K562, K562/ADM, and the revertant K562/ADM cells, and subjected to q-PCR analysis of the mRNA levels of galectin-1. B. The protein levels of galectin-1 were detected by western blotting and scanning densitometry. Data are presented as the expression level relative to that of GAPDH. C. K562 cells were treated with adriamycin for 48 h before extraction of cell lysates, which were subsequently immunoblotted with galectin-1 antibody. D. K562 cells were treated with imitinib for 48 h, and whole cell lysates were subsequently immunoblotted with galectin-1 antibody. Data are presented as the mean (±SD) of three independent experiments. *p<0.05, **p<0.01, ***p<0.001.
As the expression levels of galectin-1 increased with the augment of drug resistance, and the resistant cell lines were selected by exposure to adriamycin, we speculated it may be the chemical drugs that trigger the increase of galectin-1 product. Further investigations indicated that both adriamycin and imatinib up-regulated galectin-1 expression in a dose dependent manner (Figure 4C and 4D).
Galectin-1 mediates chemoresistance in CML
In order to explore the role of galectin-1 identified by proteomic approach in drug resistance, stable clone of galectin-1 overexpressing cells, K562/Gal-1, was constructed and characterized by q-PCR and immunoblotting. Compared with K562/pcDNA3.1(-) (K562/pc) cells transfected with the control vector, pronounced enhancement of galectin-1 expression at both transcriptional and translational levels was observed in K562/Gal-1 cells (Figure 5A and 5B). Further MTT assay results showed that overexpression of galectin-1 increased resistance to the detected chemical agents, with 4-fold higher IC50 of K562/Gal-1 cells (1.676±0.145 μg/ml of adriamycin and 0.84±0.087 μM of imatinib) than that of K562/pc cells (0.485±0.03 μg/ml of adriamycin and 0.23±0.035 μM of imatinib) (Table 3).
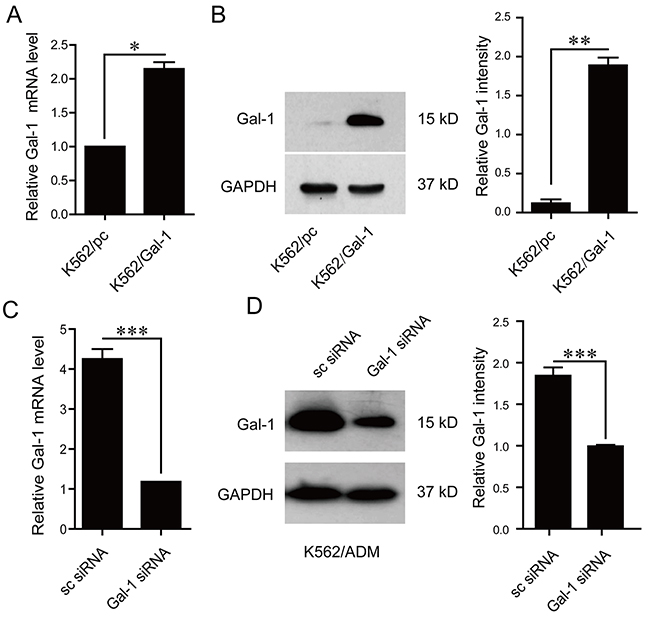
Figure 5: Effects of galectin-1 on drug resistance. A. The mRNA levels of galectin-1 in K562 cells stably transfected with pcDNA3.1(-) or pcDNA3.1(-)/Gal-1 were assessed by q-PCR. B. Increased protein levels of galectin-1 in pcDNA3.1(-)/Gal-1 stably transfected K562 cells (K562/Gal-1) were determined in whole cell lysates by western blotting. C. K562/ADM cells were transfected with galectin-1 targeting siRNA (Gal-1 siRNA) or scrambled siRNA (sc siRNA) for 48 h prior to analysis of galectin-1 mRNA levels by q-PCR. D. Decreased protein levels of galectin-1 in Gal-1 siRNA transfected K562/ADM cells were detected using western blotting. MTT assay was applied to determine the effects of alteration of galectin-1 expression on the resistance to adrimycin and imatinib as present in Table 3. Data are presented as the mean (±SD) of three independent experiments. *p<0.05, **p<0.01, ***p<0.001.
Table 3: Effects of galectin-1 and P38 inhibitor on the IC50 of adriamycin and imatinib in K562, K562/Gal-1, and K562/ADM cells
IC50 |
K562/pc |
K562/Gal-1 |
K562/ADM |
|||||
|---|---|---|---|---|---|---|---|---|
– |
– |
DMSO |
SB202190 |
sc siRNA |
Gal-1 siRNA |
DMSO |
SB202190 |
|
ADM(μg/ml) |
0.485±0.03 |
1.676±0.145 |
1.636±0.141 |
1.29±0.125 |
25.56±0.41 |
14.76±0.45 |
26.51±0.44 |
16.24±0.48 |
imatinib(μM) |
0.23±0.035 |
0.84±0.087 |
0.8±0.083 |
0.4±0.037 |
2.5±0.214 |
1.1±0.12 |
2.27±0.211 |
0.5±0.46 |
We next evaluated the effects of galectin-1 siRNA targeting treatment on the chemoresistance in K562/ADM cells. As shown in Figure 5C and 5D, treatment of K562/ADM cells with 50 nM galectin-1 siRNA induced down-regulation of galectin-1 expression at the mRNA and protein levels. Knockdown of galectin-1 in K562/ADM cells could increase the chemosensitivity to both adriamycin and imatinib treatment, with the IC50 of adriamycin decreasing from 26.56±0.41 μg/ml to 14.76±0.45 μg/ml, and that of imatinib from 2.5±0.214 μM to 1.1±0.12 μM as present in Table 3.
Galectin-1 is a modulator of MDR1
As shown by the above results, the trends of galectin-1 expression change are parallel to those of MDR1 in three types of cells with a gradual increase of resistance against adriamycin and imatinib. In the light of MDR1 directly contributing to the drug resistance by exporting drugs out of the cell, combined with our results showing that galectin-1 enhances the chemoresistance in CML, we proposed that galectin-1 may decrease the chemosensitivity via increase of MDR1 expression. To address this issue, q-PCR was applied to compare the mRNA levels of MDR1 between K562/pc and K562/Gal-1 cells, and between K562/ADM/sc siRNA and K562/ADM/Gal-1 siRNA. The results present in Figure 6A indicated that overexpression of galectin-1 up-regulated MDR1 transcription, while knockdown of galectin-1 decreased the mRNA levels of MDR1. Alteration of galectin-1 expression had little effect on the other well-studied drug transporter MRP1 (Figure 6B). The results suggest that augment of MDR1 expression involves in galectin-1-mediated chemoresistance.
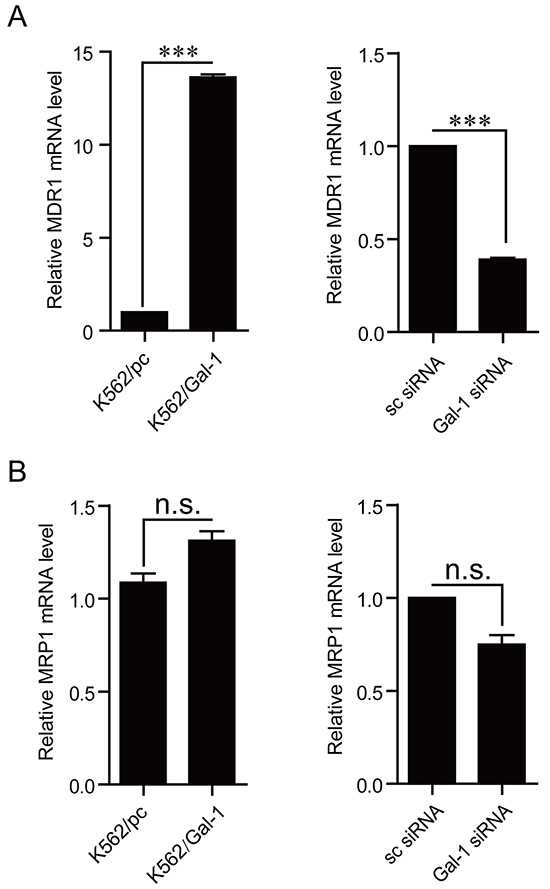
Figure 6: Galectin-1 modulates MDR1 expression. The mRNA levels of MDR1 A. and MRP1 B. were detected in K562 cells stably overexpressing galectin-1 or in K562/ADM cells tranfected with Gal-1 siRNA for 48 h by q-PCR. The experiment was repeated for three times with similar results. ***p<0.001.
Galectin-1 induces MDR1 expression via P38 MAPK activation and NF-κB translocation
It has been investigated that NF-κB transcription factor regulates MDR1 expression by specifically binding to an intronic response element of MDR1 gene promoter [16]. In the light of MAPK signal pathways mediating nuclear translocation of NF-κB, which is required for its transcription activity, and galectin-1 directly interacting with Ras, which subsequently activates Erk1/2 and P38 mitogen-activated protein kinase (MAPK) signal pathways [17-19], we proposed that the mechanisms of galectin-1 inducing MDR1 expression may involve MAPK signal activation and NF-κB translocation. In order to define the signal pathway participating in mediating galectin-1-induced NF-κB translocation, and subsequent MDR1 transcription, we first detected the effects of galectin-1 on the activation of Erk1/2 and P38 MAPK cascades. As shown in Figure 7A, overexpression of galectin-1 increased the phosphorylation levels of P38 rather than Erk1/2, implying that activation of P38 MAPK signal pathway may be responsible for mediating galectin-1 functions in K562 cells. Further suppression of P38 activation with the P38 inhibitor SB202190 attenuated NF-κB translocation (Figure 7B), MDR1 gene promoter activity (Figure 7C), and MDR1 mRNA levels (Figure 7D). Moreover, blockade of P38 activation in K562/Gal-1 cells decreased the chemoresistance to both adriamycin and imatinib treatment, with the IC50 of adriamycin reducing from 1.636±0.141 μg/ml to 1.29±0.125 μg/ml, and that of imatinib from 0.8±0.083 μM to 0.4±0.037 μM. Similar results were found in K562/ADM cells treated with SB202190 (Table 3). Combined with the above results, we suggest that galectin-1/P38 MAPK/NF-κB/MDR1 axis at least in part contributes to developing the chemoresistance in CML.
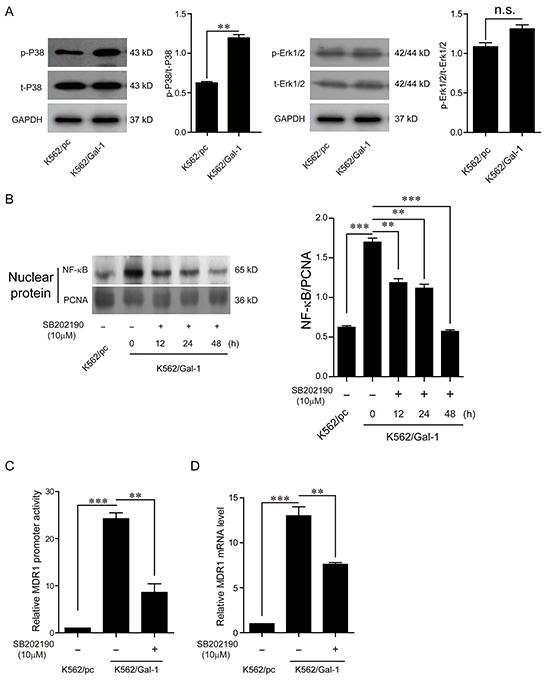
Figure 7: Galectin-1 induces MDR1 expression via P38 MAPK activation and NF-κB translocation. A. K562/Gal-1 cells were pretreated with 10 μM P38 inhibitor SB202190 for 48 h prior to extraction of cell lysates for western blot analysis of the activation of Erk1/2 and P38. B. NF-κB translocation was determined by western blot analysis of NF-κB/p65 in nuclear extracts of K562/Gal-1 cells treated with P38 inhibitor SB202190 at the concentration of 10 μM for 12 h, 24 h, and 48 h. PCNA was used as the loading control. C. EGFP reporter assay was carried out to examine the MDR1 promoter transcriptional activity. K562/Gal-1 cells were pretreated with P38 inhibitor SB202190 for 1 h prior to transfection of the MDR1 promoter/EGFP reporter construct pGL3-proMDR1-EGFP or the control vector pGL3-EGFP. D. Inhibition of P38 activation triggered by galectin-1 decreased MDR1 expression. The mRNA levels of MDR1 were detected in K562/pc cells, K562/Gal-1 cells, and K562/Gal-1 cells treated with P38 inhibitor SB202190 for 1 h by q-PCR. Data are presented as the mean (±SD) of three independent experiments. **p<0.01, ***p<0.001.
DISCUSSION
Imatinib has been proved to be an efficient target drug with few adverse consequences for CML treatment. However, patients initially displaying positive response to imatinib become refractory to imatinib treatment due to the development of drug resistance. It has been found that MDR1 expression was more frequent in both advanced CML and acute myeloid leukemia (AML) patients [20, 21]. Mahon F et al. reported overexpression of ABCB1 gene in leukemia cells results in resistance to imatinib [14]. Therefore, besides BCR-ABL amplification and mutation, decreased intracellular levels of imatinib caused by MDR1 up-regulation is also considered as a major reason leading to imatinib resistance [15]. However, the mechanisms by which the leukemia cells increase the expression of this transmembrane export pump are still unknown. We proposed that differentially expressed proteins identified by comparison of the protein profiles among a model system of the leukemia cells with different MDR1 expression levels may provide a hint for revealing the mechanisms modulating the expression of MDR1. K562/ADM cells selected by adriamycin exposure produce more abundant MDR1 than the parental K562 cells. Cultivation of K562/ADM cells in the condition without adriamycin selection for three consecutive months led to obtain the revertant K562/ADM cells with a moderate MDR1 expression. Coincident with Illmer T et al reports [15], a gradual augment of MDR1 in K562 cell lines is accompanied by an increase of resistant potentials against adriamycin and imatinib. By comparison of the protein profiles among three different K562 cell lines with a gradual increase of MDR1 expression, we identified galectin-1 as a candidate of MDR1 modulators for enhancing drug resistance. Further investigations revealed that galectin-1 induces MDR1 expression via P38 MAPK activation and NF-κB translocation, which contributes to the development of drug resistance.
Galectin-1 has a wide distribution in tissues and is modulated accompanying with the alteration of the physiological or pathological conditions. Accumulating evidences have demonstrated that galectin-1 is closely relevant to the tumor progression by promoting transformation, angiogenesis, and metastasis [22-25]. However, there are few reports exploring the role of galectin-1 in tumor chemoresistance. The endogenous expression levels of galectin-1 vary in different kinds of tumors. Some cancerous cells with high levels of endogenous galectin-1 expression, such as non-small cell lung cancer (NSCLC) cells, have relative high potentials of anti-chemotherapy. Suppression of galectin-1 sensitizes the NSCLC cells to platinum-based chemotherapy [19]. In our studies, we found the expression levels of the endogenous galectin-1 are pretty low in K562 cells, whereas significant up-regulation of galectin-1 is observed in the corresponding chemoresistant K562/ADM cells. Moreover, treatment of K562 cells with adriamycin or imatinib could increase galectin-1 expression, suggesting that tumor cells may gradually develop drug resistance along with the chemotherapy. These results imply that galectin-1 might be a potential biomarker for the chemoresistant ability of tumor cells, and provide a novel target for combined therapy for enhancing the efficiency of the chemical drugs.
Promotion of apoptosis by galectin-1 in the activated T cells has been extensively investigated in the past two decades [26, 27]. The molecular mechanisms underlying galectin-1 inducing apoptosis involve suppression of anti-apoptotic protein expression and stimulation of caspases [28]. As one mechanism by which tumor cells develop drug resistance is associated with resistance to apoptosis, it seems paradoxical that galectin-1 on one hand induces apoptosis, and on the other hand contributes to drug resistance. We initially presumed that galectin-1 may exert an oppose effect on the apoptosis in K562 cells as compared to the activated T cells. Therefore, flow cytometric analysis was applied to determine the effects of galectin-1 on the apoptosis of K562 cells. Contrary to our speculation, galectin-1 significantly promoted apoptosis of K562 cells treated with or without adriamycin (data not shown). It seems that apoptosis induced by galectin-1 contributes little to the galectin-1-triggered drug resistance. In the light of reports suggesting that galectin-1 does not activate a full apoptotic pathway in some kinds of cells including T cells [29], T leukemia cells, promyelocytic cells and activated neutrophils [30], the possible explanation may be that K562 cells induced by galectin-1 undergo partial apoptotic process, which has less relevance with drug resistance than the full apoptotic process does. However, further investigations are required to clarify the relationship between galectin-1-elicited apoptosis and drug resistance.
In summary, we found that galectin-1 was a novel modulator of MDR1 by proteomic analysis of a model system of leukemia cell lines with a gradual increase of MDR1 expression and drug resistance, and NF-κB translocation induced by P38 MAPK activation was responsible for the enhancing effects of galectin-1 on MDR1, suggesting that galectin-1 might be a novel target for improving the efficacy of CML chemotherapy.
MATERIALS AND METHODS
Reagents
The cell proliferation assay reagent methylthiazoletetrazolium (MTT) was purchased from Roche (Mannheim, Germany). RMPI-1640 and fetal bovine serum (FBS) were obtained from GIBCO (Carlsbad, CA, USA). Adriamycin (ADM) was purchased from Sangon Biotech (Shanghai, China). Imatinib was purchased from Selleckchem (Houston, Texas, USA). The polyvinylidenedifluoride (PVDF) membrane was from Millipore (Billerica, MA, USA). The enhanced chemiluminescence (ECL) detection kit was obtained from Pierce (Rockford, IL, USA). Anti-phospho-Erk1/2 (cat no. 4370), anti-Erk1/2 (cat no. 4695), anti-phospho-P38 (cat no. 4511), anti-P38 (cat no. 8690), anti-PCNA (cat no. 13110), anti-GAPDH (cat no. 2118), anti-NF-κB/p65 (cat no. 8242), anti-Galectin-1/LGALS1 (cat no. 1293) antibodies, P38 inhibitor SB202190, anti-rabbit IgG, HRP-linked antibody (cat no. 7074), and anti-mouse IgG, HRP-linked antibody (cat no. 7076) were obtained from Cell Signaling Technology (Danvers, MA, USA). IPG strips (pH 3-10 nonlinear), SDS, acrylamide, methylene bisacrylamide, TEMED, CHAPS, Bio-Lyte 3-10 ampholyte 40% solution, Tris, glycine, and iodoacetamide were from Bio-Rad (Hercules, CA, USA). PureZOL RNA, First-Strand cDNA synthesis kit and SYBR green q-PCR kit were purchased from Bio-Rad. HindIII, BamHI, NcoI, XbaI and T4 ligase were purchased from Thermo Fisher (Waltham, MA, USA).
Cell culture
A model system of leukemia cell lines including K562 cells and the adriamycin resistant cells, K562/ADM, were gifts from Professor Yifei Wang in Department of cellular biology of Jinan University (Guangzhou, China). The revertant K562/ADM cells were obtained by culture of K562/ADM cells without adriamycin for three consecutive months. K562 and the revertant K562/ADM cells were maintained in RPMI-1640 supplemented with 10% FBS and 10 mM HEPES (Sigma) buffer at 37 °C in an atmosphere of 5% CO2. K562/ADM cells were cultured in the complete RPMI-1640 media containing 500 ng/ml adriamycin.
Cell viability assay
Cells were seeded into 96-well culture plates at a density of 1×10⁴ cells per well. After 4 h, cells were treated with serially diluted adriamycin (0.05, 0.1, 0.2, 0.4, 0.8, 1.6, 3.2 μg/ml for K562, K562/pc and K562/Gal-1 cells; 1.6, 3.2, 6.4, 12.8, 25.6, 51.2, 102.4 μg/ml for K562/ADM, the revertant K562/ADM, K562/ADM/sc siRNA and K562/ADM/Gal-1 siRNA cells), or imatinib (0.05, 0.1, 0.2, 0.4, 0.8 μM for K562, K562/pc and K562/Gal-1 cells; 0.4, 0.8, 1.6, 3.2, 6.4, 12.8, 25.6 μM for K562/ADM, the revertant K562/ADM, K562/ADM/sc siRNA and K562/ADM/Gal-1 siRNA) for 48 h. The viability of cells was determined by the MTT assay as previously described [31].
Sample preparation for 2D-PAGE
K562, K562/ADM and the revertant K562/ADM cells cultured in 75 cm2 flask were harvested and lysed in 150 μl lysis buffer containing 7 M urea, 2 M thiourea, 4% CHAPS, 65 mM DTT, 0.2% Bio-Lyte 3-10 ampholyte, 50 μg/ml RNase A, 200 μg/ml DNase I, and protease inhibitor cocktail. Samples were incubated at room temperature for 10 min, kept on ice for 2 h, and centrifuged at 12,000 g for 30 min at 4 °C. The supernatant was collected and the protein concentrations were detected using the Bradford method.
2D-PAGE and image analysis
An equal amount (1 mg) of protein sample was mixed with rehydration buffer complemented with 7 M urea, 2 M thiourea, 4% CHAPS, 65 mM DTT, 0.2% Bio-Lyte 3-10 ampholyte and 0.001% bromophenol blue, and loaded on a 17 cm, pH3-10 nonlinear immobilized pH gradient (IPG) gel strip (Bio-Rad). The IPG strips were then passively rehydrated at 20°C for 13 h, and subjected to isoelectric focusing (IEF) performed at 20 °C at 100 V for 30 min, 150 V for 3 h, 250 V for 1 h, 500 V for 1 h, 1000 V for 2 h, 5000 V for 3 h, 8000 V for 64000 V/h, and 500 V for 24 h. After IEF separation, the strip was equilibrated, and separated on 12% SDS-PAGE gels as previously described [32]. The gel was stained with Coomassie brilliant blue G250 (Bio-Rad), and scanned with a UMAX POWERLOOK 2100XL USB scanner (UMAX, Dallas, TX, USA). PDQuest 8.0 software (Bio-Rad) was used to analyze the images.
Mass spectrometric analysis and database search
In-gel digestion of the differentially expressed proteins was carried out before mass spectrometric analysis. Briefly, the protein spots were excised, destained in 25 mM ammonium bicarbonate 50% NH4HCO3/acetonitrile (ACN) (v/v), dehydrated in 100% ACN, and then incubated with trypsin at 37 °C overnight. The peptides were extracted, dried in a vacuum concentrator for 3 h, and subjected to tandem time-of-flight mass spectrometry (ABI 4800 TOF-TOF) analysis. Mascot software (Matrix science, London, UK) was applied to search IPI (International Protein Index) databases for protein identification.
Construction of K562/Gal-1 cell line stably overexpressing galectin-1
The full-length galectin-1 coding sequence was amplified from cDNA synthesized by reverse transcriptase polymerase chain reaction (RT-PCR) using the total RNA extracted from K562/ADM cells as the template. Briefly, cDNA was synthesized via reverse transcription using the oligo dT18, and subjected to PCR amplification of the full-length galectin-1 coding sequence (NCBI accession no. NM_002305.3). The PCR procedure comprised of an initial step at 94 °C for 5 min, followed by 40 cycles of 94 °C for 30 s, 58 °C for 15 s, and 72 °C for 1 min, and an additional extension at 72 °C for 30 min. The following primers were used for galectin-1 amplification: 5’-AGCGGATCCATGGCTTGTGGTCTGGTC-3’ (forward, BamHI site underlined) and 5’-TATAAGCTTTCAGTCAAAGGCCACACA-3’ (reverse, HindIII site underlined). The PCR products were purified by the TIANGEN purification kit (TIANGEN, Beijing, China), digested with BamHI and HindIII, and inserted into the pcDNA3.1(-) vector (Invitrogen, Carlsbad, CA, USA) to obtain the recombinant plasmid pcDNA3.1(-)/Gal-1, which was subsequently sent to Sangon Company (Shanghai, China) for sequencing.
The recombinant plasmid pcDNA3.1(-)/Gal-1 harboring the correct galectin-1 coding sequence and the control vector pcDNA3.1(-) were transfected into K562 cells with lipofectamine LTX (Invitrogen) following the manufacturer’s protocol. Briefly, 3×10⁴ K562 cells seeded in an individual well of a 24-well culture plate were transfected with 1 μg of plasmid DNA. After transfection for 48 h, cells were selected in complete RPMI-1640 media containing G418 (500 μg/ml) for 2 weeks, and subsequently replated (10 cells/well) in 96-well culture plate for continuous G418 selection. After cultured for 10 days, individual G418-resisitant colonies were picked, propagated and screened for K562/Gal-1 cell clone stably expressing galectin-1 by q-PCR and western blotting. The sequences of galectin-1 and GAPDH primers for q-PCR were shown in Table 4. GAPDH was used as an internal control.
Table 4: The sequences of primers for real time quantitative PCR
Gene name |
Accession No. |
forward (5’-3’) |
reverse (5’-3’) |
product length (bp) |
|---|---|---|---|---|
Gal-1 |
NM_002305 |
CGAGTGCGAGGCGAGGTG |
CGTTGAAGCGAGGGTTGAAGTG |
100 |
MDR1 (ABCB1/Pgp) |
NM_000927.4 |
TTGCCTATGGAGACAACAGCC |
ACGAGCTATGGCAATGCGTT |
173 |
MRP1 (ABCC1) |
NM_004996.3 |
CTACCTCCTGTGGCTGAATCTG |
CATCAGCTTGATCCGATTGTC |
151 |
GAPDH |
NM_002046.5 |
CCCACTCCTCCACCTTTGAC |
TCTTCCTCTTGTGCTCTTGC |
182 |
Suppression of galectin-1 expression by small interfering RNA
A small interfering RNA (siRNA) targeting galectin-1 (Gal-1 siRNA) [19] with the sequence of sense 5’-GCUGCCAGAUGGAUACGAAUUdtdt-3’, and anti-sense 5’-AAUUCGUAUCCAUCUGGCAGCdtdt’ was synthesized by RiboBio (Guangzhou, China). A scrambled siRNA (sc siRNA) obtained from RiboBio was used as a negative control. For siRNA-mediated inhibition of galectin-1 gene expression, K562/ADM cells were transfected with Gal-1 siRNA or sc siRNA at a final concentration of 50 nM using RNA MAX siRNA Transfection Reagent (Invitrogen) according to the manufacturer’s instructions. Silencing efficiency was estimated at mRNA and protein levels by q-PCR and western blotting.
Quantitative PCR analysis
Total RNA was isolated with PureZOL according to the manufacturer’s instructions. A first-strand cDNA synthesis kit was applied to produce cDNAs from 1μg of total RNA, which were then used as templates for q-PCR amplification with the SYBR green q-PCR Kit using the CFX96 Touch™ Real-Time PCR Detection System. The primers of galectin-1, MDR1, MRP1 and GAPDH were showed in Table 4. GAPDH was amplified as an internal control. The q-PCR conditions were 94 °C for 5 min followed by 40 cycles of 95 °C for 5 s, 59 °C for 20 s.
Western blotting analysis
Cells were harvested and lysed in 1 × SDS-PAGE loading buffer, then centrifuged at 12,000 g for 30 min at 4 °C to remove the insoluble components. The resultant protein samples were resolved by 10% SDS-PAGE gel and transferred to a PVDF membrane. The membrane was blocked at room temperature for 1 h in TBST (25 mM Tris, pH 7.4, 150 mM NaCl, and 0.1% Tween-20) containing 5% non-fat dry milk, and subsequently incubated with the primary antibodies at 4 °C overnight followed by incubation with goat anti-rabbit or rabbit anti-mouse IgG, HRP-linked antibody for 1 h at room temperature. The blots were detected with an ECL detection kit (Pierce) according to the manufacturer’s procedure. GAPDH was used as the reference control. The results were analyzed by Quantity One software to determine the ratio relative to GAPDH.
Extraction of nuclear proteins
Cells were seeded in 6-well culture plates at a density of 2.5×10⁵ cells per well. After cultivation for 6 h, K562/Gal-1 cells were treated with P38 inhibitor SB202190 at the concentration of 10 μM for 12 h, 24 h, and 48 h before extraction of the nuclear proteins using the Nuclear and Cytoplasmic Protein Extraction Kit (KeyGEN Biotech, Nanjing, China) according to the manufacturer’s instructions. The protein concentration was determined by a BCA protein assay kit (Pierce). The nuclear proteins (NF-κB/p65 and PCNA) were analyzed by western blotting.
Promoter activity reporter assay
A promoter/EGFP reporter plasmid containing the MDR1 promoter region (-982 to -7) was constructed by replacement of the luciferase reporter with EGFP reporter in pGL3-basic (Promega; Madison, WI, USA). Briefly, EGFP reporter was first amplified by PCR using the plasmid EGFP-N3 as a template and the primer pair: 5’-GCCACCATGGTGAGCAAGGGCGAG-3’ forward, and 5’-CGCGTCTAGATTACTTGTACAGCTCGTCCATGCCGAGAG-3’ reverse, (NcoI and XbaI sites were underlined, respectively), and substituted for the luciferase reporter in the plasmid pGL3-basic at the identical sites to obtain the EGFP reporter plasmid pGL3-EGFP. MDR1 promoter region was then amplified from human genomic DNA extracted from HUVEC cells using the following primer pair: 5’-ATATAAGCTTCTGCAGGGGCTTTCCTGTG-3’ and 5’-TATAAAGCTTCTGCAGAAAAATTTCTCCTAGCC-3’ (HindIII site was underlined), and inserted into pGL3-EGFP at the identical site to construct a MDR1 promoter/EGFP reporter plasmid pGL3-proMDR1-EGFP.
Cells were seeded into 12-well tissue-culture plate with 5 × 10⁵ each well. After 6 h, K562/Gal-1 cells were pretreated with P38 inhibitor SB202190 for 1 h prior to transfection. Cells were transfected with the MDR1 promoter/EGFP reporter construct pGL3-proMDR1-EGFP or the control vector pGL3-EGFP using lipofectamine LTX (Invitrogen) according to the manufacturer’s instruction. After 48 h transfection, cells were harvested, washed three times with cold PBS, and subjected to analysis using a BD Bioscience FACScan (Becton Dickinson, NJ, USA). Data were analyzed and presented using the Cell Quest software. The relative fluorescence intensity was calculated by dividing the fluorescence intensity of cells transfected with pGL3-proMDR1-EGFP by that of cells transfected with the control vector pGL3-EGFP.
Statistical analysis
The statistical analyses were performed using GraphPad Prism software 5.01. The student’s t-test was used to compare data between two groups, and one way ANOVA followed by Tukey’s multiple comparison test was used for multiple comparison data. Differences were considered significant at *p< 0.05, **p< 0.01, and ***p< 0.001.
ACKNOWLEDGMENTS AND GRANT SUPPORT
This work was supported by grants from the National Science Foundation of China (81573334, 81272462), the Science and Technology Planning Project of Guangdong Province of China (2015A020211017), the Natural Science Foundation of Zhejiang Province of China (LY14H310013), the Team Project of Natural Science Foundation of Guangdong Province of China (S2013030013315), Guangdong Provincial “Thousand-Hundred-Ten Talent Project” (X. Wu).
CONFLICTS OF INTEREST
None of the authors have any relevant conflicts of interest or disclosures.
REFERENCES
1. Melo JV. The diversity of BCR-ABL fusion proteins and their relationship to leukemia phenotype. Blood. 1996; 88:2375-2384.
2. Hunter T. Treatment for chronic myelogenous leukemia: the long road to imatinib. J Clin Invest. 2007; 117:2036-2043.
3. Litzow MR. Imatinib resistance: obstacles and opportunities. Arch Pathol Lab Med. 2006; 130:669-679.
4. le Coutre P, Tassi E, Varella-Garcia M, Barni R, Mologni L, Cabrita G, Marchesi E, Supino R and Gambacorti-Passerini C. Induction of resistance to the Abelson inhibitor STI571 in human leukemic cells through gene amplification. Blood. 2000; 95:1758-1766.
5. Gorre ME, Mohammed M, Ellwood K, Hsu N, Paquette R, Rao PN and Sawyers CL. Clinical resistance to STI-571 cancer therapy caused by BCR-ABL gene mutation or amplification. Science. 2001; 293:876-880.
6. Kantarjian HM, Giles F, Gattermann N, Bhalla K, Alimena G, Palandri F, Ossenkoppele GJ, Nicolini FE, O’Brien SG, Litzow M, Bhatia R, Cervantes F, Haque A, Shou Y, Resta DJ, Weitzman A, et al. Nilotinib (formerly AMN107), a highly selective BCR-ABL tyrosine kinase inhibitor, is effective in patients with Philadelphia chromosome-positive chronic myelogenous leukemia in chronic phase following imatinib resistance and intolerance. Blood. 2007; 110:3540-3546.
7. Hazarika M, Jiang X, Liu Q, Lee SL, Ramchandani R, Garnett C, Orr MS, Sridhara R, Booth B, Leighton JK, Timmer W, Harapanhalli R, Dagher R, Justice R and Pazdur R. Tasigna for chronic and accelerated phase Philadelphia chromosome--positive chronic myelogenous leukemia resistant to or intolerant of imatinib. Clin Cancer Res. 2008; 14:5325-5331.
8. Qin Y, Chen S, Jiang B, Jiang Q, Jiang H, Li J, Li L, Lai Y, Liu Y and Huang X. Characteristics of BCR-ABL kinase domain point mutations in Chinese imatinib-resistant chronic myeloid leukemia patients. Ann Hematol. 2011; 90:47-52.
9. Elias MH, Baba AA, Azlan H, Rosline H, Sim GA, Padmini M, Fadilah SA and Ankathil R. BCR-ABL kinase domain mutations, including 2 novel mutations in imatinib resistant Malaysian chronic myeloid leukemia patients-Frequency and clinical outcome. Leuk Res. 2014; 38:454-459.
10. Wei Y, Hardling M, Olsson B, Hezaveh R, Ricksten A, Stockelberg D and Wadenvik H. Not all imatinib resistance in CML are BCR-ABL kinase domain mutations. Ann Hematol. 2006; 85:841-847.
11. Khorashad JS, Eiring AM, Mason CC, Gantz KC, Bowler AD, Redwine HM, Yu F, Kraft IL, Pomicter AD, Reynolds KR, Iovino AJ, Zabriskie MS, Heaton WL, Tantravahi SK, Kauffman M, Shacham S, et al. shRNA library screening identifies nucleocytoplasmic transport as a mediator of BCR-ABL1 kinase-independent resistance. Blood. 2015; 125:1772-1781.
12. Lau A and Seiter K. Second-line therapy for patients with chronic myeloid leukemia resistant to first-line imatinib. Clin Lymphoma Myeloma Leuk. 2014; 14:186-196.
13. Choi YH and Yu AM. ABC transporters in multidrug resistance and pharmacokinetics, and strategies for drug development. Curr Pharm Des. 2014; 20:793-807.
14. Mahon FX, Belloc F, Lagarde V, Chollet C, Moreau-Gaudry F, Reiffers J, Goldman JM and Melo JV. MDR1 gene overexpression confers resistance to imatinib mesylate in leukemia cell line models. Blood. 2003; 101:2368-2373.
15. Illmer T, Schaich M, Platzbecker U, Freiberg-Richter J, Oelschlagel U, von Bonin M, Pursche S, Bergemann T, Ehninger G and Schleyer E. P-glycoprotein-mediated drug efflux is a resistance mechanism of chronic myelogenous leukemia cells to treatment with imatinib mesylate. Leukemia. 2004; 18:401-408.
16. Bentires-Alj M, Barbu V, Fillet M, Chariot A, Relic B, Jacobs N, Gielen J, Merville MP and Bours V. NF-kappaB transcription factor induces drug resistance through MDR1 expression in cancer cells. Oncogene. 2003; 22:90-97.
17. Paz A, Haklai R, Elad-Sfadia G, Ballan E and Kloog Y. Galectin-1 binds oncogenic H-Ras to mediate Ras membrane anchorage and cell transformation. Oncogene. 2001; 20:7486-7493.
18. Belanis L, Plowman SJ, Rotblat B, Hancock JF and Kloog Y. Galectin-1 is a novel structural component and a major regulator of h-ras nanoclusters. Mol Biol Cell. 2008; 19:1404-1414.
19. Chung LY, Tang SJ, Sun GH, Chou TY, Yeh TS, Yu SL and Sun KH. Galectin-1 promotes lung cancer progression and chemoresistance by upregulating p38 MAPK, ERK, and cyclooxygenase-2. Clin Cancer Res. 2012; 18:4037-4047.
20. Giles FJ, Kantarjian HM, Cortes J, Thomas DA, Talpaz M, Manshouri T and Albitar M. Multidrug resistance protein expression in chronic myeloid leukemia: associations and significance. Cancer. 1999; 86:805-813.
21. Marin JJ, Briz O, Rodriguez-Macias G, Diez-Martin JL and Macias RI. Role of drug transport and metabolism in the chemoresistance of acute myeloid leukemia. Blood Rev. 2016; 30:55-64.
22. Wu MH, Hong TM, Cheng HW, Pan SH, Liang YR, Hong HC, Chiang WF, Wong TY, Shieh DB, Shiau AL, Jin YT and Chen YL. Galectin-1-mediated tumor invasion and metastasis, up-regulated matrix metalloproteinase expression, and reorganized actin cytoskeletons. Mol Cancer Res. 2009; 7:311-318.
23. Wu MH, Hong HC, Hong TM, Chiang WF, Jin YT and Chen YL. Targeting galectin-1 in carcinoma-associated fibroblasts inhibits oral squamous cell carcinoma metastasis by downregulating MCP-1/CCL2 expression. Clin Cancer Res. 2011; 17:1306-1316.
24. Tang D, Zhang J, Yuan Z, Gao J, Wang S, Ye N, Li P, Gao S, Miao Y, Wang D and Jiang K. Pancreatic satellite cells derived galectin-1 increase the progression and less survival of pancreatic ductal adenocarcinoma. PLoS One. 2014; 9:e90476.
25. Martinez-Bosch N, Fernandez-Barrena MG, Moreno M, Ortiz-Zapater E, Munne-Collado J, Iglesias M, Andre S, Gabius HJ, Hwang RF, Poirier F, Navas C, Guerra C, Fernandez-Zapico ME and Navarro P. Galectin-1 drives pancreatic carcinogenesis through stroma remodeling and Hedgehog signaling activation. Cancer Res. 2014; 74:3512-3524.
26. He J and Baum LG. Presentation of galectin-1 by extracellular matrix triggers T cell death. J Biol Chem. 2004; 279:4705-4712.
27. Brandt B, Buchse T, Abou-Eladab EF, Tiedge M, Krause E, Jeschke U and Walzel H. Galectin-1 induced activation of the apoptotic death-receptor pathway in human Jurkat T lymphocytes. Histochem Cell Biol. 2008; 129:599-609.
28. Rabinovich GA, Alonso CR, Sotomayor CE, Durand S, Bocco JL and Riera CM. Molecular mechanisms implicated in galectin-1-induced apoptosis: activation of the AP-1 transcription factor and downregulation of Bcl-2. Cell Death Differ. 2000; 7:747-753.
29. Hahn HP, Pang M, He J, Hernandez JD, Yang RY, Li LY, Wang X, Liu FT and Baum LG. Galectin-1 induces nuclear translocation of endonuclease G in caspase- and cytochrome c-independent T cell death. Cell Death Differ. 2004; 11:1277-1286.
30. Dias-Baruffi M, Zhu H, Cho M, Karmakar S, McEver RP and Cummings RD. Dimeric galectin-1 induces surface exposure of phosphatidylserine and phagocytic recognition of leukocytes without inducing apoptosis. J Biol Chem. 2003; 278:41282-41293.
31. Wu X, Yan Q, Huang Y, Huang H, Su Z, Xiao J, Zeng Y, Wang Y, Nie C, Yang Y and Li X. Isolation of a novel basic FGF-binding peptide with potent antiangiogenetic activity. J Cell Mol Med. 2010; 14:351-356.
32. Wang C, Lin S, Nie Y, Jia X, Wang J, Xiao J, Wu J, Li X and Wu X. Mechanism of antitumor effect of a novel bFGF binding peptide on human colon cancer cells. Cancer Sci. 2010; 101:1212-1218.