
INTRODUCTION
Hepatocellular carcinoma (HCC) is one of the most common cancers worldwide [1]. HCC is among the malignancies with high morbidities and mortalities in China and hepatitis B virus (HBV) infection is a predominant causative agent associated with the development of HCC [2, 3]. The deterioration of T cell function, a state termed T cell exhaustion, impairs the immunity to chronic viral infections including HBV infection and alters the immunology of cancer [4].
The underlying mechanisms of T cell exhaustion in chronic HBV infection and HBV-related HCC have not been fully clarified. However, programmed cell death protein 1 (PD-1) and T-cell immunoglobulin domain and mucin domain containing molecule 3 (TIM-3), two major immune checkpoint proteins, have been shown to be involved in the T-cell dysfunction and exhaustion of chronic HBV infection and HCC development [5–9]. PD-1 and TIM-3 expression has also been indicated to be related to the outcome and the disease progression of HBV infection [10–12] and the prognosis of HCC [9, 13]. Furthermore, blocking PD-1 or TIM-3 pathway restores antiviral T-cell responses in chronic HBV infection [6, 14, 15]. Genetically, polymorphisms of PD1 and TIM3 genes have been revealed to be associated with the disease progression and the development of HCC in chronic HBV infection [16–18].
However, whether the polymorphisms of PD1 and TIM3 are of clinical significance in the prognosis of HBV-related liver disease, especially HCC, remains unknown. Therefore, the aim of this study is to examine the associations of PD1 and TIM3 gene polymorphisms with the overall survival (OS) of patients in a prospective cohort of patients with HBV-related HCC receiving various treatments.
RESULTS
Characteristics of patients
The demographics and the clinical characteristics of the 262 HBV-related HCC patients at study entry and the treatments were summarized in Table 1. The median follow-up period was 32.0 (3.0–77.0) months for the whole study population.
Table 1: Demographics and clinical features of the 262 HBV-related HCC patients at study entry
Variables |
Results |
|---|---|
Age (median (range)) y |
50.00 (19.00–77.00) |
Gender (male/female) |
230/32 |
HBV DNA (logIU/mL) |
3.97 ± 1.38 |
ALT (IU/L, median (range)) |
46.00 (5.00–970.00) |
AST (IU/L, median (range)) |
59.50 (6.50–1320.00) |
TBIL (μmol/L, median (range)) |
23.80 (1.35–763.15) |
ALB (g/L, median (range)) |
34.10 (19.30–54.20) |
AFP (< 200/≥ 200, n) |
145/117 |
Child-Pugh score (A/B/C, n) |
164/51/47 |
Tumor size (< 5 cm/≥ 5 cm, n) |
174/88 |
TNM stage (I/II/III/IV, n) |
75/83/91/13 |
Treatments (LT/SR/RF/TACE/ST/SS, n) |
2/52/55/74/2/77 |
Abbreviations: HCC, hepatocellular carcinoma; HBV, hepatitis B virus; ALT, alanine aminotransferase; AST, aspartate aminotransferase; TBIL, total bilirubin; ALB, albumin; AFP, α-fetoprotein; LT, liver transplantation; SR, surgical resection; RF, radiofrequency ablation; TACE, transcatheter arterial chemoembolization. ST, sorafenib treatment; SS, supportive and symptomatic treatment.
Association of PD1 and TIM3 polymorphisms with overall survival of HBV-related HCC patients
When all the 258 HBV-related HCC patients were included for the analysis of OS, Kaplan-Meier curve and log-rank test showed that patients with PD1 +8669 G allele-containing genotypes (AG+GG) had significantly longer survival time than those with PD1 +8669 genotype AA (P < 0.001, Figure 1A). The TIM3 –1516 genotype GG was also significantly associated with longer survival time compared with TIM3 –1516 T allele-containing genotypes (P = 0.001, Figure 1B). Higher albumin (ALB) and lower alpha-fetoprotein (AFP) levels, lower Child-Pugh score and lower TNM stage were also associated with longer OS (all P < 0.001, Supplementary Figure S1).
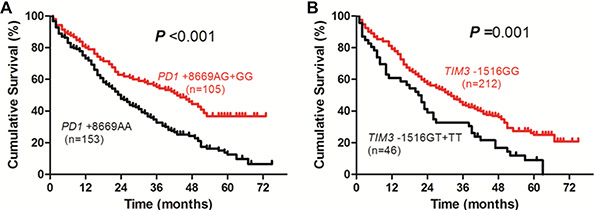
Figure 1: Overall survival curves of HBV-related HCC patients according to genotypes of PD1 +8669 A/G (A) or TIM3 –1516 G/T (B) polymorphisms estimated by Kaplan-Meier analysis and compared by the log-rank test.
When those patients were included for the analysis of factors associated with OS, univariate analysis showed that total bilirubin (TBIL), ALB, AFP, Child-Pugh score, tumor size, TNM stage, PD1 +8669 A/G and TIM3 –1516 G/T polymorphisms were significantly associated with patients’ survival (Table 2). In multivariate analysis, genotypes of PD1 +8669 A/G (hazard ratio (HR), 1.835; 95% confidence interval (CI), 1.342–2.509; P < 0.001) and TIM3 –1516 G/T (HR, 2.070; 95% CI, 1.428–3.002; P < 0.001) polymorphisms, together with gender (HR, 1.647; 95% CI, 1.013–2.676; P = 0.044), ALB (HR, 1.839; 95% CI, 1.306–2.588; P < 0.001), AFP (HR, 1.475; 95% CI, 1.073–2.027; P = 0.017), Child-Pugh score (HR, 1.735; 95% CI, 1.236–2.434; P = 0.001), and TNM stage (HR, 1.772; 95% CI, 1.277–2.459; P = 0.001), are significantly associated with the OS of the patients (Table 2).
Table 2: Univariate and multivariate analyses of factors associated with overall survival of the 258 HCC patients
|
No. of patients |
Overall survival (%) |
Univariate analysis |
Multivariate analysis |
|||
|---|---|---|---|---|---|---|---|
1 year |
3 year |
5 year |
P |
HR (95% CI) |
P |
||
Gender |
|
|
|
|
0.581 |
1.647 (1.013–2.676) |
0.044 |
Male |
227 |
75.3 |
41.0 |
26.4 |
|
|
|
Female |
31 |
80.6 |
48.4 |
25.8 |
|
|
|
Age (years) |
|
|
|
|
0.246 |
1.256 (0.927–1.703) |
0.142 |
≤ 50 |
136 |
80.1 |
46.3 |
27.9 |
|
|
|
> 50 |
122 |
71.3 |
36.9 |
24.6 |
|
|
|
HBV DNA (IU/mL) |
|
|
|
|
0.156 |
1.326 (0.965–1.821) |
0.081 |
≤ 104 |
94 |
78.7 |
47.9 |
30.9 |
|
|
|
> 104 |
164 |
74.4 |
38.4 |
23.8 |
|
|
|
ALT (IU/L) |
|
|
|
|
0.109 |
0.928 (0.637–1.351) |
0.697 |
≤ 40 |
111 |
82.9 |
46.8 |
30.6 |
|
|
|
> 40 |
147 |
70.7 |
38.1 |
23.1 |
|
|
|
AST (IU/L) |
|
|
|
|
0.055 |
1.202 (0.785–1.842) |
0.397 |
≤ 40 |
69 |
87.0 |
50.7 |
33.3 |
|
|
|
> 40 |
189 |
72.0 |
38.6 |
23.8 |
|
|
|
TBIL (μmol/L) |
|
|
|
|
< 0.001 |
1.088 (0.787–1.504) |
0.609 |
≤ 40 |
164 |
81.7 |
49.4 |
34.8 |
|
|
|
> 40 |
94 |
66.0 |
28.7 |
11.7 |
|
|
|
ALB (g/L) |
|
|
|
|
< 0.001 |
1.839 (1.306–2.588) |
< 0.001 |
≥ 35 |
120 |
87.5 |
59.2 |
44.2 |
|
|
|
< 35 |
138 |
65.9 |
26.8 |
10.9 |
|
|
|
AFP (ng/mL) |
|
|
|
|
< 0.001 |
1.475 (1.073–2.027) |
0.017 |
≥ 200 |
144 |
77.1 |
53.5 |
37.5 |
|
|
|
≥ 200 |
114 |
74.6 |
27.2 |
12.3 |
|
|
|
Child-Pugh score |
|
|
|
|
< 0.001 |
1.735 (1.236–2.434) |
0.001 |
A |
164 |
85.4 |
50.0 |
34.8 |
|
|
|
B + C |
94 |
59.6 |
27.7 |
11.7 |
|
|
|
Tumor size (cm) |
|
|
|
|
< 0.001 |
1.030 (0.735–1.445) |
0.862 |
< 5 |
172 |
77.3 |
50.6 |
33.1 |
|
|
|
≥ 5 |
86 |
73.3 |
24.4 |
12.8 |
|
|
|
TNM stage |
|
|
|
|
< 0.001 |
1.772 (1.277–2.459) |
0.001 |
I + II |
156 |
77.6 |
51.9 |
37.8 |
|
|
|
III + IV |
102 |
73.5 |
26.5 |
8.8 |
|
|
|
PD1 + 8669 |
|
|
|
|
< 0.001 |
1.835 (1.342–2.509) |
< 0.001 |
AG + GG |
105 |
80.0 |
55.2 |
42.9 |
|
|
|
AA |
153 |
73.2 |
32.7 |
15.0 |
|
|
|
TIM3 –1516 |
|
|
|
|
0.001 |
2.070 (1.428–3.002) |
< 0.001 |
GG |
212 |
79.2 |
43.9 |
30.7 |
|
|
|
GT +TT |
46 |
60.9 |
32.6 |
6.5 |
|
|
|
Abbreviations: HCC, hepatocellular carcinoma; HR, hazard ratio; CI, confidence interval; HBV, hepatitis B virus; ALT, alanine aminotransferase; AST, aspartate aminotransferase; TBIL, total bilirubin; ALB, albumin; AFP, alpha-fetoprotein.
Association of PD1 and TIM3 polymorphisms with overall survival of HBV-related HCC patients according to treatments
In patients receiving surgical (tumor resection or radiofrequency ablation) treatment, the survival time of patients with PD1 +8669 G allele-containing genotypes was significantly longer than those with PD1 +8669 genotype AA (P = 0.018, Figure 2A). The survival time of patients with TIM3 –1516 genotype GG was also longer than those with TIM3 –1516 T allele-containing genotypes although the difference was not statistically significant (P = 0.096, Figure 2B). In addition, patients who had younger age and higher ALB and lower AFP levels also had longer OS (P = 0.036, P < 0.001 and P = 0.007, respectively, Supplementary Figure S2). Univariate analysis showed that age, TBIL, ALB, AFP, Child-Pugh score, TNM stage, PD1 +8669 A/G and TIM3 –1516 G/T polymorphisms were significantly associated with OS of the patients (Table 3). Multivariate analysis showed that PD1 +8669 genotypes AG+GG (HR, 2.092; 95% CI, 1.218–3.593; P = 0.007) and TIM3 –1516 genotype GG (HR, 2.370; 95% CI, 1.283–4.378; P = 0.006), together with younger age (HR, 2.358; 95% CI, 1.392–3.995; P = 0.001), higher ALB level (HR, 1.854; 95% CI, 1.117–3.076; P = 0.017), lower AFP level (HR, 1.793; 95% CI, 1.076–2.986; P = 0.025), were significantly associated with longer OS of the patients (Table 3).
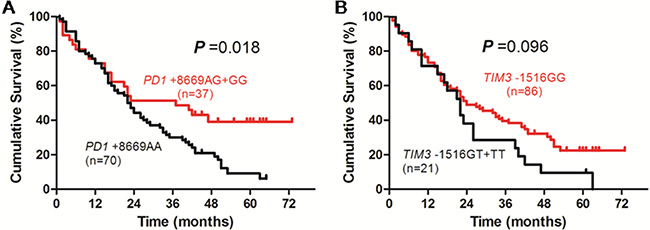
Figure 2: Overall survival curves of HBV-related HCC patients receiving surgical (resection or radiofrequency ablation) treatment according to genotypes of PD1 +8669 A/G (A) or TIM3 –1516 G/T (B) polymorphisms estimated by Kaplan-Meier analysis and compared by the log-rank test.
Table 3: Univariate and multivariate analyses of factors associated with overall survival of the 107 HCC patients receiving surgical (tumor resection or radiofrequency ablation) treatment
|
No. of patients |
Overall Survival (%) |
Univariate analysis |
Multivariate analysis |
|||
|---|---|---|---|---|---|---|---|
1 year |
3 year |
5 year |
P |
HR (95% CI) |
P |
||
Gender |
|
|
|
|
0.780 |
1.350 (0.646–2.818) |
0.425 |
Male |
92 |
72.8 |
37.0 |
22.8 |
|
|
|
Female |
15 |
73.3 |
40.0 |
20.0 |
|
|
|
Age (years) |
|
|
|
|
0.036 |
2.358 (1.392–3.995) |
0.001 |
≤ 50 |
49 |
87.8 |
51.0 |
28.6 |
|
|
|
> 50 |
58 |
60.3 |
25.9 |
17.2 |
|
|
|
HBV DNA (IU/mL) |
|
|
|
|
0.316 |
1.297 (0.789–2.129) |
0.305 |
≤ 104 |
37 |
73.0 |
43.2 |
27.0 |
|
|
|
> 104 |
70 |
72.9 |
34.3 |
20.0 |
|
|
|
ALT (IU/L) |
|
|
|
|
0.345 |
0.773 (0.423–1.414) |
0.404 |
≤ 40 |
43 |
79.1 |
39.5 |
25.6 |
|
|
|
> 40 |
64 |
68.8 |
35.9 |
20.3 |
|
|
|
AST (IU/L) |
|
|
|
|
0.149 |
1.087 (0.540–2.185) |
0.816 |
≤ 40 |
26 |
80.8 |
46.2 |
30.8 |
|
|
|
> 40 |
81 |
70.4 |
34.6 |
19.8 |
|
|
|
TBIL (μmol/L) |
|
|
|
|
0.003 |
1.196 (0.711–2.010) |
0.500 |
≤ 40 |
69 |
78.3 |
44.9 |
30.4 |
|
|
|
> 40 |
38 |
63.2 |
23.7 |
7.9 |
|
|
|
ALB (g/L) |
|
|
|
|
< 0.001 |
1.854 (1.117–3.076) |
0.017 |
≥ 35 |
49 |
83.7 |
53.1 |
36.7 |
|
|
|
< 35 |
58 |
63.8 |
24.1 |
10.3 |
|
|
|
AFP (ng/mL) |
|
|
|
|
0.007 |
1.793 (1.076–2.986) |
0.025 |
< 200 |
58 |
74.1 |
50.0 |
34.5 |
|
|
|
≥ 200 |
49 |
71.4 |
22.4 |
8.2 |
|
|
|
Child-Pugh score |
|
|
|
|
0.001 |
1.447 (0.815–2.569) |
0.207 |
A |
61 |
80.3 |
45.9 |
31.1 |
|
|
|
B + C |
46 |
63.0 |
26.1 |
10.9 |
|
|
|
Tumor size (cm) |
|
|
|
|
0.081 |
0.782 (0.450–1.359) |
0.382 |
< 5 |
69 |
73.9 |
44.9 |
29.0 |
|
|
|
≥ 5 |
38 |
71.1 |
23.7 |
10.5 |
|
|
|
TNM stage |
|
|
|
|
0.018 |
1.680 (0.981–2.877) |
0.059 |
I + II |
68 |
73.5 |
47.1 |
29.4 |
|
|
|
III+IV |
39 |
71.8 |
20.5 |
10.3 |
|
|
|
PD1 +8669 |
|
|
|
|
0.018 |
2.092 (1.218–3.593) |
0.007 |
AG + GG |
37 |
73.0 |
51.4 |
40.5 |
|
|
|
AA |
70 |
72.9 |
30.0 |
12.9 |
|
|
|
TIM3 –1516 |
|
|
|
|
0.096 |
2.370 (1.283–4.378) |
0.006 |
GG |
86 |
73.3 |
39.5 |
26.7 |
|
|
|
GT + TT |
21 |
71.4 |
28.6 |
4.8 |
|
|
|
Abbreviations: HCC, hepatocellular carcinoma; HR, hazard ratio; CI, confidence interval; HBV, hepatitis B virus; ALT, alanine aminotransferase; AST, aspartate aminotransferase; TBIL, total bilirubin; ALB, albumin; AFP, alpha-fetoprotein.
In patients receiving TACE, the survival time of patients with PD1 +8669 G allele-containing genotypes was significantly longer than those with PD1 +8669 genotype AA (P = 0.046, Figure 3A). The survival time of patients with TIM3 –1516 genotype GG was significantly longer than those with TIM3 –1516 T allele-containing genotypes (P = 0.030, Figure 3B). Patients who had higher ALB level, lower Child-Pugh score and lower TNM stage also had longer OS (P < 0.001, P = 0.003 and P = 0.004, respectively, Supplementary Figure S3). Univariate analysis showed that ALB level, Child-Pugh score, tumor size, TNM stage, PD1 +8669 A/G and TIM3 –1516 G/T polymorphisms were associated with OS of the patients (Table 4). Multivariate analysis showed that PD1 +8669 genotypes AG+GG (HR, 3.042; 95% CI, 1.470–6.294; P = 0.003) and TIM3 –1516 genotype GG (HR, 2.055; 95% CI, 1.053–4.010; P = 0.035), together with higher ALB level (HR, 2.479; 95% CI, 1.083–5.672; P = 0.032), lower Child-Pugh score (HR, 2.701; 95% CI, 1.277–5.711; P = 0.009) and TNM stage (HR, 2.863; 95% CI, 1.034–7.930; P = 0.043), were significantly associated with longer OS of the patients (Table 4).
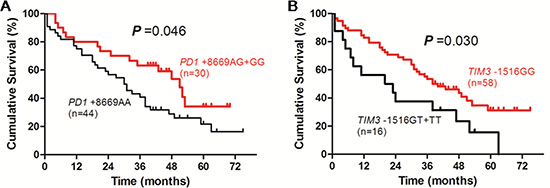
Figure 3: Overall survival curves of HBV-related HCC patients receiving transcatheter arterial chemoembolization according to genotypes of PD1 +8669 A/G (A) or TIM3 –1516 G/T (B) polymorphisms estimated by Kaplan-Meier analysis and compared by the log-rank test.
Table 4: Univariate and multivariate analyses of factors associated with overall survival of the 74 HCC patients receiving transcatheter arterial chemoembolization
|
No. of patients |
Overall Survival (%) |
Univariate analysis |
Multivariate analysis |
|||
|---|---|---|---|---|---|---|---|
1 year |
3 year |
5 year |
P |
HR (95%CI) |
P |
||
Gender |
|
|
|
|
0.117 |
2.869 (0.796–10.343) |
0.107 |
Male |
66 |
87.5 |
75.0 |
28.8 |
|
|
|
Female |
8 |
75.8 |
47.0 |
62.5 |
|
|
|
Age (years) |
|
|
|
|
0.485 |
1.169 (0.584–2.340) |
0.658 |
≤ 50 |
46 |
78.3 |
52.2 |
32.6 |
|
|
|
> 50 |
28 |
75.0 |
46.4 |
32.1 |
|
|
|
HBV DNA (IU/mL) |
|
|
|
|
0.089 |
0.769 (0.408–1.447) |
0.415 |
≤ 104 |
24 |
75.0 |
41.7 |
20.8 |
|
|
|
> 104 |
50 |
78.0 |
54.0 |
38.0 |
|
|
|
ALT (IU/L) |
|
|
|
|
0.266 |
0.664 (0.278–1.588) |
0.358 |
≤ 40 |
34 |
85.3 |
55.9 |
38.2 |
|
|
|
> 40 |
40 |
70.0 |
45.0 |
27.5 |
|
|
|
AST (IU/L) |
|
|
|
|
0.247 |
2.273 (0.869–5.945) |
0.094 |
≤ 40 |
18 |
94.4 |
55.6 |
44.4 |
|
|
|
> 40 |
56 |
71.4 |
48.2 |
28.6 |
|
|
|
TBIL (μmol/L) |
|
|
|
|
0.072 |
1.491 (0.691–3.219) |
0.309 |
≤ 40 |
54 |
81.5 |
55.6 |
37.0 |
|
|
|
> 40 |
20 |
65.0 |
35.0 |
20.0 |
|
|
|
ALB (g/L) |
|
|
|
|
< 0.001 |
2.479 (1.083–5.672) |
0.032 |
≥ 35 |
37 |
66.7 |
35.1 |
13.5 |
|
|
|
< 35 |
37 |
86.5 |
64.9 |
51.4 |
|
|
|
AFP (ng/mL) |
|
|
|
|
0.137 |
0.740 (0.355–1.544) |
0.423 |
< 200 |
45 |
80.0 |
53.3 |
42.2 |
|
|
|
≥ 200 |
29 |
72.4 |
44.8 |
17.2 |
|
|
|
Child-Pugh score |
|
|
|
|
0.003 |
2.701 (1.277–5.711) |
0.009 |
A |
55 |
85.5 |
56.4 |
36.4 |
|
|
|
B + C |
19 |
52.6 |
31.6 |
21.1 |
|
|
|
Tumor size (cm) |
|
|
|
|
0.009 |
0.906 (0.303–2.709) |
0.860 |
< 5 |
52 |
80.8 |
59.6 |
40.4 |
|
|
|
≥ 5 |
22 |
68.2 |
27.3 |
13.6 |
|
|
|
TNM stage |
|
|
|
|
0.004 |
2.863 (1.034–7.930) |
0.043 |
I + II |
49 |
81.6 |
59.2 |
42.9 |
|
|
|
III + IV |
25 |
68.0 |
32.0 |
12.0 |
|
|
|
PD1 +8669 |
|
|
|
|
0.046 |
3.042 (1.470–6.294) |
0.003 |
AG + GG |
30 |
80.0 |
63.3 |
46.7 |
|
|
|
AA |
44 |
75.0 |
40.9 |
22.7 |
|
|
|
TIM3 –1516 |
|
|
|
|
0.030 |
2.055 (1.053–4.010) |
0.035 |
GG |
58 |
82.8 |
53.4 |
37.9 |
|
|
|
GT + TT |
16 |
56.2 |
37.5 |
12.5 |
|
|
|
Abbreviations: HCC, hepatocellular carcinoma; HR, hazard ratio; CI, confidence interval; HBV, hepatitis B virus; ALT, alanine aminotransferase; AST, aspartate aminotransferase; TBIL, total bilirubin; ALB, albumin; AFP, alpha-fetoprotein.
In patients receiving supportive and symptomatic treatment, the OS of patients with PD1 +8669 G allele-containing genotypes was significantly longer than those with PD1 +8669 genotype AA (P = 0.015, Figure 4A). The OS of patients with TIM3 –1516 genotype GG was longer than those with TIM3 –1516 T allele-containing genotypes although it was not statistically significant (P = 0.052, Figure 4B). Patients who had lower HBV DNA level, higher ALB level, lower Child-Pugh score and TNM stage also had longer OS (P = 0.001, P < 0.001, P = 0.002 and P = 0.008, respectively, Supplementary Figure S4). Univariate analysis showed that HBV DNA, TBIL, ALB and AFP levels, Child-Pugh score, TNM stage and PD1 +8669 A/G polymorphism were associated with OS of the patients (Table 5). The TIM3 –1516 G/T polymorphism was marginally associated with OS of the patients (P = 0.052, Table 5). Multivariate analysis showed that PD1 +8669 genotypes AG+GG (HR, 1.909; 95% CI, 1.011–3.602; P = 0.046), together with lower HBV DNA level (HR, 1.984; 95% CI, 1.031–3.817; P = 0.040), higher ALB level (HR, 2.329; 95% CI, 1.156–4.692; P = 0.018), lower Child-Pugh score (HR, 2.064; 95% CI, 1.032–4.127; P = 0.040) and lower TNM stage (HR, 2.168; 95% CI, 1.174–4.003; P = 0.013), were significantly associated with longer OS of the patients (Table 5). The TIM3 –1516 genotype GG was not significantly associated with OS of the patients (HR, 1.790; 95% CI, 0.744–4.308; P = 0.194, Table 5).
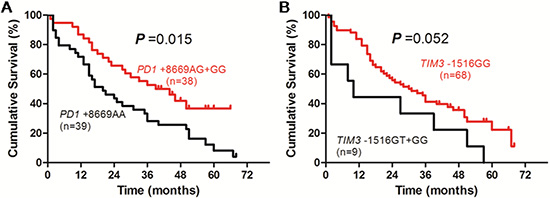
Figure 4: Overall survival curves of HBV-related HCC patients receiving supportive care and symptomatic treatment according to genotypes of PD1 +8669 A/G (A) or TIM3 –1516 G/T (B) polymorphisms estimated by Kaplan-Meier analysis and compared by the log-rank test.
Table 5: Univariate and multivariate analyses of factors associated with overall survival of the 77 HCC patients receiving supportive and symptomatic treatment
|
No. of patients |
Overall Survival (%) |
Univariate analysis |
Multivariate analysis |
|||
|---|---|---|---|---|---|---|---|
1 year |
3 year |
5 year |
P |
HR (95% CI) |
P |
||
Gender |
|
|
|
|
0.267 |
1.618 (0.621–4.217) |
0.325 |
Male |
69 |
78.3 |
40.6 |
29.0 |
|
|
|
Female |
8 |
87.5 |
37.5 |
0 |
|
|
|
Age (years) |
|
|
|
|
0.135 |
0.724 (0.388–1.351) |
0.310 |
≤ 50 |
41 |
73.2 |
34.1 |
22.0 |
|
|
|
> 50 |
36 |
86.1 |
47.2 |
30.6 |
|
|
|
HBV DNA (IU/mL) |
|
|
|
|
0.001 |
1.984 (1.031–3.817) |
0.040 |
≤ 104 |
33 |
87.9 |
57.6 |
42.4 |
|
|
|
> 104 |
44 |
72.7 |
27.3 |
13.6 |
|
|
|
ALT (IU/L) |
|
|
|
|
0.716 |
0.868 (0.404–1.865) |
0.716 |
≤ 40 |
34 |
85.3 |
47.1 |
29.4 |
|
|
|
> 40 |
43 |
74.4 |
34.9 |
23.3 |
|
|
|
AST (IU/L) |
|
|
|
|
0.570 |
1.659 (0.685–4.018) |
0.262 |
≤ 40 |
25 |
88.0 |
52.0 |
28.0 |
|
|
|
> 40 |
52 |
75.0 |
34.6 |
25.0 |
|
|
|
TBIL (μmol/L) |
|
|
|
|
0.037 |
0.682 (0.345–1.349) |
0.271 |
≤ 40 |
41 |
87.8 |
48.8 |
39.0 |
|
|
|
> 40 |
36 |
69.4 |
30.6 |
11.1 |
|
|
|
ALB (g/L) |
|
|
|
|
< 0.001 |
2.329 (1.156–4.692) |
0.018 |
≥ 35 |
34 |
94.1 |
61.8 |
47.1 |
|
|
|
< 35 |
43 |
67.4 |
23.3 |
9.3 |
|
|
|
AFP (ng/mL) |
|
|
|
|
0.017 |
1.444 (0.720–2.899) |
0.301 |
< 200 |
41 |
78.0 |
58.5 |
36.6 |
|
|
|
≥ 200 |
36 |
80.6 |
19.4 |
13.9 |
|
|
|
Child-Pugh score |
|
|
|
|
0.002 |
2.064 (1.032–4.127) |
0.040 |
A |
48 |
91.7 |
47.9 |
37.5 |
|
|
|
B + C |
29 |
58.6 |
27.6 |
6.9 |
|
|
|
Tumor size (cm) |
|
|
|
|
0.067 |
1.448 (0.756–2.772) |
0.264 |
< 5 |
51 |
78.4 |
49.0 |
31.4 |
|
|
|
≥ 5 |
26 |
80.8 |
23.1 |
15.4 |
|
|
|
TNM stage |
|
|
|
|
0.008 |
2.168 (1.174–4.003) |
0.013 |
I + II |
39 |
79.5 |
51.3 |
46.2 |
|
|
|
III + IV |
38 |
78.9 |
28.9 |
5.3 |
|
|
|
PD1 +8669 |
|
|
|
|
0.015 |
1.909 (1.011–3.602) |
0.046 |
AG + GG |
38 |
86.8 |
52.6 |
42.1 |
|
|
|
AA |
39 |
71.9 |
28.2 |
10.3 |
|
|
|
TIM3 –1516 |
|
|
|
|
0.052 |
1.790 (0.744–4.308) |
0.194 |
GG |
68 |
83.8 |
41.2 |
29.4 |
|
|
|
GT + TT |
9 |
44.4 |
33.3 |
0 |
|
|
|
Abbreviations: HCC, hepatocellular carcinoma; HR, hazard ratio; CI, confidence interval; HBV, hepatitis B virus; ALT, alanine aminotransferase; AST, aspartate aminotransferase; TBIL, total bilirubin; ALB, albumin; AFP, alpha-fetoprotein.
DISCUSSION
This prospective study found that PD1 +8669 G/A and TIM3 –1516 G/T polymorphisms were associated with the OS of HBV-related HCC patients. Specifically, PD1 +8669 genotypes AG+GG were significantly associated with longer OS of the patients when the whole patients included in the final analysis or the patients according to treatments were analyzed. Furthermore, multivariate analysis in the whole patients included in the final analysis and in patients receiving different treatments confirmed that PD1 +8669 A/G polymorphism was an independent factor associated with OS of the patients. For TIM3 –1516 G/T polymorphisms, the genotype GG was significantly associated with longer OS when the whole patients included in the final analysis or patients receiving TACE were analyzed. In patients receiving surgical (tumor resection or radiofrequency ablation) treatment, multivariate analysis showed that TIM3 –1516 genotype GG was also an independent factor significantly associated with longer OS of the patients. In patients receiving supportive and symptomatic treatment, TIM3 –1516 genotype GG was not shown to be significantly associated with the OS of the patients possibly because of the relatively small number of patients in this subgroup.
The basis for the associations found in this study may relate to the recognized ability of PD-1 and TIM-3 to inhibit T-cell mediated antiviral and antitumor immunity as well as the functional relevance of these polymorphisms. PD-1 and TIM-3 overexpression in relation to T-cell dysfunction and exhaustion in chronic HBV infection and HCC development [5–9] and in predicting the outcome and the disease progression of HBV infection [10–12] and the prognosis of HCC [9, 13] have been demonstrated in many studies. Consistent with the associations found in this study, PD1 +8669 genotypes GG and AG, which were related to longer OS of the HBV-related HCC patients, were associated with lower PD-1 mRNA levels [12] and the downregulation of PD-1 expression and upregulation of tumor necrosis factor (TNF)-α and interferon (IFN)-γ in patients with chronic HBV infection through interaction with miR-4717 [19]. For TIM3 polymorphisms, the polymorphic variants of TIM3 and the type of TIM-3-expressing cells including TIM-3-expressing dendritic cells, macrophages, and T cells were revealed to affect the recognition of apoptotic cells and the immune responsiveness [20]. The TIM3 –1516 genotype GG, which was generally related to longer OS of the HBV-related HCC patients in this study, was suggestively associated with the downregulation of TIM-3 expression in chronic HBV infection [17] and lower tumor grade and less frequent lymph node metastasis in HBV-related HCC [17].
Blockade of immune checkpoint proteins including PD-1 and TIM-3 has been emerging as a promising therapeutic approach for various malignancies including HCC [21]. In patients with acute alcoholic hepatitis, blocking PD-1 and TIM-3 could reverse T-cell production of IFN-γ, reduce the numbers of interleukin 10-producing T cells, and increase antibacterial immune responses impaired in this condition [22].
Coexpression of PD-1 and TIM-3 was associated with more severe CD8 T cell exhaustion in mice with chronic viral infection or bearing solid tumors [23, 24]. Combined targeting of the PD-1 and TIM-3 pathways was revealed to be more effective in improving CD8 T cell responses and viral control in chronically viral infected mice [23] and in controlling tumor growth in solid tumor-bearing mice [24]. In colon carcinoma tumor-bearing mice, the combinatorial blockade of PD-1 and TIM-3 pathways was shown to be synergistic with a remarkable antitumor effect [25]. Therefore, combined blockade of PD-1 and TIM-3 pathways has shown very promising potential in the immunotherapy of chronic viral infection and tumors.
Blockade of immune checkpoint such as PD-1 or TIM-3 represents effective and promising immunotherapy for cancer. However, a lot of cancer patients failed to respond to the PD-1 pathway blockades. Furthermore, these new immunotherapies may generate so called immune-related adverse events (IRAEs) due to unbalancing the immune system [26]. Therefore, immunotherapy by immune checkpoint blockade is confronted with novel challenges in selecting patient populations, monitoring clinical responses, and predicting IRAEs [27]. Some parameters such as the overexpression of PD ligand 1 (PD-L1) and tumor-infiltrating immune cells and molecules are currently explored predictive biomarkers for the response to PD-1 pathway blockade. However, these biomarkers can not be used to accurately select patients for PD-1 pathway blockade due to the low prediction accuracy and dynamic changes [28, 29]. Based on the significant associations of PD1 and TIM3 polymorphisms with the OS of HBV-related HCC patients presented in this study, together with their role in chronic HBV infection and HBV-related HCC as well as the functional relevance to immune responses, it is reasonable to hypothesize that the determination of PD1 +8669 A/G and TIM3 –1516 G/T polymorphisms may be potential immunogenetic biomarkers for selecting appropriate patients, designing personalized strategy such as mono or dual checkpoint blockade and monitoring clinical responses, or even predicting IRAEs when the immunotherapy by blocking PD-1 and TIM-3 pathway, alone or dually, is administered clinically.
This study has some limitations. The sample size of patient population studied is relatively small. There is a lack of a validation patient population. The study population is limited to Chinese Han patients. The study did not analyze the association of the polymorphisms examined with the disease free survival (DFS) of the patients because of the inability to accurately obtain the DFS data in all the patients studied. All these limitations may compromise the validity of the findings. Therefore, replicative studies with larger sample size of populations with various ethnic backgrounds and accurately collected DFS and OS data are warranted to validate these findings.
In conclusion, this study, for the first time to our knowledge, showed that PD1 +8669 A/G and TIM3 –1516 G/T polymorphisms are associated with the OS of HBV-related HCC patients. These findings might have potential implications for selecting appropriate patients, designing personalised strategy of immunotherapy with checkpoint blockade, monitoring clinical responses, and predicting immune adverse events when the immunotherapy by blocking PD-1 and TIM-3 pathway, alone or dually, is clinically administered.
MATERIALS AND METHODS
Patients
A total of 262 HBV-related HCC patients were recruited from the First Affiliated Hospital of Xi’an Jiaotong University between January 1, 2009 to June 30, 2010. The diagnosis of HBV-related HCC was established based on the serological positivity for HBsAg, HBeAg or anti-HBe and anti-HBc for more than 6 months and either pathological examination of liver tissue of surgery or characteristics of HCC image of angiography, ultrasonography and computerized tomography (CT) and/or magnetic resonance imaging (MRI). The underlying cirrhosis of the patients was diagnosed according to the pathology of cirrhosis in liver tissue of surgery, or the presence of abnormal liver function, portal hypertension with ascites and esophageal varices, characteristics of liver cirrhosis image and splenomegaly on ultrasonography and/or CT and MRI [30]. The demographic and clinical data were collected in all the patients at the diagnosis of HCC. The tumor grade, size and metastasis were determined at diagnosis and might be confirmed in some cases after liver transplantation, tumor resection, radiofrequency ablation, or transcatheter arterial chemoembolization (TACE) for those who received corresponding treatment interventions. Patients with other severe diseases and comorbidities unrelated to HCC were excluded. All the patients included were adult of Han nationality and unrelated in kinship. The study was performed in accordance with Declaration of Helsinki and the protocol was approved by the Ethics Committee of the First Affiliated Hospital of Xi’an Jiaotong University. Informed consent was obtained from all the patients.
Treatments and follow-up
Of the 262 HBV-related HCC patients, 4 patients (2 received liver transplantation and 2 received sorafenib) were excluded from the survival analysis because of the small number of patients in these treatments. The remaining 258 patients were included in the final analysis. Of these 258 patients, 52 patients underwent tumor resection, 55 patients received radiofrequency ablation, 74 patients received TACE and 77 patients received supportive and symptomatic treatment. Because of the relatively small number of patients and the comparable overall survival between hepatic resection and radiofrequency ablation in early stage HCC [31, 32], we combined the patients who underwent tumor resection and radiofrequency ablation as 1 group of treatment, surgical treatment (107 patients), in the analysis. The demographic and clinical data in the patients were obtained at the establishment of HBV-related HCC diagnosis. The data of therapy were recorded in each patient and the survival data of the patients were prospectively collected until June 30, 2015.
Genotyping of PD1 and TIM3 polymorphisms
Genomic DNA was extracted from whole blood using TIANamp Genomic DNA Kit (Tiangen Biotech (Beijing) Co., Ltd., China) according to the manufacturer’s instruction. Genotyping of PD1 +8669 G/A (rs10204525) and TIM3 –1516 G/T (rs10053538) polymorphisms was carried out by bidirectional polymerase chain reaction (PCR) amplification of specific alleles (Bi-PASA) and PCR-restriction fragment length polymorphism, respectively, as described elsewhere [16, 17].
Statistical analysis
Statistical analyses were carried out using a SPSS16.0 software (SPSS Inc., Chicago, IL, USA). Data were expressed as the median (range). Survival duration of the patients was defined as the period from the date of first diagnosis of HCC to the date of death (clinical endpoint) or the date of last follow-up (censored). Age, gender, HBV DNA, alanine aminotransferase (ALT), aspartate aminotransferase (AST), TBIL, ALB, Child-Pugh grade, tumor size, TNM stage and AFP at HCC diagnosis and genotypes of PD1 +8669 G/A and TIM3 –1516 G/T polymorphisms were included as candidate factors for the OS of the patients. Overall survival differences in the patients were analyzed by Kaplan-Meier curve and compared by log-rank test. Cox regression was used to perform multiple analyses to identify factors associated with the OS of the patients and to estimate the HR and its 95% CI. The statistical tests were two-sided and the significance was set at P value < 0.05.
ACKNOWLEDGMENTS
We thank Dr. Guoyu Zhang, Dr. Qianqian Zhu, Dr. Pingping Zhang and Professor Yanping Chen for their help during this study.
CONFLICTS OF INTEREST
The authors disclose no potential conflicts of interest.
GRANT SUPPORT
This work was supported by the National Natural Science Foundation of China (Grant no. 81371798).
REFERENCES
1. Torre LA, Bray F, Siegel RL, Ferlay J, Lortet-Tieulent J, Jemal A. Global cancer statistics, 2012. CA Cancer J Clin. 2015; 65:87–108.
2. de Martel C, Maucort-Boulch D, Plummer M, Franceschi S. World-wide relative contribution of hepatitis B and C viruses in hepatocellular carcinoma. Hepatology. 2015; 62:1190–200.
3. Zhu Q, Li N, Zeng X, Han Q, Li F, Yang C, Lv Y, Zhou Z, Liu Z. Hepatocellular carcinoma in a large medical center of China over a 10-year period: evolving therapeutic option and improving survival. Oncotarget. 2015; 6:4440–50. doi: 10.18632/oncotarget.2913.
4. Kim PS, Ahmed R. Features of responding T cells in cancer and chronic infection. Curr Opin Immunol. 2010; 22:223–30.
5. Boni C, Fisicaro P, Valdatta C, Amadei B, Di Vincenzo P, Giuberti T, Laccabue D, Zerbini A, Cavalli A, Missale G, Bertoletti A, Ferrari C. Characterization of hepatitis B virus (HBV)-specific T-cell dysfunction in chronic HBV infection. J Virol. 2007; 81:4215–25.
6. Fisicaro P, Valdatta C, Massari M, Loggi E, Biasini E, Sacchelli L, Cavallo MC, Silini EM, Andreone P, Missale G, Ferrari C. Antiviral intrahepatic T-cell responses can be restored by blocking programmed death-1 pathway in chronic hepatitis B. Gastroenterology. 2010; 138:682–93, 693.e1–4.
7. Isogawa M, Chung J, Murata Y, Kakimi K, Chisari FV. CD40 activation rescues antiviral CD8+ T cells from PD-1-mediated exhaustion. PLoS Pathog. 2013; 9:e1003490.
8. Nebbia G, Peppa D, Schurich A, Khanna P, Singh HD, Cheng Y, Rosenberg W, Dusheiko G, Gilson R, ChinAleong J, Kennedy P, Maini MK. Upregulation of the Tim-3/galectin-9 pathway of T cell exhaustion in chronic hepatitis B virus infection. PLoS One. 2012; 7:e47648.
9. Li H, Wu K, Tao K, Chen L, Zheng Q, Lu X, Liu J, Shi L, Liu C, Wang G, Zou W. Tim-3/galectin-9 signaling pathway mediates T-cell dysfunction and predicts poor prognosis in patients with hepatitis B virus-associated hepatocellular carcinoma. Hepatology. 2012; 56:1342–51.
10. Zhang Z, Zhang JY, Wherry EJ, Jin B, Xu B, Zou ZS, Zhang SY, Li BS, Wang HF, Wu H, Lau GK, Fu YX, Wang FS. Dynamic programmed death 1 expression by virus-specific CD8 T cells correlates with the outcome of acute hepatitis B. Gastroenterology. 2008; 134:1938–49, 1949.e1–3.
11. Wu W, Shi Y, Li J, Chen F, Chen Z, Zheng M. Tim-3 expression on peripheral T cell subsets correlates with disease progression in hepatitis B infection. Virol J. 2011; 8:113.
12. Zhang G, Li N, Zhang P, Li F, Yang C, Zhu Q, Han Q, Lv Y, Zhou Z, Liu Z. PD-1 mRNA expression is associated with clinical and viral profile and PD1 3′-untranslated region polymorphism in patients with chronic HBV infection. Immunol Lett. 2014; 162:212–6.
13. Shi F, Shi M, Zeng Z, Qi RZ, Liu ZW, Zhang JY, Yang YP, Tien P, Wang FS. PD-1 and PD-L1 upregulation promotes CD8 (+) T-cell apoptosis and postoperative recurrence in hepatocellular carcinoma patients. Int J Cancer. 2011; 128:887–96.
14. Bengsch B, Martin B, Thimme R. Restoration of HBV-specific CD8+ T cell function by PD-1 blockade in inactive carrier patients is linked to T cell differentiation. J Hepatol. 2014; 61:1212–9.
15. Wu W, Shi Y, Li S, Zhang Y, Liu Y, Wu Y, Chen Z. Blockade of Tim-3 signaling restores the virus-specific CD8+ T-cell response in patients with chronic hepatitis B. Eur J Immunol. 2012; 42:1180–91.
16. Zhang G, Liu Z, Duan S, Han Q, Li Z, Lv Y, Chen J, Lou S, Li N. Association of polymorphisms of programmed cell death-1 gene with chronic hepatitis B virus infection. Hum Immunol. 2010; 71:1209–13.
17. Li Z, Liu Z, Zhang G, Han Q, Li N, Zhu Q, Lv Y, Chen J, Xing F, Wang Y, Li F. TIM3 gene polymorphisms in patients with chronic hepatitis B virus infection: impact on disease susceptibility and hepatocellular carcinoma traits. Tissue Antigens. 2012; 80:151–7.
18. Li Z, Li N, Zhu Q, Zhang G, Han Q, Zhang P, Xun M, Wang Y, Zeng X, Yang C, Liu Z. Genetic variations of PD1 and TIM3 are differentially and interactively associated with the development of cirrhosis and HCC in patients with chronic HBV infection. Infect Genet Evol. 2013; 14:240–6.
19. Zhang G, Li N, Li Z, Zhu Q, Li F, Yang C, Han Q, Lv Y, Zhou Z, Liu Z. microRNA-4717 differentially interacts with its polymorphic target in the PD1 3’ untranslated region: A mechanism for regulating PD-1 expression and function in HBV-associated liver diseases. Oncotarget. 2015; 6:18933–44. doi: 10.18632/oncotarget.3662.
20. DeKruyff RH, Bu X, Ballesteros A, Santiago C, Chim YL, Lee HH, Karisola P, Pichavant M, Kaplan GG, Umetsu DT, Freeman GJ, Casasnovas JM. T cell/transmembrane, Ig, and mucin-3 allelic variants differentially recognize phosphatidylserine and mediate phagocytosis of apoptotic cells. J Immunol. 2010; 184:1918–30.
21. Hato T, Goyal L, Greten TF, Duda DG, Zhu AX. Immune checkpoint blockade in hepatocellular carcinoma: current progress and future directions. Hepatology. 2014; 60:1776–82.
22. Markwick LJ, Riva A, Ryan JM, Cooksley H, Palma E, Tranah TH, Manakkat Vijay GK, Vergis N, Thursz M, Evans A, Wright G, Tarff S, O’Grady J, et al. Blockade of PD1 and TIM3 restores innate and adaptive immunity in patients with acute alcoholic hepatitis. Gastroenterology. 2015; 148:590–602.e10.
23. Jin HT, Anderson AC, Tan WG, West EE, Ha SJ, Araki K, Freeman GJ, Kuchroo VK, Ahmed R. Cooperation of Tim-3 and PD-1 in CD8 T-cell exhaustion during chronic viral infection. Proc Natl Acad Sci U S A. 2010; 107:14733–8.
24. Sakuishi K, Apetoh L, Sullivan JM, Blazar BR, Kuchroo VK, Anderson AC. Targeting Tim-3 and PD-1 pathways to reverse T cell exhaustion and restore anti-tumor immunity. J Exp Med. 2010; 207:2187–94.
25. Hervas-Stubbs S, Soldevilla MM, Villanueva H, Mancheño U, Bendandi M, Pastor F. Identification of TIM3 2′-fluoro oligonucleotide aptamer by HT-SELEX for cancer immunotherapy. Oncotarget. 2016; 7:4522–30. doi: 10.18632/oncotarget.6608.
26. Michot JM, Bigenwald C, Champiat S, Collins M, Carbonnel F, Postel-Vinay S, Berdelou A, Varga A, Bahleda R, Hollebecque A, Massard C, Fuerea A, Ribrag V, et al. Immune-related adverse events with immune checkpoint blockade: a comprehensive review. Eur J Cancer. 2016; 54:139–48.
27. Choudhury N, Nakamura Y. The importance of immunopharmacogenomics in cancer treatment: Patient Selection and Monitoring for Immune Checkpoint Antibodies. Cancer Sci. 2016; 107:107–15. doi: 10.1111/cas.12862.
28. Meng X, Huang Z, Teng F, Xing L, Yu J. Predictive biomarkers in PD-1/PD-L1 checkpoint blockade immunotherapy. Cancer Treat Rev. 2015; 41:868–76. doi: 10.1016/j.ctrv.2015.11.001.
29. Dong ZY, Wu SP, Liao RQ, Huang SM, Wu YL. Potential biomarker for checkpoint blockade immunotherapy and treatment strategy. Tumour Biol. 2016. Doi: 10.1007/s13277–016–4812–9.
30. Duan S, Zhang G, Han Q, Li Z, Liu Z, Chen J, Lv Y, Li N, Wang Y, Li M, Lou S, Yang M, Zhu Q, et al. CTLA-4 exon 1 +49 polymorphism alone and in a haplotype with -318 promoter polymorphism may confer susceptibility to chronic HBV infection in Chinese Han patients. Mol Biol Rep. 2011; 38:5125–32.
31. Wang JH, Wang CC, Hung CH, Chen CL, Lu SN. Survival comparison between surgical resection and radiofrequency ablation for patients in BCLC very early/early stage hepatocellular carcinoma. J Hepatol. 2012; 56:412–8.
32. Kim GA, Shim JH, Kim MJ, Kim SY, Won HJ, Shin YM, Kim PN, Kim KH, Lee SG, Lee HC. Radiofrequency ablation as an alternative to hepatic resection for single small hepatocellular carcinomas. Br J Surg. 2016; 103:126–35.