
INTRODUCTION
We previously reported that ABI3 expression is reduced or lost in follicular cell-derived thyroid carcinomas as compared to normal tissues and follicular thyroid adenomas (FTA) [1]. We further demonstrated that ectopic expression of ABI3 inhibited cell proliferation, invasion, migration and delayed cell cycle progression of thyroid carcinoma cell line in vitro. Moreover, ABI3 expression inhibited tumor formation in athymic mice [1]. These findings provide evidences that ABI3 is a tumor suppressor gene that plays important roles in the malignant transformation of thyroid tumors.
In addition to its tumor suppressive effect, it has been proposed that ABI3 is involved in tumor progression. Loss of ABI3 expression was reported in several cancer cell lines, including a highly metastatic U87 human glioma cell line. The authors further showed that forced expression of ABI3 into U87 cells suppressed cell motility and metastatic dissemination in vivo [2].
ABI3, like ABI1 and ABI2, which promote the Abl-mediated phosphorylation of MENA and WAVE2, is present in a macromolecular WAVE complex (Abi1/Abi2, Sra1/cyfip1, Nap1, HSPC300 and WAVE/Scar). Nevertheless, it is likely to play a different role in the regulation of Abl [3]. It has been suggested that ABI3 interact with the SH3 domain of the insulin receptor substrate protein 53 (IRSp53), a WAVE2-binding protein that is not included in the aforementioned protein complex. Therefore, ABI3 might compete with WAVE2 for binding to IRSp53 [4]. These findings indicate that ABI3 interacts via SH3 domain with different proteins in a context-dependent manner and they are someway involved in cytoskeletal reorganization.
More extensive studies are needed to identify proteins that may interact with ABI3 in thyroid cells and, particularly, to identify the underlying mechanism by which ABI3 expression is lost in follicular cell-derived thyroid cancer and carcinoma cell lines.
In this paper, we focus on the mechanism associated with ABI3 silencing in thyroid carcinomas. It is recognized that DNA methylation is the main mechanism linked with gene expression control [5]. DNA methylation typically occurs at cytosines in cytosine-guanine dinucleotides (CpG), which are randomly distributed through the genome. CpG sites tend to occur in cluster called CpG islands. Nearly 70% of annotated gene promoters are associated with CpG islands, which typically remain unmethylated in normal cells [6].
One study, through comparison of global methylation profile of different chronic lymphocytic leukemia prognostic subgroups, reported that ABI3 was silenced via DNA hypermethylation [7]. The authors found a high degree of methylation at CpG sites located within intron 1 of ABI3 gene in the samples from the poor-prognosis group compared with that seen in the samples from favorable prognosis group [7].
We here speculate whether decrease or absence of ABI3 expression is correlated with hypermethylation of the ABI3 in primary follicular thyroid carcinomas (FTC) tissues and in follicular thyroid carcinoma cell lines.
We here demonstrated that ABI3 expression was restored in four thyroid carcinoma cells (FTC 238, FTC 236, FTC 133 and WRO) after treatment with demethylating agent 5-aza-dC. We identified a cancer-specific differentially methylated region located in the ABI3 promoter, which is hypermethylated in thyroid cell lines and thyroid carcinoma samples while is hypomethylated in the benign samples (FTA) and in a non-thyroid cell model (melanoma cells). Moreover, we show that the regulatory function of this differentially methylated region might be dependent on the expression of NKX2-1, also named thyroid specific transcription factor 1. The results indicate that promoter methylation plays an important role in the down-regulation of ABI3 expression in thyroid cell lines and thyroid carcinoma tissues and explain, at least in part, why ABI3 silencing might occur in a cancer- and tissue-specific manner.
RESULTS
ABI3 expression was restored by 5-aza-dC treatment in thyroid carcinoma cell lines
To identify whether the transcriptional repression of ABI3 in thyroid carcinomas results from DNA methylation in the promoter region of the gene, ABI3 expression was assayed in thyroid follicular carcinoma cell lines (FTC 238, FTC 236, FTC 133 and WRO) following treatment with the demethylating agent 5-aza-2′-deoxycitidine (5-aza-dC). The incubation with 5-aza-dC resulted in a significant increase of ABI3 mRNA in FTC 238 (88.20 ± 16.85-fold; P = 0.0033), FTC 236 (64.10 ± 0.10-fold; P = 0.0001), FTC 133 (33.55 ± 2.15-fold; P = 0.0022) and WRO (13.37 ± 2.95-fold, P = 0.0070), compared to untreated cells (Figure 1A). Restoration of ABI3 expression in thyroid carcinoma cells by 5-aza-dC treatment confirmed a causal correlation between DNA hypermethylation and ABI3 silencing in thyroid cell lines.
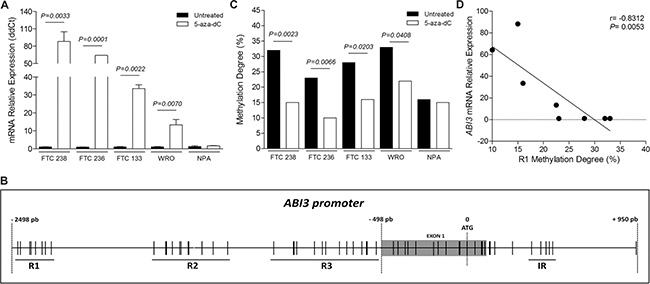
Figure 1: (A) ABI3 expression in follicular thyroid carcinoma cell lines (FTC 238, FTC 236, FTC 133 and WRO) and melanoma cell line (NPA) following treatment with 5-aza-dC. The expression of ABI3 was restored after 5-aza-dC treatment. No effect on the expression of ABI3 was observed in melanoma cells (NPA). (B) Representative illustration of CpG sites (black lines) in ABI3 promoter (−498 to −2498 bp relative to ATG). The multiple adjacent CpG sites of each region (R1, R2 and R3) evaluated in the present study are underlined. The CpG sites located in the intronic region (IR), previously described as methylated in leukaemia, is showed. (C) Thyroid carcinomas cells were demethylated following 5-aza-dC treated, while no effect was observed in melanoma cells (D) Methylation degree of R1 negatively correlated with the ABI3 expression in follicular thyroid carcinoma cells.
We also analyzed whether the transcription level of ABI3 is regulated by DNA methylation in a melanoma cell line (NPA). No obvious change was seen in ABI3 expression after the treatment of NPA cells with 5-aza-dC (Figure 1A). Together, this data suggests that the hypermethylation and ABI3 silencing might occurs in a tissue specific-manner.
Identification of a new cancer-specific differentially methylated region (cDMR) within ABI3 promoter
Using the criteria of CpG islands described by Gardiner-Garden and Frommer and revised by Takai and Jones, no CpG island was found between position −10,000 pb and +500 pb relative to ATG of ABI3 gene. The status of five previously described CpG sites located within intron 1 (Intronic Region, IR), between positions +360 to +481 of ABI3 gene, were analyzed in WRO, FTC 238 and NPA cells (Figure 1B) [7].
The methylation status of each CpG was obtained by sequencing PCR clones from bisulfite treated genomic DNA purified from 5-aza-dC-treated and untreated cells. Although the five CpG sites were methylated at different degree, there was no difference in the overall degree of methylation at these sites between untreated and 5-aza-dC treated thyroid cell lines (WRO, FTC 238) and melanoma cell (NPA cells) (Supplementary Figure S1A).
In a next step, we focus on the methylation status of the ABI3 promoter region, from −2498 pb to −498 pb relative to ATG of ABI3 gene (NC_000017.11, NM_016428.2). Thirty-three CpG sites around the transcriptional start site were identified. Eight CpG sites from −2467 pb to −2285 pb (Region 1, R1); 11 CpG sites from −1708 pb to −1284 pb (Region 2; R2); and 14 CpG sites from −1089 pb to −509 pb (Region 3; R3) (Figure 1B).
The methylation pattern of each CpG across 3 regions of the ABI3 promoter was determined for each cell line. Although the CpG sites located at R2 and R3 regions were partially methylated, having a combination of methylated and unmethylated sites, the examining of the methylation degree of each region for each cell line revealed no difference between untreated and 5-aza-dC treated thyroid cell lines (WRO, FTC 238) and melanoma cell (NPA cells) (Supplementary Figure S1B and S1C). These findings indicate that these CpG sites are not likely to be methylated/demethylated in thyroid tumors.
The bisulfite sequencing of the 8 CpG sites located at R1 region revealed higher methylation degree of these sites in untreated thyroid follicular carcinoma cells as compared to 5-aza-dC treated FTC 238 (P = 0.0023) and WRO (P = 0.0408) cells (Figure 1C). We then evaluated the methylation status of CpG sites located at R1 region in two additional thyroid carcinoma cell lines (FTC 236 and FTC 133), which the expression of ABI3 was increased following treatment with 5-aza-dC (Figure 1A). These CpG sites were highly methylated in untreated cells as compared to 5-aza-dC treated FTC 236 (P = 0.0066) and FTC133 (P = 0.0203) cells. Low methylation degree was observed in these sites in both untreated (16%) and 5-aza-dC treated (15%) melanoma cells (Figure 1C).
As illustrated in Figure 1D, the methylation degree of CpG sites located at R1 correlated negatively with ABI3 expression in thyroid follicular cancer cells (r = −0.8312 and P = 0.0053), perhaps characterizing a new cDMR.
Screening of the cancer-specific differentially methylation region localized within ABI3 promoter in thyroid carcinomas samples
To investigate whether the down-regulation of ABI3 expression in FTC, as compared to FTA, results from hypermethylation of the CpG sites located in the promoter region of ABI3 gene, we focused our analysis of DNA methylation on a region within the promoter (R1) that was methylated in thyroid carcinoma cell lines. Bisulfite sequencing method was used to analyze the methylation level of the CpG sites located at the R1 in 11 FTA and 17 FTC samples. The mean level of methylation in all 8 CpG sites was higher in FTC (47.65%) compared to FTA (31.73%) (P < 0.0001) (Figure 2A).
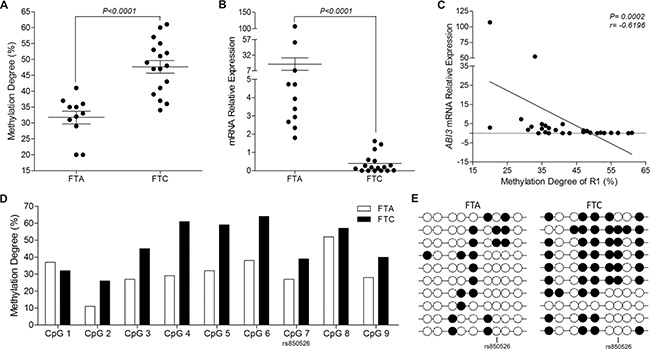
Figure 2: ABI3 expression and methylation analysis in thyroid tumor samples. (A) The R1 was hypermethylated in FTC samples compared to FTA. (B) ABI3 expression is absent in most FTC, while is expressed at high levels in FTA. (C) A relatively strong negative correlation is observed between ABI3 expression and R1 methylation in both FTA and FTC. (D) Significant differences were found for each CpG site within the R1. The largest differences were observed for CpG4–6, which were hypermethylated in FTCs compared to FTAs. CpG7 corresponds to SNP rs850526. (E) Representative results of the bisulfite sequencing of the 10 selected clones evaluated for a single patient with FTA and one patient with FTC. FTA: follicular thyroid adenoma; FTC: follicular thyroid carcinoma.
To test whether ABI3 transcription is associated with DNA methylation of its promoter, we used qPCR to assess the expression levels of ABI3 in thyroid samples and correlated with methylation status. ABI3 expression was lost in most FTCs (mean ± SD 0.3882 ± 0.12) as compared to FTA (mean ± SD 17.58 ± 9.990; P < 0.0001) (Figure 2B). When methylation degree and ABI3 expression in thyroid tissues was compared, we found that the expression of ABI3 mRNA decreased in most FTC samples in which ABI3 hypermethylation was observed. In fact, we show a strong negative correlation between methylation degree of the CpG sites located at R1 and ABI3 abundance in FTC and FTA samples (r = −0.6196 and P = 0.0002) (Figure 2C). These results suggest that methylation in the ABI3 promoter is associated with transcriptional repression of ABI3 in thyroid carcinoma tissues.
Interestingly sequencing analysis showed a C/T polymorphism (rs850526), which creates an additional CpG sites in ABI3 R1 region in nearly 45,5% (5/11) of FTA and in 35,5% (6/17) of FTC samples (Supplementary Figure S2). To determine the methylation pattern, we estimated the contribution of all CpGs, including this unpredicted CpG site.
We found that 88% (8/9) of these CpG sites located at R1 were hypermethylated in FTCs compared to FTAs. However, these CpG sites were methylated to different degrees. These differences were largest at the CpG4, CpG5 and CpG6 sites (Figure 2D). Representative results of the bisulfite sequencing of 10 selected clones for a single patient with FTA and of 10 selected clones for a single patient with FTC is show in Figure 2E.
Identification of a thyroid transcription factor-binding site in the promoter sequence of ABI3 gene
As hypermethylation of ABI3 might occurs in a cancer- and tissue-specific manner, we search for putative transcription factors binding sites (TFBS) in the R1 region of ABI3 gene. In silico analysis of this region identified a NKX2-1 canonical binding site (CTTG) (Score 100.0) in the region flanked by the CpG5 and CpG6 sites. NKX2-1 encodes a protein initially identified as a thyroid-specific transcription factor (TTF1) (Figure 3A).
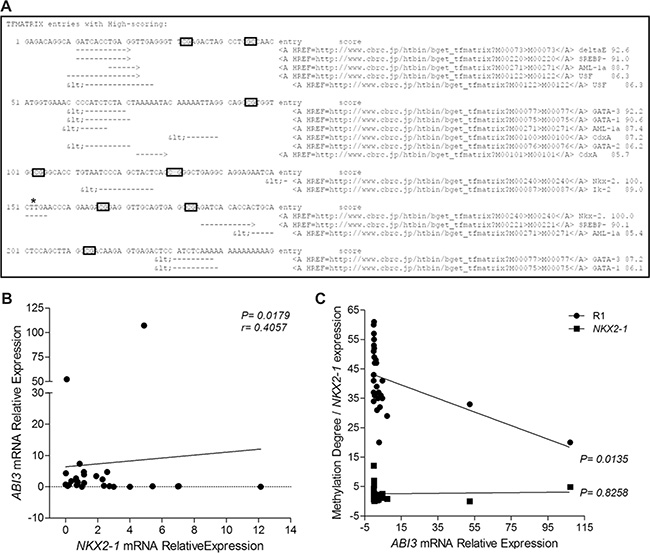
Figure 3: (A) In silico analysis of TFs sites within the R1 region of ABI3 promoter. Asterisk indicates the NKX2-1 canonical binding site. (B) Positive correlation between ABI3 and NKX2-1 expression in FTA and FTC samples. (C) The linear regression analysis indicate that, although the expression of NKX2-1 is required for the expression of ABI3, the degree of R1 methylation dictates the levels of ABI3 expression in thyroid samples.
NKX2-1 expression and methylation degree of R1 region of ABI3 gene are required to ABI3 expression in thyroid cells
As lower expression of NKX2-1 is correlated with progressive dedifferentiation of thyroid tumors, we next used qPCR to evaluate the expression levels of NKX2-1 in thyroid samples and correlated NKX2-1 and ABI3 expression. Although the level of NKX2-1 expression was comparable in thyroid tumors, a positive correlation was observed between ABI3 and NKX2-1 expression in thyroid tumors (r = 0.4057 and P = 0.0179) (Figure 3B). To investigate whether both NKX2-1 expression and R1 methylation status affects the transcription of ABI3, we performed linear regression analysis. The linear regression analysis indicated that, although the expression of NKX2-1 is required for the expression of ABI3, the degree of R1 methylation dictates the levels of ABI3 expression in thyroid samples (R1 methylation: P = 0.0135; NKX2-1 mRNA expression: P = 0.8258) (Figure 3C). These findings may explain why treatment with the demethylating agent 5-aza-dC did not restore ABI3 expression in a non-thyroid carcinoma cell line (NPA).
To further validate the hypothesis that both NKX2-1 expression and hypomethylation of R1 region of ABI3 gene are required for ABI3 expression, thyroid carcinoma and non-thyroid carcinoma cells were treated with demethylating-associated agent 5-aza-dC. The treatment with 5-aza-dC resulted in DNA demethylation at the R1 region in FTC 238 cells and the simultaneous restoration of NKX2-1 and ABI3 expression. In FTC 133, FTC 236 and WRO cells, which express endogenous NKX2-1, the treatment with 5-aza-dC resulted in restoration of ABI3 expression. Although the CpG dinucleotides of R1 region of ABI3 were hypomethylated in NPA cells, the treatment with 5-aza-dC did not restore the expression of the ABI3 in NPA cells, most likely due to the fact that NKX2-1 expression was not restored following treatment with 5-aza-dC (Figure 4A).
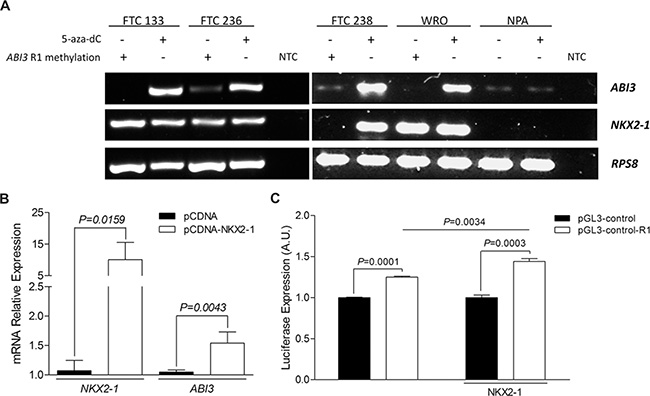
Figure 4: (A) Relationship between NKX2-1 and R1 methylation in the ABI3 expression in 5-aza-dC treated cells. ABI3 expression was restored in follicular carcinoma cell lines (FTC 238, FTC 236, FTC 133 and WRO) when NKX2-1 was present and R1 demethylated. In melanoma cells (NPA) the treatment with 5-aza-dC did not restore the expression of the ABI3 in NPA cells. (B) Transient transfection of NKX2-1 into NPA cells restored ABI3 expression. (C) Luciferase reporter assays showing the regulatory effect of R1 region of ABI3 promoter (white bars) compared to the pGL3-Control empty vector (black bars). Luciferase activity was increased after transfection of FTC 238 cells with pGL-control-R1 plasmid (white bars) as compared with cells transfected with pGL-control vector (black bars). The transcriptional activity was significantly increased when the cells were co-transfected with NKX2-1. NTC: no-template control.
Having observed that NKX2-1 is required for ABI3 expression and that these CpGs sites at R1 region were hypomethylated in NPA cells, we next transiently transfected the pCDNA-NKX2-1 expression vector into NPA cells. Remarkable, the expression of ABI3 was restored in NPA cells with ectopic expression of NKX2-1, while it was absent in NPA cells transfected with empty vector (P = 0.0043; Figure 4B).
Functional analysis shows that R1 is a regulatory region in ABI3 promoter
To measure the promoter activity of R1 region, the 312 pb fragment was cloned upstream of the luciferase reporter gene in the promoterless pGL3-Basic vector (designated pGL3-basic-R1). Luciferase activity was 0.011 ± 0.0013, 48 hours after co-transfection of pGL3-Basic-R1 and pRL-CMV and 0.007 ± 0.0071, 48 hours after co-transfection of pGL3-Basic empty vector and pRL-CMV, independently of NKX2-1 expression (data not shown). Results were normalized to that of Renilla luciferase and presented in arbitrary units (AU) as mean ± SD.
Subsequently, the R1 fragment was cloned upstream the pGL3-Control containing SV40 promoter and enhancer. Using luciferase as reporter gene, the putative regulatory region of ABI3 showed greater transcriptional activity compared to the pGL3-Control empty vector (P < 0.001; Figure 4C). The transcriptional activity was increased when the cells were co-transfected with NKX2-1 (P = 0.0034, Figure 4C). These findings suggested that R1 might act as a regulatory region of ABI3 promoter and it might be modulated by NKX2-1.
DISCUSSION
We previously reported that ABI3 expression is lost in thyroid tumors and its re-expression in thyroid cells lines significantly suppresses cell growth in vitro and tumor growth in vivo [1]. In this study we investigated the hypothesis that ABI3 is epigenetically silenced in thyroid carcinomas via DNA methylation.
Here we demonstrated that when thyroid carcinoma cell lines, which express virtually no ABI3, were grown in the presence of demethylating agent 5-aza-dC, the expression of ABI3 was restored. On the other hand, the 5-aza-dC treatment did not induce the transcription of ABI3 in a melanoma cell line. These findings were the first indication that methylation-induced transcriptional silencing of the ABI3 in thyroid carcinomas and that this regulation might occur in a tissue-specific matter.
The next step was to determine the potential link between ABI3 expression and methylation status of the 5 CpG sites located within intron 1 of the ABI3 gene (designated IR), which was previously identified as methylated in leukemia [7]. Using bisulfite sequencing, we observed that the overall methylation status were quite similar between the 5-aza-dC treated and untreated thyroid carcinomas cell lines, providing indirect evidences that methylation beyond this CpG region could be associated with decrease or lack of ABI3 expression in thyroid carcinomas cell lines and thyroid carcinoma samples.
As hypermethylation of gene-associated CpG islands are mostly linked to transcriptional silencing of tumor suppressor gene in cancer, we used in silico analysis to identify CpG islands spread over 10,000 pb upstream and 500 bp downstream of the translation start site of the ABI3 gene. On the basis of the original criteria of Gardiner-Garden & Frommer [8] and Takai & Jones, there was no CpG island near or within the promoter region of ABI3 gene.
Although DNA methylation occurs mainly in CpG-rich areas located near the promoters, is becoming clear that DNA methylation is dynamic and may occur in regions adjacent to the CpG-rich areas, which have a low density of CpG sites and named CpG shores. GpG shores exhibit tissue and cancer specific differential methylation. Beyond CpG island and shores, there are also regions of the genome with multiple adjacent CpG sites that show differential methylation patterns. These regions are classified as differentially methylated regions (DMR) and can occur in different contexts including cancer, denominated cancer-specific differentially methylated region (cDMR) [6].
We then extend our analysis by investigating the occurrence of CpG-rich regions, which did not meet the CpG island criteria, across the ABI3 promoter region. We have limited the promoter region to 2498 base pairs upstream of the translation start site of the ABI3. In silico analysis showed three distinct regions (designated R1, R2 and R3) with multiple adjacent CpG sites within promoter region of ABI3 gene. To ultimately quantitate total CpG methylation levels across each region before and after treatment with 5-aza-dC, these regions were submitted to bisulfite sequencing.
Although all regions showed some degree of methylation, the overall methylation status of R2 and R3 was not significantly different between 5-aza-dC treated and untreated cancer cells. However, statistical comparisons of the DNA methylation levels showed that the R1 was significant demethylated following 5-aza-dC treatment in FTC 238 and WRO thyroid carcinoma cells while there was no difference in the average degree of methylation in NPA cells (melanoma cells). We then evaluated the methylation status of these CpG sites in two additional follicular thyroid carcinoma cell lines (FTC 236 and FTC 133). Remarkable, drug-induced hypomethylation of R1 correlated with the reestablishment of ABI3 expression in all follicular thyroid carcinoma cell lines. Importantly, we found a correlation between the degree of methylation and the level of ABI3 expression. These findings further support the hypothesis that ABI3 might be transcriptional silenced by methylation in thyroid tumors.
As cell lines might exhibit higher degree of methylation than the primary tumors they represent [9], we sought to specifically investigate the methylation degree of this candidate region in FTC, which essentially has no expression of ABI3, and in FTA samples, which expresses ABI3 at high levels. Bisulfite sequencing of the DNA isolated from FTC samples also displayed a higher degree of DNA methylation within this region while FTAs shows a lower degree of methylation. Importantly, an inverse correlation was observed between ABI3 expression and degree of methylation of CpG sites at the R1 of the ABI3 promoter.
To estimate the degree of methylation at each CpG site, bisulfite-converted DNA was cloned and sequenced. This analysis quantitatively revealed the degree of methylation of each CpG site, including the non-predicted CpG7 in which the presence of an SNP generated a new CpG site. Most notably of all, the level of methylation at individual sites varied considerable. Three readable CpGs analyzed within this region (CpG4, CpG5 and CpG6) have increased methylation degree in FTCs (68%–73%) relative to that of FTAs (25%–48%). These differences were largest CpG4 and CpG5.
This study reveals a new region in the ABI3 promoter that show differential methylation patterns in benign and malignant thyroid tumors. Methylation at some CpG sites was more strictly maintained in FTCs. It is possible that transcriptional silencing of ABI3 in FTCs does not require hypermethylation of an entire CpG island but only few specific core CpG dinucleotides might be sufficient.
Although ABI3 was previously reported as methylated in a subset of patients with leukemia, our results differ from the previous study in which the five CpG sites, located within intron 1 of ABI3 gene, were fully methylated and associated with decreased gene expression [7]. It’s likely that the location of core regions and the degree of methylation required for ABI3 silencing might vary according different tumors subtypes. Whether different genetic/epigenetic mechanism might be involved in the transcriptional regulation of ABI3 in another cell type, it is still unclear.
Actually, differential methylation regions in cancer have been described in different tumor subtypes. Using next-generation sequencing, cancer-specific differentially methylated regions (cDMRs) were identified in prostate carcinomas [10].
As DNA methylation within regulatory regions may mediate gene silencing by causing interfering with the binding of transcription factor [11], we next focus on the identification of putative transcription factors binding sites at this differentially methylated region that would help to explain the tissue-specific expression of ABI3.
A closer look at the sequence configuration revealed the presence of one responsive element for the thyroid-specific transcription factors NKX2-1 formerly called TTF-1, near the CpG5 and CpG6 sites. It is well known that NKX2-1 plays an important role not only in tissue-specific gene expressions in adults as well as during development [12]. Interestingly, the expression of NKX2-1 correlated with the expression of ABI3 in thyroid samples. The linear regression analysis indicated that the high degree of methylation at R1 might be one event that leads to transcriptional inactivation of ABI3 but seems that the NKX2-1 input is also essential.
To functionally explore this hypothesis we initially investigated the levels of ABI3 and NKX2-1 in 5-aza-dC treated and untreated thyroid carcinoma and melanoma cells lines. We confirmed that ABI3 was expressed in follicular carcinomas cells only when these specific CpG sites located at the promoter region of ABI3 (R1 region) were demethylated and NKX2-1 was present. In melanoma cells, even though the CpG sites at this specific region were hypomethylated, ABI3 could not be detected, most likely because NKX2-1 was absent in these cells. Conversely, ectopic expression of NKX2-1 in melanoma cells lead to an increase in ABI3 expression. The functional relevance of this region was further tested by luciferase dual transfection. Results of luciferase activity indicated that R1 might act as a regulatory region of ABI3 promoter and it might be modulated by NKX2-1.
The mechanism by which methylation/demethylation occurs and how DNA methylation influences the binding of transcriptions factors (TFs) is still unclear. Recent studies challenge the conservative view that DNA methylation is the cause of altered gene expression. It has been suggested that the binding of the TFs triggers the loss of methylation prior to gene transcription [13]. Others have suggested that DNA methylation accumulates passively as a consequence of the absence of TF binding [14, 15]. If this hypothesis is correct, it is expected that methylation at transcription factor recognition sequences should be negatively correlated with transcription factor abundance.
From a more conventional point of view, epigenetic modifications influence the access of transcription factors to their binding sites. As example, cytosine methylation might directly disturb the affinity of transcription factors (TFs) towards their binding sites [15]. Finally, the occupation of regulatory region by methyl-CpG biding proteins can compete with transcription factor (TF) to its binding site, repressing the transcription [16].
Taken together, the results presented in this manuscript clearly indicate that mechanism governing ABI3 expression in thyroid tumors involves methylation/demethylation at specific CpG sites located at the promoter region of ABI3, designed as cDMR. The results also uncovered a further layer in the regulation of the activation of ABI3 promoter. We inferred that that DNA methylation helps to restrict ABI3 activation when NKX2-1 is expressed; i.e., the presence of NKX2-1 is needed for ABI3 expression. Whether the binding of NKX2-1 to the ABI3 promoter is sufficient to induce demethylation and, therefore, gene transcription or if the absence of NKX2-1 leads to cumulative methylation, needs further analysis.
MATERIALS AND METHODS
Thyroid samples
The series consists of 32 thyroid samples obtained from patients who underwent thyroid surgery at Hospital São Paulo (Universidade Federal de São Paulo). The study included 17 FTC and 11 FTA. Four normal thyroid tissues were used for expression analysis, as control group. The study was conducted under the approval of the Review Boards and Research Ethical Committee of the Universidade Federal de São Paulo.
Cell lines
WRO (follicular thyroid carcinoma) and NPA (melanoma) cell lines were cultured in Dulbecco’s modified essential medium (DMEM) supplemented with 10% fetal bovine serum (FBS) (Life Technologies, Grand Island, NY). NPA87 derivatives from M14/MDA-MB-435S melanoma cell line. FTC 238, FTC 236 and FTC 133 (follicular thyroid carcinoma cell line) were purchased from ECACC (European Collection of Cell Cultures, Cat. No 94060902, 06030202 and 94060901, respectively) and were cultured according manufacturer’s recommended protocol. FTC 238 was culture in DMEM and Ham’s F12 (1:1 mixture) supplemented with 5% FBS (FTC 238). FTC 133 was culture in DMEM and Ham’s F12 (1:1 mixture) supplemented with 10% FBS. FTC 236 was culture in DMEM and Ham’s F12 (1:1 mixture) supplemented with 10% FBS and 1 mU/mL TSH (Life Technologies) and 10 μg/mL insulin (Life Technologies).
In silico analyses
Gene information was obtained from Ensembl Gene ID ENSG00000108798 and NCBI NC_000017.11. The sequences from 10,000 pb upstream and 500 bp downstream of ABI3 translational start codon (ATG +1), which included intron 1 and exon 1 of ABI3 gene, were extracted and the detection of the CpG islands was performed using Methyl Primer Express Software (Applied Biosystems) according to the criteria established by Gardiner-Garden & Frommer [8] and Takai & Jones [17] i.e., a CpG island is defined as a region of at least 200 pb, with proportion of GC content greater than 50% and observed to expected (O/E) CpG ratio ≥ 0.6. The analysis also focused on the presence of CpG-rich regions that did not meet the CpG island criteria at the putative promoter of ABI3 gene (−2498 pb to −498 pb relative to ATG +1).
5-aza-2′-deoxycytidine treatment
For demethylation analysis, cell lines (3 × 10⁵) were cultured in 35-mm culture plates and treated with 15 μM of demethylating agent 5-aza-dC (Sigma-Aldrich, St. Louis, MO) diluted in dimethylsulfoxide (DMSO) or vehicle only (untreated cells) for a total of 72 h as previously described [18]. Fresh media containing either DMSO or 5-aza-dC were changed once every 24 h. Drug treatment (5-aza-dC) experiments were performed in triplicate.
Total RNA isolation and quantitative RT-PCR (qPCR)
Total RNA was isolated from cell lines and thyroid samples using TRIzol reagent according to the manufacturer’s recommendation (Invitrogen, Life Technologies) and quantitated using a NanoDrop spectrophotometer. Total RNA (1 μg) was treated with DNAse (Ambion, Life Technologies) and reverse transcribed to cDNA using Super-Script III Reverse Transcriptase kit with an oligo(dT)12–18 primer and 10 units of RNase inhibitor (Invitrogen), according to the manufacturers’ recommended protocols. An aliquot (1 μL) of cDNA was used in a 12 μL PCR reaction containing SYBR Green PCR Master Mix (Applied Biosystems, Life Technologies) and 3, 2 pmol of each specific primer for the target genes (ABI3 and NKX2-1) or reference gene (RPS8). The PCR reactions were performed in triplicate, and the Ct was obtained using Applied Biosystem software and averaged (SD < 1.0). The relative expression (RE) was calculated according to the comparative ΔΔCt method. RE values in thyroid tumor samples were normalized to the RPS8 and then to the normal thyroid tissues. RE values in cell lines was normalized to the RPS8 and then to the vehicle-treated control cells or empty vector transfected cells. The PCR primers and conditions are summarized in Supplementary Table S1.
DNA isolation and bisulfite sequencing
For methylation analyses, DNA was purified from untreated or 5-aza-dCt treated cells or thyroid samples as previously reported [19] and quantitated by absorbance at 260 nm. To deaminate unmethylated cytosines, and thus distinguish methylated from unmethylated alleles, DNA (1 μg) was converted using EpiTect Bisulfite conversion kit (QIAgen, Hilden, Germany) according to the manufacturer’s instructions. Bisulfite-converted DNA (10–30 ng) was used as template in a 25-μL PCR reactions containing 10 mM dNTPs, 50 mM MgCl2, 20 mM Tris-HCl, 50 mM KCl, 1,5U Platinum Taq DNA polymerase (Life Technologies) and 10 pmol of specific primers. Primers flanking the CpG sites located within intron1 (designed IR) or within the promoter region of ABI3 (designed R1, R2 and R3) were designed (Figure 1B). Primers sequence and PCR conditions are described in Supplementary Table S1.
PCR products were then cloned into pCR2.1-TOPO vector using TOPO TA Cloning kit (Life Technologies) according to the manufacturer’s instructions. Nearly 8–12 independent colonies were picked randomly and the inserts were amplified and sequenced using BigDye Terminator v3.1 Cycle Sequencing Kit (Applied Biosystems). After bisulfite treatment, the degree of methylation at each CpG site in the individual regions were determined from the ratio of methylated cytosines to total cytosines and expressed as percentage.
Prediction of TFBS
As gene expression is primarily regulated by TFs, we search for putative TFBS in the promoter sequence of ABI3 gene using FT Search software available in http://diyhpl.us/~bryan/irc/protocol-online/protocol-cache/TFSEARCH.html. The threshold score was 85.0 (default).
Transient transfection of NKX2.1 into NPA cells
pcDNA-NKX2.1 [18] or empty vector were transiently transfected into NPA cells (5 × 10⁵) using Lipofectamine LTX with Plus Reagent (Life Technologies) according to the manufacture’s instructions. Forty-eight hours post-transfection, the cells were harvested and assayed for ABI3 and NKX2-1 expression. To this end, total RNA isolation, cDNA synthesis and qPCR were performed as above. Assays were performed in triplicate. The RE was calculated as above-mentioned.
Luciferase reporter constructs
We functionally evaluated the efficacy of regulatory sequence (R1) of ABI3 by analysis of luciferase expression. The region (R1) located at −2467 pb to −2285 pb relative to ABI3 translational start codon (ATG +1) was PCR amplified from DNA isolated from a normal thyroid tissue. PCR primers were designed to include restriction sites. The Kpn1 restriction site was add in the primer sense and XhoI site in the antisense primer (Supplementary Table S1). The PCR-amplified product was digested with KpnI and XhoI restriction enzymes (New England Biolabs, Hitchin, UK) and directionally cloned into the same restriction sites upstream to a promoterless firefly luciferase gene of the pGL3-Basic vector and into the pGL3-Control (Promega, Madison, WI), which contains a luciferase gene driven by the SV40 promoter. The empty pGL3-Basic and pGL3-Control were used as negative control. Mach1 competent bacteria strain was transformed with the resulting constructs (designed pGL3-Basic-R1 or pGL3-Control-R1) by the heat shock method. The constructs were isolated and sequenced using BigDye Terminator v3.1 Cycle Sequencing Kit (Applied Biosystems).
Transient transfection and luciferase assays
FTC 238 cells (4 × 10⁴) were co-transfected with 500 ng of the firefly luciferase constructs (pGL3-Basic-R1, pGL3-Control-R1, empty pGL3-Basic or empty pGL3-Control) and 10 ng of Renilla luciferase reporter vector (pRL-CMV) using Lipofectamine LTX with Plus Reagent (Life Technologies), according to the manufacture’s instructions. The pRL-CMV (Promega), which contains the Renilla luciferase gene driven by the CMV enhancer and early promoter, was used to normalize for transfection efficiency. All transfections were performed in the presence or absence of pcDNA-NKX2-1 vector (320 ng), which expresses the transcription factor NKX2-1 [18].
Forty-eight hours post-transfections, firefly and Renilla luciferase activities were measured in cell lysates using Dual Luciferase Assay System (Promega) with the Victor3 spectrophotometer (Perkin Elmer, Massachusetts, USA). The relative activity of firefly luciferase was standardized to the Renilla luciferase control and results expressed in arbitrary units (AU). Luciferase assays were performed in triplicate.
Statistical analysis
Statistical analyses were performed using GraphPad Prism v5.01 Software (GraphPad Software). Shapiro-Wilk test was used to verify the normality of distribution. Comparisons between two groups were performed using Student t test (when demonstrate normal distribution) or Mann-Whitney test (non-normal distribution). For contingency analysis, Fisher’s exact test was employed. Pearson correlation and multiple linear regression analysis were performed. The results were expressed as mean ± SD. The results with P < 0.05 were considered statistically significant.
ACKNOWLEDGMENTS AND FUNDING
This study was supported by a research grant from The São Paulo State Research Foundation (FAPESP; grant # 2013/03867-5). L.M. is FAPESP scholar and J.M.C. is investigator of the Brazilian Research Council (CNPq).
CONFLICTS OF INTEREST
The authors have no conflicts of interest to declare.
REFERENCES
1. Latini FR, Hemerly JP, Freitas BC, Oler G, Riggins GJ, Cerutti JM. ABI3 ectopic expression reduces in vitro and in vivo cell growth properties while inducing senescence. BMC cancer. 2011; 11:11.
2. Ichigotani Y, Fujii K, Hamaguchi M, Matsuda S. In search of a function for the E3B1/Abi2/Argbp1/NESH family (Review). International journal of molecular medicine. 2002; 9:591–595.
3. Hirao N, Sato S, Gotoh T, Maruoka M, Suzuki J, Matsuda S, Shishido T, Tani K. NESH (Abi-3) is present in the Abi/WAVE complex but does not promote c-Abl-mediated phosphorylation. FEBS Lett. 2006; 580:6464–6470.
4. Matsuda S, Yokozaki S, Yoshida H, Kitagishi Y, Shirafuji N, Okumura N. Insulin receptor substrate protein 53 (IRSp53) as a binding partner of antimetastasis molecule NESH, a member of Abelson interactor protein family. Ann Oncol. 2008; 19:1356–1357.
5. Jaenisch R, Bird A. Epigenetic regulation of gene expression: how the genome integrates intrinsic and environmental signals. Nat Genet. 2003; 33:245–254.
6. Rakyan VK, Down TA, Balding DJ, Beck S. Epigenome-wide association studies for common human diseases. Nature reviews Genetics. 2011; 12:529–541.
7. Kanduri M, Cahill N, Goransson H, Enstrom C, Ryan F, Isaksson A, Rosenquist R. Differential genome-wide array-based methylation profiles in prognostic subsets of chronic lymphocytic leukemia. Blood. 2010; 115:296–305.
8. Gardiner-Garden M, Frommer M. CpG islands in vertebrate genomes. J Mol Biol. 1987; 196:261–282.
9. van Vlodrop IJ, Niessen HE, Derks S, Baldewijns MM, van Criekinge W, Herman JG, van Engeland M. Analysis of promoter CpG island hypermethylation in cancer: location, location, location! Clin Cancer Res. 2011; 17:4225–4231.
10. Kim JH, Dhanasekaran SM, Prensner JR, Cao X, Robinson D, Kalyana-Sundaram S, Huang C, Shankar S, Jing X, Iyer M, Hu M, Sam L, Grasso C, et al. Deep sequencing reveals distinct patterns of DNA methylation in prostate cancer. Genome research. 2011; 21:1028–1041.
11. You JS, Kelly TK, De Carvalho DD, Taberlay PC, Liang G, Jones PA. OCT4 establishes and maintains nucleosome-depleted regions that provide additional layers of epigenetic regulation of its target genes. Proceedings of the National Academy of Sciences of the United States of America. 2011; 108:14497–14502.
12. Damante G, Tell G, Di Lauro R. A unique combination of transcription factors controls differentiation of thyroid cells. Prog Nucleic Acid Res Mol Biol. 2001; 66:307–356.
13. Palacios D, Summerbell D, Rigby PW, Boyes J. Interplay between DNA methylation and transcription factor availability: implications for developmental activation of the mouse Myogenin gene. Mol Cell Biol. 2010; 30:3805–3815.
14. Thurman RE, Rynes E, Humbert R, Vierstra J, Maurano MT, Haugen E, Sheffield NC, Stergachis AB, Wang H, Vernot B, Garg K, John S, Sandstrom R, et al. The accessible chromatin landscape of the human genome. Nature. 2012; 489:75–82.
15. Medvedeva YA, Khamis AM, Kulakovskiy IV, Ba-Alawi W, Bhuyan MS, Kawaji H, Lassmann T, Harbers M, Forrest AR, Bajic VB. Effects of cytosine methylation on transcription factor binding sites. BMC Genomics. 2014; 15:119.
16. Boyes J, Bird A. DNA methylation inhibits transcription indirectly via a methyl-CpG binding protein. Cell. 1991; 64:1123–1134.
17. Takai D, Jones PA. Comprehensive analysis of CpG islands in human chromosomes 21 and 22. Proceedings of the National Academy of Sciences of the United States of America. 2002; 99:3740–3745.
18. Galrao AL, Camargo RY, Friguglietti CU, Moraes L, Cerutti JM, Serrano-Nascimento C, Suzuki MF, Medeiros-Neto G, Rubio IG. Hypermethylation of a New Distal Sodium/Iodide Symporter (NIS) enhancer (NDE) is associated with reduced NIS expression in thyroid tumors. The Journal of clinical endocrinology and metabolism. 2014; 99:E944–952.
19. Hemerly JP, Bastos AU, Cerutti JM. Identification of several novel non-p.R132 IDH1 variants in thyroid carcinomas. Eur J Endocrinol. 2010; 163:747–755.