
Introduction
Incretin-based therapies in patients with type 2 diabetes mellitus by using either the injection form of glucagon-like peptide-1 receptor (GLP-1R) agonists or the oral form of dipeptidyl peptidase-4 (DPP-4) inhibitors have been shown to increase the risk of thyroid cancer [1, 2]. Elashoff et al. [3] analyzed the database of the US Food and Drug Administration (FDA) adverse event reporting system. They showed that the odds ratio (OR) for exenatide (a GLP-1R agonist) was 4.73 (P = 4 x 10⁻³); and for sitagliptin (a DPP-4 inhibitor) 1.48 (P = 0.65). An updated analysis by the same group concluded that GLP-1R agonists of exenatide and liraglutide were associated with a significantly higher risk, with respective OR (95% confidence interval, CI) of 3.94 (2.56-6.20) and 17.99 (10.12-33.56). However the estimated OR (95% CI) for sitagliptin [1.08 (0.33-2.81)] attenuated and was not significant. No case of thyroid cancer was observed for other DPP-4 inhibitors such as saxagliptin and linagliptin [4]. Therefore, the risk of thyroid cancer associated with incretin-based therapies is controversial and may differ between GLP-1R agonists and DPP-4 inhibitors or among different DPP-4 inhibitors.
Whether sitagliptin may increase the risk of thyroid cancer has not been studied in the Asian populations. The present study evaluated such a risk association in Taiwanese patients by using the reimbursement records of the National Health Insurance (NHI) databases.
Results
There were 312853 never users and 58238 ever users in the original sample (Figure 1). All characteristics differed significantly, except for chronic obstructive pulmonary disease (Table 1). Ever users were characterized by younger age, longer diabetes duration, less males, higher proportions of all comorbidities, less proportion of sulfonylurea but higher proportions of other antidiabetic medications (Table 1). In the matched sample, baseline characteristics were more comparable and only 4 variables (age, diabetes duration, sulfonylurea, and acarbose) remained significantly different. Eight out of the 21 variables had standardized differences > 10% in the original sample, but none had a value > 10% in the matched sample (Table 1).
Table 1: Comparison of baseline characteristics between sitagliptin never users and ever users in the original sample and in the propensity score matched sample
Variable |
Original sample |
Matched sample |
||||||||||
Never users |
Ever users |
Never users |
Ever users |
|||||||||
(n= 312853) |
(n= 58238) |
P* |
SD |
(n= 57659) |
(n= 57659) |
P* |
SD |
|||||
Mean ± standard deviation |
Mean ± standard deviation |
Mean ± standard deviation |
Mean ± standard deviation |
|||||||||
Age (years) |
57.7±10.0 |
57.0±10.0 |
<0.0001 |
-10.57 |
56.9±10.1 |
57.0±9.9 |
0.0083 |
1.53 |
||||
Diabetes duration (years) |
5.4±2.9 |
7.0±2.8 |
<0.0001 |
61.10 |
7.0±2.7 |
7.0±2.8 |
0.0164 |
1.03 |
||||
n |
% |
n |
% |
n |
% |
n |
% |
|||||
Sex |
||||||||||||
Women |
142985 |
45.70 |
27227 |
46.72 |
<0.0001 |
-1.97 |
27094 |
46.99 |
26943 |
46.73 |
0.3729 |
0.52 |
Men |
169868 |
54.30 |
31011 |
53.21 |
30565 |
53.01 |
30716 |
53.27 |
||||
Hypertension |
||||||||||||
No |
84776 |
27.10 |
13365 |
22.93 |
<0.0001 |
9.31 |
13392 |
23.23 |
13301 |
23.07 |
0.5252 |
0.31 |
Yes |
228077 |
72.90 |
44873 |
76.99 |
44267 |
76.77 |
44358 |
76.93 |
||||
Chronic obstructive pulmonary disease |
||||||||||||
No |
183696 |
58.72 |
33955 |
58.26 |
0.0634 |
0.21 |
33626 |
58.32 |
33607 |
58.29 |
0.9097 |
0.05 |
Yes |
129157 |
41.28 |
24283 |
41.66 |
24033 |
41.68 |
24052 |
41.71 |
||||
Heart failure |
||||||||||||
No |
277100 |
88.57 |
50045 |
85.87 |
<0.0001 |
7.65 |
49627 |
86.07 |
49625 |
86.07 |
0.9864 |
-0.03 |
Yes |
35753 |
11.43 |
8193 |
14.06 |
8032 |
13.93 |
8034 |
13.93 |
||||
Nephropathy |
||||||||||||
No |
257388 |
82.27 |
45877 |
78.71 |
<0.0001 |
9.06 |
45705 |
79.27 |
45481 |
78.88 |
0.1049 |
0.92 |
Yes |
55465 |
17.73 |
12361 |
21.21 |
11954 |
20.73 |
12178 |
21.12 |
||||
Eye disease |
||||||||||||
No |
262014 |
83.75 |
41320 |
70.90 |
<0.0001 |
27.97 |
41358 |
71.73 |
41257 |
71.55 |
0.5093 |
0.32 |
Yes |
50839 |
16.25 |
16918 |
29.03 |
16301 |
28.27 |
16402 |
28.45 |
||||
Dyslipidemia |
||||||||||||
No |
80344 |
25.68 |
10566 |
18.13 |
<0.0001 |
20.60 |
10417 |
18.07 |
10554 |
18.30 |
0.2956 |
-0.65 |
Yes |
232509 |
74.32 |
47672 |
81.79 |
47242 |
81.93 |
47105 |
81.70 |
||||
Stroke |
||||||||||||
No |
248921 |
79.56 |
44946 |
77.12 |
<0.0001 |
5.78 |
44495 |
77.17 |
44535 |
77.24 |
0.7789 |
-0.21 |
Yes |
63932 |
20.44 |
13292 |
22.81 |
13164 |
22.83 |
13124 |
22.76 |
||||
Ischemic heart disease |
||||||||||||
No |
200694 |
64.15 |
34614 |
59.39 |
<0.0001 |
9.63 |
34411 |
59.68 |
34372 |
59.61 |
0.8149 |
0.11 |
Yes |
112159 |
35.85 |
23624 |
40.53 |
23248 |
40.32 |
23287 |
40.39 |
||||
Peripheral arterial disease |
||||||||||||
No |
258381 |
82.59 |
46610 |
79.97 |
<0.0001 |
6.14 |
46096 |
79.95 |
46179 |
80.09 |
0.5410 |
-0.38 |
Yes |
54472 |
17.41 |
11628 |
19.95 |
11563 |
20.05 |
11480 |
19.91 |
||||
Obesity |
||||||||||||
No |
297731 |
95.17 |
54005 |
92.66 |
<0.0001 |
10.38 |
53402 |
92.62 |
53563 |
92.90 |
0.0674 |
-1.12 |
Yes |
15122 |
4.83 |
4233 |
7.26 |
4257 |
7.38 |
4096 |
7.10 |
||||
Benign thyroid disease |
||||||||||||
No |
280136 |
89.54 |
50903 |
87.34 |
<0.0001 |
8.32 |
50381 |
87.38 |
50453 |
87.50 |
0.5223 |
-0.43 |
Yes |
32717 |
10.46 |
7335 |
12.59 |
7278 |
12.62 |
7206 |
12.50 |
||||
Sulfonylurea |
||||||||||||
No |
111828 |
35.74 |
23575 |
40.45 |
<0.0001 |
-13.42 |
23630 |
40.98 |
23193 |
40.22 |
0.0088 |
1.69 |
Yes |
201025 |
64.26 |
34663 |
59.47 |
34029 |
59.02 |
34466 |
59.78 |
||||
Metformin |
||||||||||||
No |
85925 |
27.46 |
14148 |
24.27 |
<0.0001 |
11.96 |
13834 |
23.99 |
14001 |
24.28 |
0.2505 |
-0.74 |
Yes |
226928 |
72.54 |
44090 |
75.65 |
43825 |
76.01 |
43658 |
75.72 |
||||
Meglitinide |
||||||||||||
No |
298548 |
95.43 |
54885 |
94.17 |
<0.0001 |
5.51 |
54328 |
94.22 |
54372 |
94.30 |
0.5775 |
-0.31 |
Yes |
14305 |
4.57 |
3353 |
5.75 |
3331 |
5.78 |
3287 |
5.70 |
||||
Acarbose |
||||||||||||
No |
288189 |
92.12 |
51120 |
87.71 |
<0.0001 |
14.38 |
50537 |
87.65 |
50800 |
88.10 |
0.0177 |
-1.44 |
Yes |
24664 |
7.88 |
7118 |
12.21 |
7122 |
12.35 |
6859 |
11.90 |
||||
Insulin |
||||||||||||
No |
297534 |
95.10 |
54769 |
93.97 |
<0.0001 |
7.79 |
54179 |
93.96 |
54218 |
94.03 |
0.6287 |
-0.31 |
Yes |
15319 |
4.90 |
3469 |
5.95 |
3480 |
6.04 |
3441 |
5.97 |
||||
Pioglitazone |
||||||||||||
No |
295794 |
94.55 |
54174 |
92.95 |
<0.0001 |
8.52 |
53704 |
93.14 |
53658 |
93.06 |
0.5930 |
0.29 |
Yes |
17059 |
5.45 |
4064 |
6.97 |
3955 |
6.86 |
4001 |
6.94 |
||||
Rosiglitazone |
||||||||||||
No |
304161 |
97.22 |
56349 |
96.68 |
<0.0001 |
5.94 |
55762 |
96.71 |
55782 |
96.74 |
0.7406 |
-0.18 |
Yes |
8692 |
2.78 |
1889 |
3.24 |
1897 |
3.29 |
1877 |
3.26 |
||||
*Chi square test for age and diabetes duration, and Student’s t test for other variables
SD: standardized difference
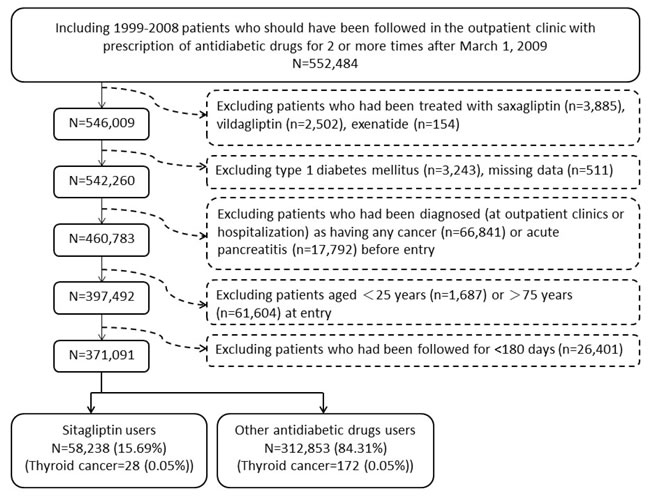
Figure 1: Flowchart showing the procedures in selecting the original sample into the study.
Table 2 shows the incidence of thyroid cancer with regards to sitagliptin. The respective number of incident thyroid cancer for never users and ever users in the original sample was 172 and 28, with respective incidence of 22.13 and 29.34 per 100,000 person-years. The incidences for users within the first year (in the first and second tertiles) were higher than never users but the incidence was lower for users of more than one year (third tertile) when compared to never users. Findings in the matched sample were similar to those observed in the original sample.
Table 2: Incidence of thyroid cancer by sitagliptin exposure
Sitagliptin use |
Case number |
Incident thyroid cancer |
% |
Person-years |
Incidence rate |
(per 100,000 person-years) |
|||||
I. Original sample |
|||||
Never users |
312853 |
172 |
0.05 |
777260.24 |
22.13 |
Ever users |
58238 |
28 |
0.05 |
95424.71 |
29.34 |
Tertiles of cumulative duration of sitagliptin therapy (months) |
|||||
Never users |
312853 |
172 |
0.05 |
777260.24 |
22.13 |
<6.53 |
18287 |
9 |
0.05 |
25343.96 |
35.51 |
6.53-14.00 |
20161 |
14 |
0.07 |
29760.78 |
47.04 |
>14 |
19790 |
5 |
0.03 |
40319.97 |
12.40 |
II. Matched sample |
|||||
Never users |
57659 |
31 |
0.05 |
141851.35 |
21.85 |
Ever users |
57659 |
28 |
0.05 |
94698.12 |
29.57 |
Tertiles of cumulative duration of sitagliptin therapy (months) |
|||||
Never users |
57659 |
31 |
0.05 |
141851.35 |
21.85 |
<6.53 |
18066 |
9 |
0.05 |
25104.96 |
35.85 |
6.53-14.00 |
19978 |
14 |
0.07 |
29578.69 |
47.33 |
>14 |
19615 |
5 |
0.03 |
40014.47 |
12.50 |
Table 3 shows the hazard ratios in different groups of sitagliptin use. Although not all analyses were significant, the overall hazard ratios suggested a higher risk associated with sitagliptin use. When analyzed by the tertiles of cumulative duration, a significantly increased risk could be observed for the first and second tertiles, and the risk became neutral when sitagliptin use was > 14 months in the third tertile. When the hazard ratios were estimated in subgroups of metformin use, a significantly higher risk for sitagliptin ever users versus never users could only be observed among metformin users but not in non-users.
Table 3: Sitagliptin exposure and hazard ratios for thyroid cancer
Sitagliptin use/subgroups of metformin use |
All patients |
Excluding patients with benign thyroid disease |
||||
HR |
95% CI |
P |
HR |
95% CI |
P |
|
I. Original sample |
||||||
Ever users |
1.516 |
(1.011-2.271) |
0.0439 |
1.623 |
(0.978-2.694) |
0.0612 |
Tertiles of cumulative duration of sitagliptin therapy (months) |
||||||
<6.53 |
1.995 |
(1.015-3.919) |
0.0451 |
2.582 |
(1.193-5.591) |
0.0161 |
6.53-14.00 |
2.516 |
(1.451-4.364) |
0.0010 |
2.358 |
(1.141-4.872) |
0.0205 |
>14 |
0.595 |
(0.244-1.449) |
0.2530 |
0.590 |
(0.187-1.862) |
0.3681 |
Subgroups of metformin use |
||||||
Metformin non-users |
1.058 |
(0.418-2.680) |
0.9045 |
1.105 |
(0.333-3.663) |
0.8709 |
Metformin users |
1.675 |
(1.067-2.630) |
0.0251 |
1.792 |
(1.021-3.145) |
0.0420 |
II. Matched sample |
||||||
Ever users |
1.462 |
(0.866-2.466) |
0.1551 |
1.597 |
(0.829-3.077) |
0.1617 |
Tertiles of cumulative duration of sitagliptin therapy (months) |
||||||
<6.53 |
1.936 |
(0.906-4.137) |
0.0881 |
2.725 |
(1.126-6.595) |
0.0262 |
6.53-14.00 |
2.301 |
(1.208-4.386) |
0.0113 |
2.261 |
(0.978-5.225) |
0.0563 |
>14 |
0.574 |
(0.222-1.483) |
0.2516 |
0.557 |
(0.164-1.886) |
0.3469 |
Subgroups of metformin use |
||||||
Metformin non-users |
0.912 |
(0.288-2.882) |
0.8747 |
1.005 |
(0.224-4.512) |
0.9949 |
Metformin users |
1.662 |
(0.923-2.993) |
0.0907 |
1.789 |
(0.863-3.710) |
0.1178 |
Cox regression models were created by incorporation with the inverse probability of treatment weighting using propensity score created from variables in Table 1.
Referent group: never users of sitagliptin
HR: hazard ratio, CI: confidence intervals
Table 4 shows the prevalence of performance of thyroid sonography/aspiration examinations between sitagliptin ever users and never users. Never users of sitagliptin had a significantly higher rate of receiving these examinations.
Table 4: Performance of thyroid sonography/aspiration with regards to sitagliptin use
Sitagliptin |
Cases receiving thyroid sonography/aspiration |
P |
|||
No |
Yes |
||||
n |
% |
n |
% |
||
I. Original sample |
|||||
Never users |
307975 |
98.44 |
4878 |
1.56 |
<0.0001 |
Ever users |
57529 |
98.78 |
709 |
1.22 |
|
II. Matched sample |
|||||
Never users |
56715 |
98.36 |
944 |
1.64 |
<0.0001 |
Ever users |
56960 |
98.79 |
699 |
1.21 |
|
Discussion
The findings suggested a significantly higher risk of thyroid cancer associated with sitagliptin use in the overall analyses comparing ever to never users in the original sample. However, the increased risk could only be observed in the first year of its use (Table 3). Because the baseline characteristics between sitagliptin ever and never users differed significantly in the original sample (Table 1), analyses were also conducted in a well-matched sample. Results derived from this well-matched sample were supportive for the findings in the original sample (Tables 2 and 3).
The studies analyzing the US FDA adverse event reporting system did not consistently find a significantly higher risk of thyroid cancer associated with sitagliptin [3, 4]. In the first analysis a higher risk was observed (though not statistically significant, OR = 1.48, P = 0.65) [3], but the estimated OR (1.08, 95% CI: 0.33-2.81) in the updated analysis suggested a null association [4]. The inconsistent findings during two different periods may be due to inherent limitations related to the use of the adverse event reporting system. These may include a lack of appropriate adjustment for confounders, channelling bias, disproportionate reporting, Weber effect and detection bias [2]. However, it is worthy to note that the 50% higher risk in the first analysis of the FDA database [3] was very close to the 50-60% increased risk in the present study (Table 3). If the increased risk could only be seen during the first year of sitagliptin use as shown in the present study (Table 3), it would not be surprising to see an increased risk in the first analysis of the FDA database and the null association in the second analysis due to the following reasons. During the period of the first analysis, many cases of sitagliptin-related thyroid cancer could have occured when sitagliptin have just been introduced into the market. In the second analysis, the reported cases of thyroid cancer would reduce because many patients have used sitagliptin for more than one year.
A treatment duration of one year might be too short to drive normal follicular cells to malignant change. Therefore, it would be interesting to explain why the risk of thyroid cancer increased only in the first year of sitagliptin use but reduced thereafter (Table 3). GLP-1R is expressed in all types of thyroid cells including normal, premalignant or malignant tissues [5-7]. Although Pyke et al. could not similarly demonstrate GLP-1R in normal thyroid tissues in either monkeys or humans by using a new monoclonal antibody [8], this could not exclude the expression of GLP-1R in pre-malignant and malignant thyroid cells. Stimulation of preexisting premalignant lesions or occult cancer to more rapidly progressive malignancy could be a possible explanation. Although the findings after excluding patients with benign thyroid disease might still indicate a risk association (Table 3), it should be noticed that the study could not exclude patients with undiagnosed subclinical thyroid nodular disease, which is very common in the general population.
On the other hand, with a longer duration of use, sitaglipitn might have exerted other beneficial effects that lead to a reduced risk of thyroid cancer. Recent clinical studies suggested that long-term use of sitagliptin for one year [9] or two years [10] may significantly reduce insulin resistance, an important risk factor for thyroid cancer [11]. The duration of at least one-year use of sitagliptin for reducing insulin resistance [9, 10] corresponded to the time frame for risk attenuation of thyroid cancer after one year of sitagliptin administration in the present study (Table 3). In addition, sitagliptin shows anti-inflammatory effects [12], which may also counteract partly its procancer effect. Therefore, the mechanisms leading to an increased risk of thyroid cancer during the early phase of sitagliptin use might have been counteracted by its long-term effect on the improvement of insulin resistance and inflammation. Whether an even longer duration of sitagliptin use may reduce the risk of thyroid cancer awaits further investigation.
The increased risk associated with sitagliptin use was mainly observed in metformin users but not in non-users (Table 3). The real reasons for such differential effects require further in-depth investigation. However, there are some possible explanations. First, metformin is usually used as a first-line therapy, therefore most of the patients were being treated with metformin when sitagliptin was added. Second, metformin is contraindicated in patients with abnormal renal function or those who were at risk of lactic acidosis, and gastrointestinal side effects can refrain some patients from being treated with metformin. Therefore, indication bias might exist between patients using and not using metformin. Third, the cumulative duration and dose of metformin treatment were not considered and metformin was not treated as a time-varying variable.
If prevalent users had been used in the study, it is possible that sitagliptin users represented those who survived with a less severe clinical disease and the propensity to develop cancer in these patients might not be similar to non-users of sitagliptin. Because the present study included only incident cases of diabetes and new-users of sitagliptin, such a potential “prevalent user bias” [13] should have been minimized. Additionally, the PS-weighted models were created to minimize the confounding of baseline subject characteristics associated with treatment allocation commonly seen in observational studies [14]. The exclusion of patients followed for < 6 months reduced the possibility of “immortal time bias” [15]. The consistency in the original sample and the well-matched sample (Tables 2 and 3) also suggested the reproducibility of the findings. The higher rates of receiving thyroid sonography/aspiration in never users of sitagliptin (Table 4) indicated that if detection bias did exist, this could only overestimate the incidence among never users leading to an underestimation of the hazard ratio comparing ever to never users.
This study has several strengths. First, the NHI databases included all longitudinal claims records, and we caught the diagnoses from all sources. Second, patients with a certified diagnosis of cancer can be waived for most medical co-payments by the NHI. This would reduce the detection bias related to social classes. Third, the potential bias related to self-reporting could be minimized by the use of medical records.
The study limitations included a lack of actual measurement data for potential confounders such as ionizing radiation, anthropometric factors, smoking, alcohol drinking, family history, lifestyle, diet, and genetic parameters. In addition, because of lack of information, it was not possible to evaluate the impacts of some biochemical and hormonal data such as glucose, insulin, C-peptide, lipid profile and thyroid-related hormones. Another limitation is the lack of information on the pathology, grading and staging of thyroid cancer. This would lead to a difficulty in analyzing the mechanism. Because papillary thyroid cancer represents 78.1% and 86.0%, in men and women, respectively, in the Taiwanese population [16], whether the findings of the present study could be related to this type of thyroid cancer and not limited to medullary thyroid cancer as previously suspected [1] awaits further confirmation. Finally, this study did not evaluate the effects of other DPP-4 inhibitors and GLP-1R agonists. Future studies are required to explore whether the findings can be extrapolated to other incretin-based therapies.
In summary, this study suggests that sitagliptin use among Taiwanese patients with type 2 diabetes mellitus may be associated with an increased risk of thyroid cancer, especially within the first year of its use. Therefore, new users of sitagliptin should be closely monitored for thyroid cancer development within the first year of its use. Future studies are required to confirm the findings.
Materials and Methods
Since March 1995 a unique, compulsory and universal health care system covering 99% of the residents, the so called NHI, has been implemented in Taiwan. Detailed description of the NHI databases can be seen elsewhere [17-21]. Diabetes was coded 250.XX and thyroid cancer 193, based on the International Classification of Diseases, Ninth Revision, Clinical Modification (ICD-9-CM).
Figure 1 shows the procedures in recruiting a cohort of patients with newly diagnosed type 2 diabetes mellitus during the period from 1999 to 2008 (original sample). Patients should have been followed after March 1, 2009 (the date of the approval for the reimbursement of sitagliptin by the Bureau of NHI) with 2 or more prescriptions of antidiabetic drugs in the outpatient clinic thereafter (n = 552484). To assure that diabetes was first diagnosed after 1999, patients who had a diagnosis of diabetes mellitus during 1996-1998 were not included. To avoid the contamination of other incretin-based therapies, users of saxagliptin (n = 3885), vildagliptin (n = 2502), and exenatide (n = 154) were excluded. Because incretin-based therapies were not approved for the treatment of type 1 diabetes mellitus, patients who held a Severe Morbidity Card certifying a diagnosis of type 1 diabetes were also excluded (n = 3243). A total of 511 patients were excluded because of missing data. Because incretin-based therapies might confer a potential risk of acute pancreatitis and some cancers like pancreatic cancer and thyroid cancer [2], patients who had been diagnosed at outpatient clinics or during hospitalization as having any cancer (n = 66841), or acute pancreatitis (n = 17792) before entry were excluded. Patients aged < 25 (n = 1687) or > 75 (n = 61604), and those who had been followed up for < 180 days (n = 26401) were also excluded.
Cumulative duration (months) of sitagliptin use was calculated from the reimbursement databases and tertiles of cumulative duration were used for analyses. A number of comorbidities and covariates were included as described in detail previously [17-21]: age, sex, diabetes duration, hypertension (ICD-9-CM code: 401-405), chronic obstructive pulmonary disease (a surrogate for smoking; 490-496), heart failure (398.91, 402.11, 402.91, 404.11, 404.13, 404.91, 404.93 and 428), nephropathy (580-589), eye disease (250.5, 362.0, 369, 366.41 and 365.44), dyslipidemia (272.0-272.4), stroke (430-438), ischemic heart disease (410-414), peripheral arterial disease (250.7, 785.4, 443.81 and 440-448), obesity (278) and benign thyroid disease (240-246). Other antidiabetic medications included sulfonylurea, metformin, meglitinide, acarbose, insulin, pioglitazone and rosiglitazone. Baseline characteristics between never users and ever users were compared by Student’s t test for age and diabetes duration and by Chi-square test for other variables. The accuracy of disease diagnoses in the NHI database has been studied previously. Agreements between claim data and medical records are moderate to substantial, with Kappa values ranged from 0.55 to 0.86 [22].
The incidence density of thyroid cancer was calculated for never users and ever users and for different subgroups of exposure to sitagliptin. The numerator for the incidence was the number of patients with incident thyroid cancer during follow-up, and the denominator was the person-years of follow-up. Follow-up started on the first prescription of sitagliptin or comparators on or after March 1, 2009, and ended on December 31, 2011, at the time of a new diagnosis of thyroid cancer, or on the date of the last reimbursement record.
Logistic regression was used to create propensity score (PS) from the baseline characteristics. The treatment effect was estimated by using PS-weighting with the inverse probability of treatment weighting (IPTW) approach incorporated into a Cox regression [14]. Hazard ratios were estimated for ever users versus never users, and for each tertile of cumulative duration of sitagliptin therapy compared to never users as referent. Because metformin might potentially affect the risk of cancer, hazard ratios for ever versus never users of sitagliptin were also estimated for subgroups of metformin users and non-users, respectively. Because benign thyroid disease is a major risk factor for thyroid cancer, the above models were also created after excluding patients who had a diagnosis of benign thyroid disease at baseline.
To evaluate whether sitagliptin ever users and never users might have different screening rates of thyroid cancer, the prevalence of receiving thyroid sonography/aspiration examinations was compared between the two groups by Chi square test.
Imbalance in baseline characteristics between groups may lead to selection bias or residual confounding. To address these potential problems, additional analyses were conducted by using a 1:1 matched-pair sample based on 8 digits of PS according to the methods described by Parsons (matched sample) [23]. Austin and Stuart proposed a quantitative method as a formal test for balance diagnostics based on the calculation of standardized difference and recommended a value of > 10% as an indication of meaningful imbalance with potential confounding [24]. The standardized differences for all covariates were calculated as described by Austin and Stuart [24].
Analyses were conducted using SAS statistical software, version 9.3 (SAS Institute, Cary, NC). P < 0.05 was considered statistically significant.
Acknowledgments
The study is based in part on data from the National Health Insurance Research Database provided by the Bureau of National Health Insurance, Department of Health and managed by National Health Research Institutes (Registered number 99274). The interpretation and conclusions contained herein do not represent those of Bureau of National Health Insurance, Department of Health or National Health Research Institutes.
Fundings
The study was supported by the Ministry of Science and Technology (MOST 103-2314-B-002-187-MY3) of Taiwan. The publication fee of this paper is supported by the Weng Yuan Endocrine Fund.
Conflicts of Interests
There is no conflict of interest.
References
1. Chiu WY, Shih SR, Tseng CH. A review on the association between glucagon-like peptide-1 receptor agonists and thyroid cancer. Exp Diabetes Res. 2012;2012:924168.
2. Tseng CH, Lee KY, Tseng FH. An updated review on cancer risk associated with incretin mimetics and enhancers. J Environ Sci Health C Environ Carcinog Ecotoxicol Rev. 2015;33:67-124.
3. Elashoff M, Matveyenko AV, Gier B, Elashoff R, Butler PC. Pancreatitis, pancreatic, and thyroid cancer with glucagon-like peptide-1-based therapies. Gastroenterology. 2011;141:150-6.
4. Butler PC, Elashoff M, Elashoff R, Gale EA. A critical analysis of the clinical use of incretin-based therapies: Are the GLP-1 therapies safe? Diabetes Care. 2013;36:2118-25.
5. Vangoitsenhoven R, Mathieu C, Van der Schueren B. GLP1 and cancer: friend or foe? Endocr Relat Cancer. 2012;19:F77-88.
6. Gier B, Butler PC, Lai CK, Kirakossian D, DeNicola MM, Yeh MW. Glucagon like peptide-1 receptor expression in the human thyroid gland. J Clin Endocrinol Metab. 2012;97:121-31.
7. Jung MJ, Kwon SK. Expression of glucagon-like Peptide-1 receptor in papillary thyroid carcinoma and its clinicopathologic significance. Endocrinol Metab (Seoul). 2014;29:536-44.
8. Pyke C, Heller RS, Kirk RK, Ørskov C, Reedtz-Runge S, Kaastrup P, Hvelplund A, Bardram L, Calatayud D, Knudsen LB. GLP-1 receptor localization in monkey and human tissue: novel distribution revealed with extensively validated monoclonal antibody. Endocrinology. 2014;155:1280-90.
9. Derosa G, Carbone A, D’Angelo A, Querci F, Fogari E, Cicero AF, Maffioli P. A randomized, double-blind, placebo-controlled trial evaluating sitagliptin action on insulin resistance parameters and β-cell function. Expert Opin Pharmacother. 2012;13:2433-42.
10. Derosa G, Ragonesi PD, Fogari E, Cicero AF, Bianchi L, Bonaventura A, Romano D, Maffioli P. Sitagliptin added to previously taken antidiabetic agents on insulin resistance and lipid profile: a 2-year study evaluation. Fundam Clin Pharmacol. 2014;28:221-9.
11. Shih SR, Chiu WY, Chang TC, Tseng CH. Diabetes and thyroid cancer risk: literature review. Exp Diabetes Res. 2012;2012:578285.
12. Satoh-Asahara N, Sasaki Y, Wada H, Tochiya M, Iguchi A, Nakagawachi R, Odori S, Kono S, Hasegawa K, Shimatsu A. A dipeptidyl peptidase-4 inhibitor, sitagliptin, exerts anti-inflammatory effects in type 2 diabetic patients. Metabolism. 2013;62:347-51.
13. Ray WA. Evaluating medication effects outside of clinical trials: new-user designs. Am J Epidemiol. 2003;158:915-20.
14. Austin PC. The performance of different propensity score methods for estimating marginal hazard ratios. Stat Med. 2013;32:2837-49.
15. Suissa S. Immortal time bias in pharmaco-epidemiology. Am J Epidemiol. 2008;167:492-9.
16. Bureau of Health Promotion. Cancer Registry Annual Report 2007. Taiwan: Department of Health, Executive Yuan, 2010.
17. Tseng CH. Metformin and endometrial cancer risk in Chinese women with type 2 diabetes mellitus in Taiwan. Gynecol Oncol. 2015;138:147-53.
18. Tseng CH. Pioglitazone and bladder cancer: a population-based study of Taiwanese. Diabetes Care. 2012;35:278-80.
19. Tseng CH. Metformin reduces thyroid cancer risk in Taiwanese patients with type 2 diabetes. PLoS One. 2014;9:e109852.
20. Tseng CH. Diabetes and risk of bladder cancer: A study using the National Health Insurance database in Taiwan. Diabetologia. 2011;54:2009-15.
21. Tseng CH. Metformin may reduce oral cancer risk in patients with type 2 diabetes. Oncotarget. 2016;7:2000-8. doi: 10.18632/oncotarget.6626.
22. Chang L. A study of validation on comorbidity derived from claims data [Master thesis]: National Yang-Ming University; 2004.
23. Parsons LS. Performing a 1:N case-control match on propensity score. http://www.google.com.tw/url?sa = t&rct = j&q = &esrc = s&source = web&cd = 1&ved = 0CBsQFjAAahUKEwibi7HllcnIAhUDoJQKHVeZA9A&url = http%3A%2F%2Fwww2.sas.com%2Fproceedings%2Fsugi29%2F165-29.pdf&usg = AFQjCNFOHGWYu8E8Bn4-Bo1TUiJKtT987Q (last accessed October 17, 2015).
24. Austin PC, Stuart EA. Moving towards best practice when using inverse probability of treatment weighting (IPTW) using the propensity score to estimate causal treatment effects in observational studies. Stat Med. 2015;34:3661-79.