
Introduction
Glioblastoma (GB) is one of the most deadly tumors, with median survival of 12-14 months following diagnosis [1-4]. Surgical resection of GB has only limited effectiveness due to high invasiveness of tumor cells that infiltrate the surrounding brain tissue and cause disease recurrence, with inherent drug resistance of cancer cells rendering the adjuvant chemo- and radiotherapy insufficient to eliminate the invasive cells [5-8]. Novel therapies targeted at specific signaling pathways are required for effective treatment of GB [9, 10]. Approximately 50% of GBs are positive for amplification of epidermal growth factor receptor (EGFR) [11]. Overexpression of EGFR is accompanied in 35-60% of cases by expression of an oncogenic mutant receptor, termed variant III or vIII, that is unique to tumor tissues making it an attractive therapeutic target [12, 13]. Characterized by intragenic deletion of exons 2-7, which constitute the ligand binding domain, EGFRvIII is described as constitutively active receptor. Investigation of EGFRvIII expression in tumor tissue reveals a distinct pattern, with only a small portion of cells being positive for mutant receptor expression [6, 14, 15]. The effects of aberrant signaling by EGFRvIII have been reported to be cell intrinsic as well as extrinsic, with a number of secreted growth factors and cytokines described [16-20]. Both autocrine as well as paracrine signaling are associated with EGFRvIII expression, leading to increased cancer cell growth, survival, proliferation and altered metabolism [21-23]. Also invasiveness of cancer cells expressing EGFRvIII is elevated, with positive correlation in expression of a number of metalloproteinases, MMP-9 in particular [7, 24]. Moreover, dynamic regulation of the EGFRvIII amplicon number has been reported to mediate drug resistance of glioblastoma cells [5, 25]. Taken together, those characteristics define EGFRvIII as a potent oncogene and attractive therapeutic target.
At present, no therapies targeting EGFRvIII are used in the clinic. One of the reasons for this is lack of appropriate models to study the biology of the receptor and, more importantly, develop novel therapeutics. Difficulties associated with establishment of EGFRvIII expressing GB models are related to the loss of EGFR and EGFRvIII amplicons during the in vitro stabilization process, causes of which are unknown [26, 27]. For this reason, neurospheres from primary cancer cells or xenografts thereof are commonly used for research purposes [28]. Unfortunately, low material availability, low stability of the model (neurospheres) or high associated costs (xenografts) make those models inappropriate for drug development process, especially at the early stages of development [26, 28-30]. Alternatively, stable cell lines genetically modified to express EGFRvIII are used [31], however, such models do not account for tumor tissue heterogeneity or extrachromosomal nature of EGFRvIII. Furthermore, reports on direct activation of the signaling pathways, trans-activation of other receptor tyrosine kinases and secretome alterations resulting from EGFRvIII expression vary greatly (e.g. Erdem-Eraslan et al., 2015 [32] and Puliyappadamba et al., 2013 [33]). This demonstrates the need for an appropriate cellular model that depicts the nature of glioblastoma, has extrachromosomal EGFRvIII and is suitable for high throughput studies utilized in drug development.
Results
Analysis of currently used in vitro glioblastoma models
Investigation of the protein activity is best conducted in the environment as close to the native as possible, allowing for insight into the functional biology of the protein. Therefore, we have attempted using neurospheres formed by primary cell cultures obtained from surgical resections. Despite problems with stabilization of the primary cell cultures reported previously [27], we have analyzed nine glioblastoma resections, two of which were positive for EGFRvIII transcript (Figure 1A). Treatment of EGFRvIII-positive neurospheres with erlotinib produced variable results between tumors (Figure 1B and Sup.Figure 1A). Analogous situation was observed upon treatment with EGF, with 50% of spheres from the same tumor not showing any effect and the remaining ones displaying signs of cell death (Sup.Figure 1B). Our attempts at stabilization of the primary glioblastoma cells positive for EGFRvIII in the form of an adherent cell line was only partially successful for only one of the tumors, with cancer cells surviving post-passage 10 without EGFRvIII amplicons. RT-PCR analysis of the EGFRvIII mRNA levels clearly indicated a rapid decline (Figure 1C), consistent with reports in the literature [26, 27].
With stable cell lines offering a less variable model, we attempted inserting EGFRvIII cDNA under the control of the constitutively active CMV promoter into U87-MG and NCI-H460 cell lines using lipofection or lentiviral transduction, respectively. A couple of stable clones were established from both cell lines, however, expression of the transgene varied among them on the mRNA level, despite the same transfection protocol (Figure 1D). Assessment of EGFRvIII expression on the protein level in H460 line using western blotting proved impossible, as a non-specific band was present around 135kDa, size expected for EGFRvIII (Figure 1E). To assure that protein is synthesized and delivered to the correct subcellular localization, we performed immunofluorescent staining (Figure 1F and Sup.Figure 2). Reportedly low specificity of commercially available antibodies against EGFRvIII prompted us to evaluate expression of EGFRvIII as a ratio of total EGFR (antibody recognizes intracellular domain, Sup.Figure 2A) and wild-type receptor (antibody binds to the domain missing from EGFRvIII, Sup.Figure 2B) [6]. Such approach did confirm the presence of EGFRvIII protein in transduced cells, which displayed a level of heterogeneity despite antibiotic selection (Sup.Figure 2C), however, no correlation between mRNA and protein levels was observed. Furthermore, genetic manipulation had an effect on EGFRWT levels with immunofluorescent staining and western blot data indicating decreased levels in both transduced clones in comparison to the parental line (Sup.Figure 2B and Figure 1E, respectively). For those reasons, we did not continue our study with the NCI-H460 line.
U87-MG is a line commonly used to study the biology of EGFRvIII [31]. Lipofection of U87-MG line produced three clones expressing EGFRvIII on the mRNA and protein level, although no correlation between the RT-PCR results (Figure 1D) and western blot analysis (Figure 1E) was observed. This is particularly true for clone 22.12, which had the highest mRNA levels and markedly lowest protein expression of the three clones (Figure 1E). To investigate the effect of EGFRvIII expression on the biology of cell population, we have monitored the number of cells over a five day period (Figure 1G and 1H and Sup.Figure 3). Surprisingly, introduction of EGFRvIII into U87-MG line decreased the proliferative potential of the line in complete medium (Figure 1G). Furthermore, resistance to stress, depicted here as serum starvation, was not changed following expression of EGFRvIII (U87-MG). Finally, negative effect of EGF stimulation on cell viability was previously reported for this model [33]. Surprisingly, we did not observe any changes in cell number upon culturing U87-MG lines in medium supplemented with EGF, despite presence of the wild-type receptor of the ligand (Sup.Figure 3). This might suggest lack of machinery necessary to transduce EGFRvIII signaling or mutations downstream of EGFRvIII that initiate receptor-independent signaling, undermining reliability of the model. Variability in mRNA and protein levels observed despite the same lipofection protocol, as well as discrepancies between reported and obtained results formed the basis for discontinuing studies using genetically modified lines.
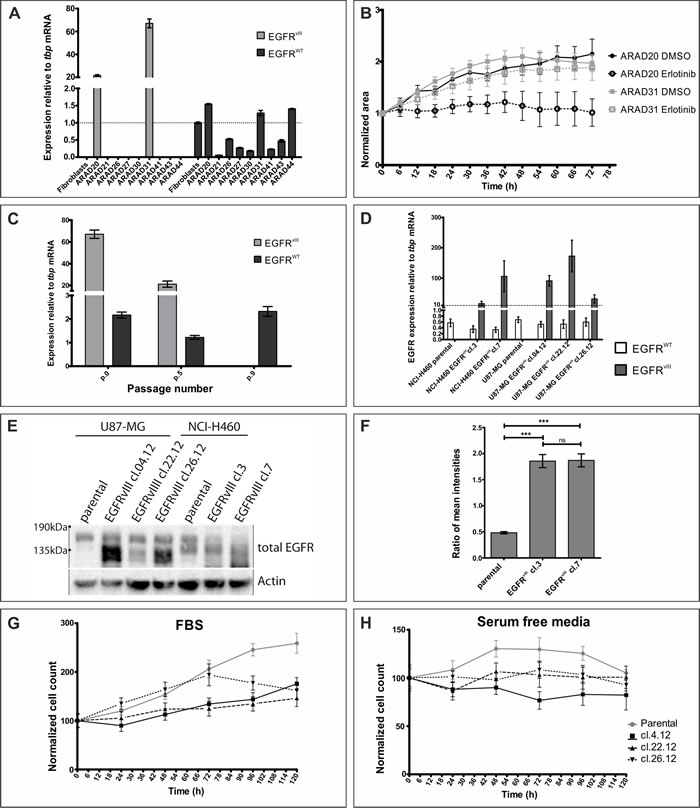
Figure 1: Assessment of models currently used to study EGFRvIII. A. Glioblastoma samples were analyzed on the mRNA level for EGFRvIII and EGFRWT expression. B. Neurospheres obtained from glioblastoma resections positive for EGFRvIII expression were treated with DMSO or erlotinib (10 µM). At least 3 neurospheres were analysed in each condition. C. Adherent cell line established from ARAD31 was cultured over several passages and EGFRvIII and EGFRWT mRNA levels were monitored. D. Stable cell lines, U87-MG and NCI-H460, were modified to express EGFRvIII. Graph shows mRNA levels of EGFRWT and EGFRvIII. E. Western blot analysis of same cell lines as in D. Expected size: EGFRWT - 175kDa, EGFRvIII - 135kDa. Numbers to the left indicate molecular size. Arrows indicate not specific bands in NCI-H460 line. F. Ratio of an average mean fluorescence signal intensity per cell for total EGFR and EGFRWT, an approximation of EGFRvIII expression, is shown for NCI-H460 cell lines. (G and H) Populational growth of U87-MG cell lines in culturing medium supplemented with 10% FBS G. or without any supplements H. is shown. Legend to both graphs is on the right-hand side of H. Error bars indicate SEM. Statistical significance determined by ANOVA analysis with post-analysis Bonferroni’s multiple comparisons test. ***, p < 0.05; ns, not significant.
Characterization of DK-MG lines
To study the biology of the mutant EGF receptor we utilized cell line previously reported to express EGFRvIII endogenously. Del Vecchio and colleagues have characterized DK-MG cells as heterogenous line with populations positive and negative for EGFRvIII expression [13]. We have attempted establishing cell line that is free of EGFRvIII amplicons. Due to the reported low specificity of the anti-EGFRvIII antibodies as well as an unknown effect of those antibodies on cell biology, we have chosen not to use cell sorting, but rather, a serial dilution method. Interestingly, despite establishing numerous clones with varying levels of EGFRvIII expression, we were unable to stabilize a single cell line completely free of EGFRvIII amplicons. For the purpose of this study, we have used clones with the lowest and high levels of EGFRvIII, referred to as DK-MGlow and DK-MGhigh, respectively. MLPA analysis did not reveal any differences between DK-MG lines, other than EGFRvIII, with both lines having normal number of wild-type EGFR copies, hemizygous PTEN and NFkBIA, and CDKN2A deleted; all mutations reminiscent of brain tumors (Figure 2A) [5, 34, 35]. The differences in EGFRvIII DNA levels can be explained by, either, a decrease in the number of cells positive for amplicons or a decrease in the average number of amplicons per cell. FISH analysis indicated that cells without EGFRvIII amplicons constituted much higher fraction of the overall DK-MGlow population, compared to the DK-MGhigh line (Figure 2B and Sup.Figure 4). Only 5% of DK-MGlow population had more than 2 amplicons per cell, in contrast to DK-MGhigh line that had 85% of cells positive for multiple amplicons. Furthermore, FISH analysis confirmed the extrachromosomal nature of EGFRvIII amplicons (Sup.Figure 5) [14, 25].
The drastic difference in the number of cells positive for EGFRvIII amplicons was reflected in the overall EGFRvIII mRNA and protein levels, with DK-MGhigh line being more abundant in the mutant receptor’s transcript and protein (Figure 2C and 2D, respectively). To investigate protein expression on individual cell basis, we utilized immunofluorescent staining technique that we used for assessment of NCI-H460 cell line (Figure 2E). Results of western blot analysis as well as quantification of the fluorescence intensity indicated that the amount of EGFRWT in DK-MGhigh and DK-MGlow lines was very similar, in contrast to the amount of total EGFR per cell that was much higher in DK-MGhigh cell line, indicating that EGFRvIII must be the differentiating factor (Figure 2D and 2E). Approximately 1% of DK-MGlow cells had strongly elevated ratio, implying expression of EGFRvIII (Figure 2F). An alternative approach relied on the phenomenon of EGF-mediated endocytosis of the wild-type receptor, which should leave only stable EGFRvIII in the plasma membrane [36-38]. Following stimulation with EGF, the majority of cells in the DK-MGlow line had signal emanating from small vesicular intracellular compartments, reminiscent of endosomes, with occasional cells staining uniformly throughout the cell body (Figure 2G). Significantly more cells (over 50%) remained uniformly stained in the DK-MGhigh line following similar treatment, however no distinctive populations could be detected due to high heterogeneity of the line (Figure 2F and 2G).
The ability to compare two cell lines with highly similar genetic makeup, yet differing in the EGFRvIII expression, presents a unique opportunity to study the role of EGFRvIII in cell biology, especially in the context of cell population. However, to exclude the possibility that genetic alteration other than EGFRvIII levels has impact on cell and cell population biology, we have performed next generation sequencing of a panel of 408 genes commonly associated with cancer, using Comprehensive Cancer Panel on Ion Torrent PGM (Sup.Table.1). Detailed analysis revealed presence of a number of mutations, however, no major discrepancy in the mutation profile between two lines was detected.
Importantly, numerous reports indicated rapid decrease in the number of extracellular amplicons during any attempt of culturing glioblastoma cells in vitro [26]. We have evaluated the EGFRvIII transcript levels as well as amplicon number over an extensive number of passages (Sup.Figure 6A and 6B, respectively). We did not detect any significant differences between cells in early and late passages, indicating stability of the genetic makeup of the cellular population.
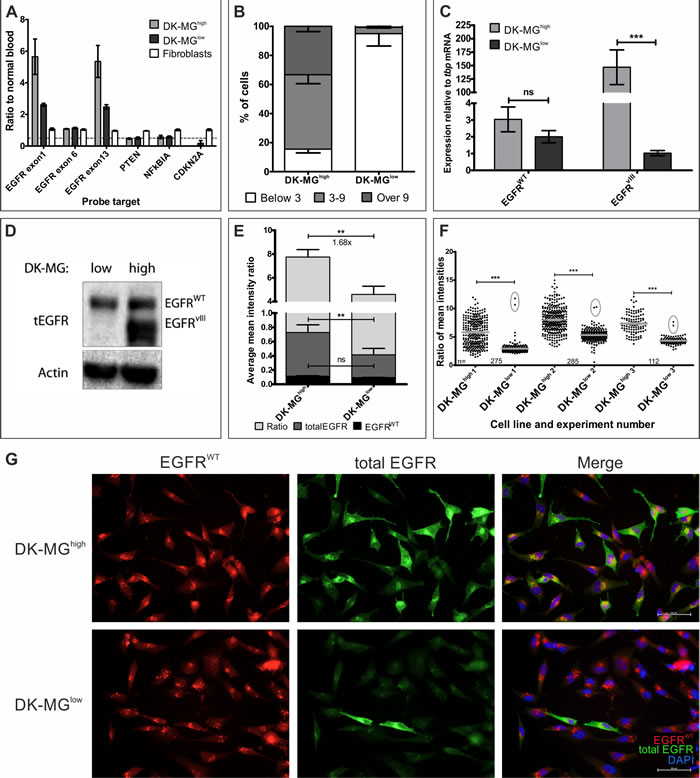
Figure 2: Characterization of the DK-MGlow and DK-MGhigh cell lines. A. MLPA analysis of the DK-MG lines in comparison to fibroblasts. Dashed line marks ratio of 0.5. B. Quantification of the composition of two DK-MG lines with regards to the number of amplicons per nuclei. C. Investigation of EGFRWT and EGFRvIII mRNA levels in DK-MG lines. D. Western blot comparison of both DK-MG lines using antibody recognizing wild-type and mutant EGFR. E. Quantification of an average mean fluorescence signal intensity per cell for total EGFR, EGFRWT and total EGFR/EGFRWT ratio, an approximation of EGFRvIII expression, is shown. Fold change of ratio is shown below the top statistical bar. F. Scatter plot of antibody signal intensity ratio for individual cells in each experiment summarized in E is shown. Cells with very high ratio in DK-MGlow line are circled. Grey lines indicate average value with SEM, n for each line in experiment is given. G. Representative images of EGF-mediated degradation of EGFRWT, observed as intracellular dots, following 1 h treatment with EGF. Cells strongly positive for total EGFR are likely to be EGFRvIII positive. Images obtained using 20x objective. Error bars indicate SEM. Statistical significance calculated by Student’s t-test. *, p < 0.05; **, p < 0.01; ***, p < 0.005; ns, not significant.
Function of EGFRvIII in the context of cell population
One of the major hallmarks of tumor cells is their ability to penetrate the extracellular matrix. Study of cell invasiveness using Matrigel trans-wells indicated statistically significant difference between cells cultured with and without attractant presence (Figure 3A). Consistent with the previous reports indicating that EGF can act as an attractant during chemotactic invasion, we have observed that addition of EGF to the bottom side of the trans-wells resulted in a significant increase in the number of invading cells in the DK-MGhigh line, but not in the DK-MGlow line [39]. This implies that EGFRvIII contributes towards elevated invasiveness of cells, even though it cannot bind the ligand itself. The golden standard experiment in cancerogenesis is the ability of cells to form tumors in vivo [28]. We have attempted inoculating immunocompromised mice (SCID Hairless Outbred, SHO line) with both DK-MG cell lines and measured tumor volume over a course of 6 weeks (Table 1). To make a direct comparison of DK-MG lines, each mouse was inoculated with DK-MGlow and DK-MGhigh cells injected into opposite flanks of the animal. Half of animals did not present with tumor masses on flanks injected with DK-MGlow line, in contrast to DK-MGhigh cells that produced solid masses in all mice. Additionally, one mouse displayed regression of the DK-MGlow cells-induced tumor mass. Despite significant differences in tumor growth and size, these data confirms that EGFRvIII contributes towards invasiveness of cancer cells.
Table 1: Mice inoculated with DK-MG cells.
Mouse |
Matrigel |
Day (mm3) |
|||
Inoculation |
14 |
21 |
40 |
||
1 |
Full |
DK-MGhigh |
26.51 |
26.70 |
18.38 |
DK-MGlow |
none |
none |
none |
||
2 |
GFR |
DK-MGhigh |
15.48 |
16.78 |
21.39 |
DK-MGlow |
48.44 |
57.81 |
62.06 |
||
3 |
Full |
DK-MGhigh |
27.78 |
71.84 |
58.16 |
DK-MGlow |
27.26 |
11.59 |
none |
||
4 |
GFR |
DK-MGhigh |
16.34 |
47.52 |
56.27 |
DK-MGlow |
none |
none |
none |
||
SHO mice were inoculated with a mixture of 2x10⁵ DK-MG cells with matrigel. DK-MGlow cells were injected subcutaneously into the right flank of the animal, DK-MGhigh cells were injected into the left flank of the animal. Full or growth factor reduced (GFR) matrigel was used in the experiment. Table shows the volume (in cubic mm) of solid tumors formed.
Another significant difference between two cell lines that confirms EGFRvIII to be an oncogene is the rate of populational growth (Figure 3B). DK-MGhigh line grew at a faster pace than the DK-MGlow line under the same culture conditions. Interestingly, under serum-free conditions, the EGFRvIII-higly expressing line did proliferate at a moderate rate, in contrast to the EGFRvIII-low line that showed a decrease in cell number. Addition of EGF rescued DK-MGlow line from reduction of the cell number and elevated growth of DK-MGhigh line. This implies that EGF acts on DK-MG cells not only as an attractant, but also as a growth factor. Moreover, aberrant EGFRvIII signaling does not saturate the signal transduction machinery of the cell, confirming the qualitative difference between the wild-type and mutant receptors, suggested previously [33, 40]. To confirm that elevated growth rate of DK-MGhigh line is a result of deregulated EGFR signaling pathway, we used an inhibitor of the kinase domain of EGFR, erlotinib, which does not discriminate wild-type EGFR from its mutant version (Figure 3C). Erlotinib did not affect populational growth of the DK-MGlow line, however it did negate the positive effect of EGFRvIII on the population growth in the DK-MGhigh line.
As the DK-MGhigh population is very heterogenous for EGFR expression, we have attempted investigating whether the amount of total EGFR in cells correlates with the proliferation rate, measured by BrdU incorporation. Surprisingly, we observed that cells strongly positive for EGFRvIII as well as those deprived of it, within the same population, undergo genome replication at an equal rate (Figure 3D). Under the same conditions, cells in the DK-MGlow line negative for EGFRvIII expression replicate DNA very effectively (Figure 3E).When we compared BrdU incorporation in DK-MGhigh and DK-MGlow line, the former line displayed higher incorporation rate when cultured in serum free and serum free with EGF supplemented conditions, albeit statistical significance was reached only in the presence of EGF (Figure 3F). Culturing of cells in complete medium (10% FBS) did not produce any differences between cell lines.
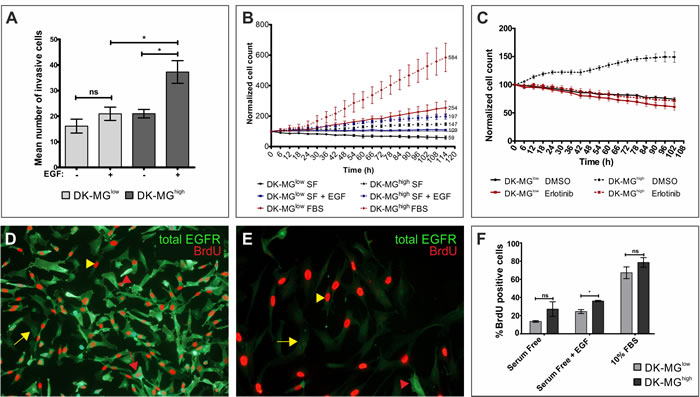
Figure 3: Relationship between expression of EGFRvIII and the biology of cell population. A. Invasiveness of DK-MG cell lines was measured on matrigel invasion transwells three days after the initial seeding, with EGF serving as an attractant. B. Populational growth of both cell lines, DK-MGlow (continuous line) and DK-MGhigh (dashed line), in serum free media (black circle) supplemented with 20 ng/mL EGF (blue square) or 10% FBS (red diamonds) is shown as a percentage of initial number of cells. Numbers on the right side of the plot indicate the final cell count. C. Populational growth rate for both DK-MG lines upon treatment with 10 µM erlotinib or control DMSO. (D and E) Representative image depicting BrdU incorporation into DK-MGhigh D. and DK-MGlow E. cell line after 5 days in serum free media. Red arrow: high total EGFR and BrdU-positive, red arrowhead: high EGFR and BrdU-negative, yellow arrow: low EGFR and BrdU-positive, yellow arrow: low EGFR and BrdU-negative. 20x and 40x objectives were used, respectively in D and E. F. Quantification of BrdU incorporation expressed as a percentage of BrdU positive cells in the population after 1 day of cell culture under the indicated culture conditions. Error bars indicate SEM. Statistical significance calculated by paired Student’s t-test. *, p < 0.05; ns, not significant.
PI3K/Akt signaling pathway is activated to the same extent in both DK-MG cell lines
Considering that canonical EGFR signaling activates PI3K/Akt pathway, which is associated with regulation of cell proliferation, we have investigated phosphorylation of Akt (Figure 4A, quantified in B and C). As Akt can be activated by phosphorylation of two independent residues, Serine 473 and Threonine 308, we have assessed both sites for post-translational modification. Both residues did undergo change in the phosphorylation status following stimulation with EGF, as expected. Comparison of the phosphorylation level under steady-state conditions did not reveal any differences between DK-MGhigh and DK-MGlow lines (Figure 4A-4C). In order to assess the direct correlation between abundance of EGFRvIII and Akt phosphorylation, we have performed co-staining with antibodies recognizing total EGFR as well as phosphorylated Akt on S473 (Figure 4D). No correlation between the amount of EGFRvIII (extrapolated from the constant level of EGFRWT between cells) and Akt phosphorylation was observed.
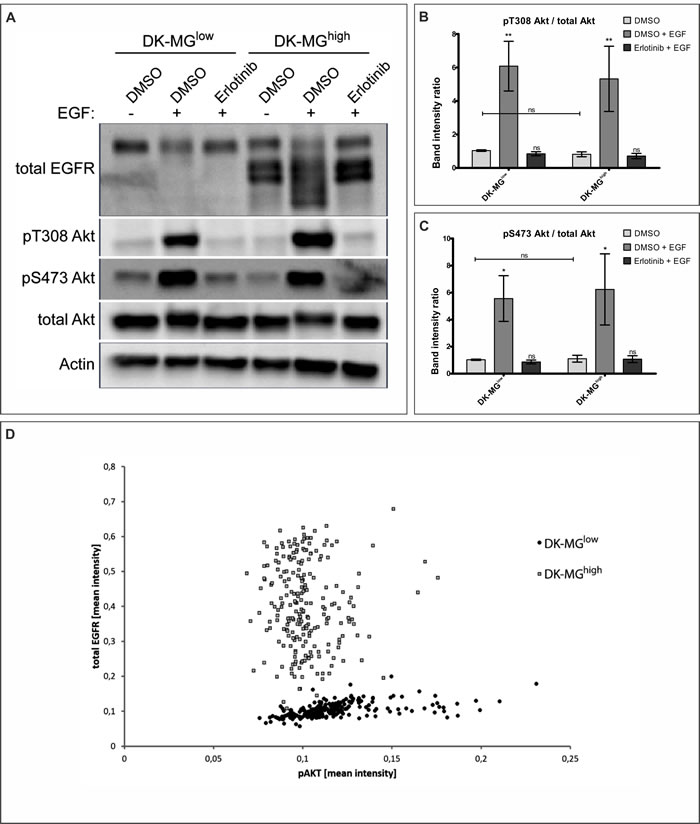
Figure 4: DK-MG cell lines do not differ in PI3K/Akt signaling pathway activation levels. A. DK-MGlow and DK-MGhigh lines pre-treated with DMSO or erlotinib were stimulated with EGF as indicated prior to lysis and analysis via western blot. Representative image is shown. Phosphorylation of Akt on Threonine 308 and Serine 473 was assessed with specific antibodies. (B and C) Quantification of blot in A, displaying ratio of band density of pT308 B. and pS473 C. over total Akt is shown. Asterisks over bars indicate statistical significance towards DMSO control for the line tested. D. Scatter plot indicating correlation between mean intensity of antibodies against total EGFR (Y-axis) and pS473 Akt (X-axis) per cell is shown. Each dot represents individual cell, with black dots representing DK-MGlow and grey squares representing DK-MGhigh cells.Error bars indicate SEM. Statistical significance calculated by two-way ANOVA with Bonferroni’s post-comparison test; ***, p < 0.005; **, p < 0.01; *, p < 0.05; ns, not statistically significant.
EGFRvIII contributes towards elevated viability of cells
Considering the differences between cell lines in the rate of population growth (Figure 3B) and very limited difference in DNA replication rate (Figure 3E), it is possible that cells in the DK-MGlow population undergo cell death more often than cells in the EGFRvIII- highly expressing population do. To test this hypothesis, we have investigated propidium iodide incorporation as a measure of cell viability (Figure 5A). As expected, DK-MGlow cells displayed lower viability than their counterparts, under all culture conditions. Interestingly, similar portion of population of each cell line underwent cell death, irrespective of culture conditions. To elucidate the mechanism of cell death, we have performed a western blot analysis looking at cleavage of PARP, a substrate of the Caspase family of proteases. More cleaved form of PARP was observed in the DK-MGlow line in cells cultured in serum free medium supplemented with EGF as well as 10% FBS (Figure 5B). Interestingly, cells cultured in serum free media without any supplements had similar levels of cleaved PARP between lines. Confirmation of this result came from the synthetic reporter of Caspase 3/7 activity, which stained more cells in the DK-MGlow line compared to the DK-MGhigh line (Figure 5C). Both of those results implicate apoptosis as a means of cell death, which occurs more often in the DK-MGlow line.
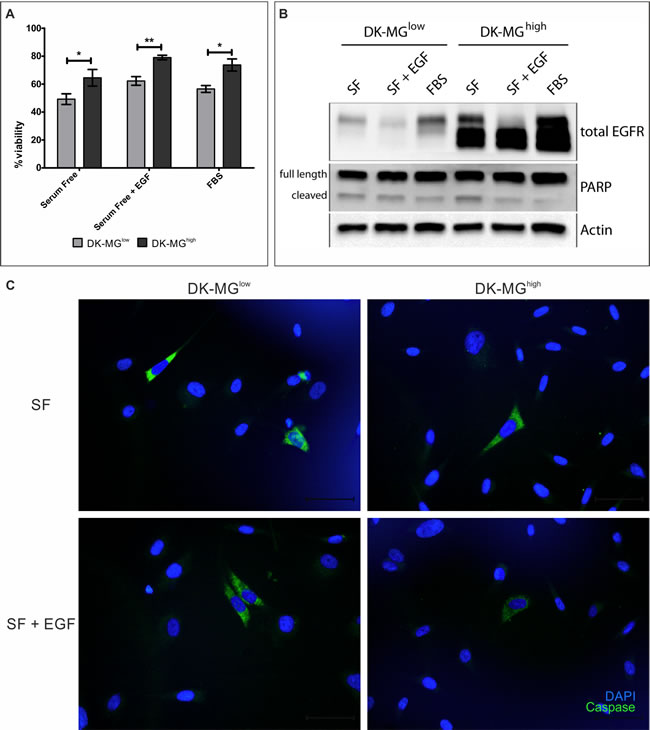
Figure 5: EGFRvIII affects viability of DK-MG cell lines. A. Comparison of viability of both DK-MG cell lines, measured by propidium iodide incorporation after 3 days of culturing under the indicated conditions. B. Cleavage of PARP for both cell lines was assessed using western blotting. Full length and cleaved forms of PARP are indicated on the left hand side of panels. C. Representative images showing activity of the synthetic Caspase 3/7 reporter in serum free media (top panel) or supplemented with 20 ng/mL EGF (bottom panel). The number of reporter positive cells was higher in the DK-MGlow line under both culture conditions, without any signs of clumping of apoptotic cells. 40x objective used. Error bars indicate SEM. Statistical significance calculated by paired Student’s t-test. *, p < 0.05; **, p < 0.01; ***, p < 0.005.
Elevated EGFRvIII expression correlates with NFκB signaling pathway activation
One of the main signaling pathways playing a pro-survival role is the Nuclear Factor κ B (NFκB) signaling pathway, which has been previously shown to be affected by the EGFRvIII signaling [40-42]. To assess whether this is the molecular mechanism underlying the differences in cell viability between the two DK-MG cell lines, we have assessed phosphorylation of p65, as a measure of pathway activation (Figure 6A, quantified in 6B). In both cell lines, treatment with TNFα, a ligand described to result in NFκB pathway activation, caused a strong increase in p65 phosphorylation. Comparison of the two DK-MG cell lines indicated stronger activity of the NFκB pathway in the DK-MGhigh line under steady-state, serum-free conditions. Confirmation of the NFκB pathway playing a differentiating role between the two DK-MG cell lines came from populational growth study performed in the presence of inhibitors CID2858522 and ACHP (Figure 6C). Importantly, only DK-MGhigh line was affected by the inhibitors, significantly decreasing the populational growth rate, but not to the level observed in the DK-MGlow line. Indicated inhibitors were able to decrease the p65 phosphorylation only in the DK-MGhigh line (Sup.Figure 7).
Interestingly, previous reports indicated a relationship between expression of EGFRvIII, activity of the NFκB pathway and expression of the members of Bcl family of pro-survival proteins, including Bcl-XL [43, 44]. Investigation of the mRNA levels of the BCL-XL gene indicated that DK-MGhigh cells had higher levels of transcript under steady-state conditions, which would correlate with elevated viability of the line (Figure 6D) [45]. However, treatment with NFκB pathway inhibitors, ACHP or CID2858522, has not decreased the mRNA levels of Bcl-XL. Taken together, these data indicate that EGFRvIII is involved in protecting cells from apoptosis, however the molecular mechanism is not linear via NFκB pathway and remains to be elucidated.
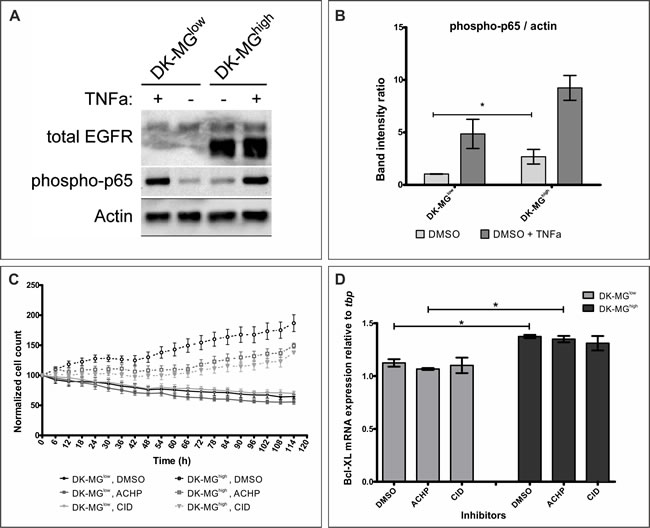
Figure 6: EGFRvIII aberrantly activates the NFκB pathway. A. Representative western blot analysis of the DK-MG lines treated for 20min with TNF, as indicated. B. Quantification of 6 independent western blots as shown in A. phosphorylated p65 band was normalized to Actin for quantification purposes. Under steady state conditions NFκB pathway is active to higher degree in DK-MGhigh line compared to the DK-MGlow line. C. Size of the DK-MGlow (continuous line) and DK-MGhigh (dashed line) populations over time when cultured in serum free media with DMSO (black dot), ACHP at 2.5µM (grey square) or CID2858522 at 1µM (light grey diamond) added. Both NFκB inhibitors affect populational growth of the DK-MGhigh line, but not the DK-MGlow line. The number of cells is statistically different for DK-MGhigh line between DMSO treated and ACHP and CID treated from 48h and 60h, respectively (as determined by two-way ANOVA with Bonferroni’s post-test, p < 0.05). D. mRNA levels of Bcl-XL was measured in DK-MG cell lines incubated with NFκB pathway inhibitors or control carrier for 3 days. Inhibitors did not affect Bcl-XL expression in either cell line, however, difference between the two lines can be observed.
Error bars indicate SEM. Statistical significance calculated by paired Student’s t-test. *, p < 0.05; **, p < 0.01; ***, p < 0.005; ns, not significant.
Discussion
Despite EGFRvIII being an attractive therapeutic target, no treatments focusing on it are used in the clinic [10, 46]. One of the major obstacles in development of effective drugs for treatment of glioblastoma is lack of relevant models, suitable for early-stage drug development studies often requiring high-throughput approaches. Majority of studies are conducted on cell lines ectopically expressing the mutant receptor or neurospheres [6, 26, 47]. Our experience indicates that neurospheres are not suitable for high throughput studies due to limited material availability, experimental variability and issues with stability of model’s molecular profile (Figure 1A-1C and Sup.Figure 1). Those results reflect findings reported in the literature on the loss of EGFRvIII and EGFRWT amplicons [26, 29, 48-51]. The neurospheres made of glioblastoma cells proved difficult to maintain over prolonged periods of time (more than 15 passages), with senescence described as the predominant cause, irrespective of the culture conditions [30, 52, 53]. Fact that spheroids can not to be cultured infinitely in vitro forced Johnson and colleagues to use immunocompromised mice as neurosphere “incubators,” with serial xenografting of the neurospheres between animals [28]. This approach is not viable for all purposes due to bioethical issues, high costs associated with the use of murine models and relatively difficult access to animal facilities suitable for maintaining SCID mice. Finally, the uniqueness of the genetic profile of the patient naturally introduces high degree of variability into the model, questioning the reproducibility of data. With that in mind, it is reasonable to use patient-derived neurospheres to confirm the key findings or to validate the efficiency of the developed therapeutic strategy. On the other hand, genetically engineered stable cell lines can vary between laboratories depending on their preparation methodologies and culture conditions, as evidenced by our own experience and contradicting results (i.e. effects of EGF stimulation on cells) reported in the literature [32, 33] (Figure 1D-1G and Sup.Figure 2). Furthermore, such models do not take into account the extrachromosomal nature of EGFRvIII, which has an impact on drug resistance and can be a significant obstacle in development of novel therapeutics [25, 46]. The proposed DK-MG cellular models are therefore highly attractive tools to study the biology of EGFRvIII as well as to develop drugs targeting the oncogenic receptor, as all of the aforementioned aspects are encompassed by the proposed model - reproducibility, limited costs and reflection of the tumor biology.
Clonal selection of a cell line completely free of EGFRvIII proved impossible to stabilize, in contrast to DK-MGlow line composed in vast majority of cells negative for EGFRvIII and only small portion of cells EGFRvIII-positive (Figure 2, Sup.Figure 4). The exact number of cells expressing mutant receptor in this cell DK-MG line was around 5% according to FISH analysis and 1% on the protein level (immunofluorescent studies; Figure 2B, 2F and 2G, respectively). Two potential causes underlie such discrepancy - either the methods employed are not sufficiently sensitive to detect changes on the protein level resulting from the small number of amplicons (below 10), or expression of EGFRvIII is somehow regulated post-transcriptionally or epigenetically (e.g. miRNA, protein folding or methylation), which has been reported previously [36, 50, 54, 55]. With regards to the amplicon number and protein levels per cell, the number of EGFRvIII-positive cells in the DK-MGhigh line was much higher compared to the DK-MGlow line, however no distinctive populations could be observed in FISH and immunofluorescence studies, indicative of high heterogeneity (Figure 2B and 2F, respectively). Of particular importance is the fact that EGFRvIII mRNA levels as well as amplicon number did not change over prolonged culturing periods (Sup.Figure 6), even though loss of EGFRvIII amplicons during in vitro adaptation process of primary tumor cells has been observed by us (Figure 1C) and consistently reported in the literature [26, 27]. Stability of the DK-MG line, also confirmed by Struve and colleagues [55], is of particular importance in scientific research and drug development, where model’s stability is a basic requirement.
Controversial is the role of EGFRvIII in the processes such as populational growth, cell proliferation and viability, with contradicting results reported [25, 40, 44, 55, 56]. However, only a small subset of publications recognizes that populational growth depends on the proliferation rate as well as cell viability, which have opposite effects. We have indicated that BrdU incorporation, a measure of DNA replication essential to the proliferation process, of both DK-MG lines is very similar when not stressed by nutrient deprivation (FBS supplementation) (Figure 3D-3F). Interestingly, proliferation rate of the DK-MGhigh line in serum free media is trending to be higher than that of DK-MGlow line, although statistical significance has not been reached. Those results find confirmation in the molecular studies, which show similar levels of PI3K/Akt signaling pathway activation in both DK-MG cell lines (Figure 4A-4D), pathway that is associated with the proliferation and survival processes, a result identical to the one observed by Struve and colleagues [55, 57, 58]. It should be noted that PI3K/Akt signaling pathway is often referred to as the main signal transducer of the EGFRvIII signaling, which is contradictory to our data [6, 22, 41, 59]. A potential reason of this discrepancy is the hemizygous status of PTEN, the main negative regulator of the pathway, which can upregulate pathway activity in both DK-MG lines irrelevant of EGFRvIII (Figure 2A).
In contrast to the effect of EGFRvIII on proliferation, viability of both DK-MG cell lines differed significantly under all conditions tested (Figure 5A). Cleavage of PARP as well as readout from the synthetic Caspase activity reporter indicate that DK-MGlow line cells are more prone to undergo apoptosis (Figure 5B, 5C). This observation is supported by elevated activation of the NFκB pathway in the DK-MGhigh line, which is strongly associated with pro-survival activity (Figure 6A and 6B) [34, 60]. Interestingly, differences between lines have been observed despite negative regulator of the pathway, NFKBIA gene, being heterozygous in both DK-MG cell lines (Figure 2A). This suggests how strong activation of the NFκB pathway by EGFRvIII is. Importantly, suppression of the pathway activity by small molecule inhibitors CID2858522 and ACHP has affected only cells in the DK-MGhigh line, which confirms a correlation between EGFRvIII expression and NFκB pathway activity, described previously in the literature (Figure 6C) [41, 42, 61]. In contrast to previous reports, EGFRvIII induced NFκB signaling does not result in elevated transcription of a pro-survival factor, Bcl-XL in DK-MG cells, as concluded from lack of effect of CID2858522 and ACHP on Bcl-XL mRNA levels (Figure 6D) [41, 62]. This is despite the elevated Bcl-XL transcript levels in the DK-MGhigh line (Figure 6D), which might be a result of the activity of the JAK/STAT signaling pathway, reported previously but not investigated by us [44].
Taken together, combination of higher survivability of the DK-MGhigh line with comparable proliferation rates results in much higher populational growth of cell line enriched in EGFRvIII expression (Figure 3B). Fact that EGFR specific Tyrosine kinase inhibitor, erlotinib, can suppress this growth advantage indicates the central role of EGFRvIII. It has to be noted that different growth rate of DK-MGhigh and DK-MGlow lines contradicts recent report from Kriegs lab, who isolated similar subpopulations of DK-MG cells by FACS [55]. Observed differences might be a result of technical differences in cell culture or methodologies applied.
Another important conclusion from our data is the sole fact of establishment of the DK-MGlow line implies that even small number of cells expressing EGFRvIII is required for populational survival and growth. Similar conclusions could be drawn from reports of Nathanson et al. as well as Struve et al., who isolated subpopulations of cancer cells with smaller number of EGFRvIII-positive cells, however never truly depleted of it, albeit using different methodologies [25, 55]. Studies on the naïve tumor tissue confirm the hypothesis, that small subset of cells positive for EGFRvIII expression is required [14, 15, 25, 63, 64]. A plausible interpretation is that paracrine signaling initiated by EGFRvIII-positive cells is required for survival of the cancer associated cells as well as cancer cells negative for EGFRvIII expression. A number of reports indicated paracrine secretion as paramount to glioblastoma growth, with ligands such as TGFα, IL-6, ΙL-8, HGF and heparin binding EGF playing central role, further supporting the hypothesis [16, 26, 42, 65-67]. Obviously, such result does not exclude the possibility that EGFRvIII acts in a cell intrinsic manner, as depicted by previous report on the effect of shRNA mediated silencing of EGFRvIII resulting in cell death [68]. This implies that a combination of cell-intrinsic and -extrinsic effects is relevant and so, heterogenous populations of cells are more appropriate models to study biology of EGFRvIII.
Moreover, we have observed strong correlation between EGFRvIII expression level and invasiveness of cell line in vitro as well as in vivo (Figure 3A and Table 1, respectively). Such correlation is in line with previous reports on the matter [7, 20, 28, 69, 70]. It should be noted, that we cannot conclude whether elevated invasiveness is a cell intrinsic or cell extrinsic effect of EGFRvIII signaling, with both aspects reported in the literature.
Besides functioning as an attractant (Figure 3A), we have observed that EGF positively influenced populational growth of both cell lines (Figure 3B). This result is contradictory to previous reports indicating cells positive for EGFRvIII to undergo apoptosis in response to EGF stimulation [29, 40] . Stimulation of EGFRvIII-positive glioblastoma derived neurospheres with EGF produced variable results, whilst U87-MG cells expressing EGFRvIII (same model as in the literature report) did not respond to the stimulus. The contradictions between results within the same model indicate how sensitive model establishment process is, with minor aspects dramatically influencing the outcome.
Finally, we propose that combination of DK-MG cell lines is a suitable model to study the biology of EGFRvIII as well as develop drugs targeting it. With different number of cells expressing EGFRvIII in both lines, drugs targeting the mutant receptor should affect each line to a different extent. At the same time, both lines proved to be highly stable, with no amplicon loss over time (Sup.Figure 6), in contrast to primary cell cultures (Figure 1C). Neurospheres, an alternative model, produced varying results (Figure 1B and Sup.Figure 1) in contrast to reproducible results from DK-MG lines. Finally, DK-MG lines proved highly heterogenous (Sup.Figure 4 and 6) with extrachromosomal EGFRvIII amplicons (Sup.Figure 5), in contrast stable cell lines (Sup.Figure 2) and reminiscent of glioblastoma tissue [14, 15, 25, 63]. Therefore, we propose the use of DK-MG cell lines as an attractive tool for early stage drug development stages, that require more high-throughput approach, while utilizing the patient-derived neurosphere cultures at the later stages of drug validation, giving good measure of drug safety and effectiveness in different genetic makeups. Similarly, basic research can be conducted on DK-MG lines with validation of key concepts performed on the more costly patient derived cells.
Materials and methods
Cell culture
DK-MG cells were obtained from DSMZ (Cat. no. ACC-277) and cultured in RPMI 1640 (GIBCO, Life Technologies, Cat. no. 11875-093) medium supplemented with 1% Penicillin/Streptomycin (Life Technologies, Cat. no. 15140-122), 0.2% Gentamycin (Biowest, Cat. no. L0011-100) and 10% FBS (PAA, Cat. no. A15-104) under standard cell culture conditions (5% CO2, 16% O2, 37°C). Clonal selection was performed by serial dilution in a 96-well plate format.
U87-MG cells were obtained from ATCC (Cat. no. HTB-14™) and cultured in MEM (GIBCO, Life Technologies, Cat. no. 11095-080) medium supplemented with 1% Penicillin/Streptomycin (Life Technologies, Cat. no. 15140-122), 0.2% Gentamycin (Biowest, Cat. no. L0011-100) and 10% FBS (PAA, Cat. no. A15-104) under standard cell culture conditions (5% CO2, 16% O2, 37°C).
NCI-H460 cells were obtained from ATCC (Cat. no. HTB-177™) and cultured in RPMI 1640 (GIBCO, Life Technologies, Cat. no. 11875-093) medium supplemented with 1% Penicillin/Streptomycin (Life Technologies, Cat. no. 15140-122), 0.2% Gentamycin (Biowest, Cat. no. L0011-100) and 10% FBS (PAA, Cat. no. A15-104) under standard cell culture conditions (5% CO2, 16% O2, 37°C).
Construction of pLV1-puro-DEST vector
The pIRESpuro plasmid (Clontech Laboratories, Cat. no. 6031-1) was digested with EcoRI and BamHI restriction enzymes (both New England Biolabs, Cat. no. R0101 and R0136, respectively), blunt-ended with T4 DNA polymerase (New England Biolabs, Cat. no. M0203) and ligated with Gateway Rf.A reading frame cassette. Afterwards, the CMV-GW-IRES-puro fragment was PCR-amplified, digested with HpaI/SnaBI (both New England Biolabs, Cat. no. R0105 and R0130, respectively) and ligated with pLOC-RFP vector (Thermo Scientific, Cat. no. OHS5922) previously digested with Bsu36I/SnaBI enzymes (both New England Biolabs, Cat. no. R0524 and R0130, respectively). Electrophoretic analysis and DNA sequencing were performed to verify the resulting recombinant vectors.
Preparation of EGFRvIII inserts
Total RNA was isolated from DK-MG cell line (DSMZ, Cat. no. ACC-277) using an AllPrep DNA/RNA Mini Kit (Qiagen, Cat. no. 80204) according to the manufacturer’s protocol. cDNA synthesis was conducted using M-MuLV reverse transcriptase (New England Biolabs, Cat. no. M0253) from 500 ng of total RNA. Sequence encoding EGFRvIII was amplified by PCR using primers 5’ - GGGGACAAGTTTGTACAA AAAAGCAGCGTATGCG ACCCTCCGGGACGGCC - 3’ and 5’ - GGGGACCACTTTGTACA AGAAAGCT GGGTTGCTCCAATAAATTCACTGC - 3’. Subsequently, PCR products were cloned into a shuttle vector pDONR/ZeoTM (Life Technologies, Cat. no. 12535-035) by BP Clonase II Enzyme Mix (Life Technologies, Cat. no. 11789-100) according to the manufacturer’s protocol. Resulting recombinant plasmids were then cloned into pLV1-puro-DEST lentiviral vectors by LR Clonase II Enzyme Mix (Life Technologies, Cat. no. 11791-100) following the manufacturer’s recommendations. Alternatively, EGFRvIII was amplified with 5’ - GACTG CTAGCCGCCACCAT GCGACCCTCCGGGACGGCC - 3’ and 5’- GACTTTCGAATCATGCTCCAATAAATTCACTGC-3’ and PCR products were cloned into a shuttle vector pIRESneo3 (Clontech Laboratories, Cat. no. 631621) sites by classical cloning with the use of NheI/BstBI restriction enzymes (both New England Biolabs, Cat. no. R0131 and R0519, respectively), Shrimp Alkaline Phosphatase (New England Biolabs, Cat. no. M0371) and T4 DNA Ligase (New England Biolabs, Cat. no. M0202).
Lentivirus production
Lentivirus carrying EGFRvIII sequence was prepared using LENTI-Smart kit (InvivoGen, Cat. no. Its-str) following the manufacturer’s recommendations in HEK293T cell line (ATCC, Cat. no. CRL-1573™). HEK293T cells were seeded at a density of 7x10⁶ cells/10 cm dish and grown in DMEM High glucose (Biowest, Cat. no L0102) supplemented with 10% FBS (PAA, Cat. no. A15-104) and incubated at 37°C, 5% CO2. Twenty four hours after the initial plating, transfection medium containing LENTI-Smart and lentiviral transfer plasmids was added. The cell culture medium was changed the following day and collected for the next two days. Cellular debris was removed from the supernatants by filtration through a 0.45 µm filter. Lentiviral molecules were concentrated with 100 kDa cut-off Amicon Ultra centrifugal filter (Merck Millipore, Cat. no. UFC910024). HT-1080 (ATCC, Cat. no. CCL-121™) cell line was used to titter lentiviral vectors based on puromycin resistance.
Transduction of NCI-H460 and clonal selection
NCI-H460 cells were seeded at 1x10⁵ cells per well in a 6-well plate, allowed to adhere for 24h and transduced with equal amounts of lentivirus encoding EGFRvIII. Cells were selected using puromycin (5 µg/mL; InvivoGen, Cat. no. ant-pr-1) supplemented complete growth media for 5 days. Puromycin was used throughout cell culture for maintenance purposes (1 µg/mL).
Transfection of U87-MG and clonal selection
Transient transfection was performed with Lipofectamine® LTX Reagent (Life Technologies, Cat. no. 15338-100) following the manufacturer’s protocol. Briefly, on day prior transfection the U87-MG cells were plated at 0.5x10⁶ cells/well on a 6-well plate in complete growth medium. At approximately 70% confluency, medium was changed for fresh complete growth medium and cells were transfected. 12 µL of Lipofectamine LTX Reagent per well was diluted in 150 µL Opti-MEM® Medium (GIBCO, Life Technologies, Cat. no. 31985-070) and 2.5 µg of each plasmid DNA (pIRESneo3, pIRESneo3/gw EmGFP and pIRESneo3-EGFRvIII) per well was diluted in another 150 µL Opti-MEM® Medium. After that, 2.5 µL of Plus® Reagent was added into Opti-MEM® Medium with diluted DNA. Diluted DNA with Plus® Reagent and diluted Lipofectamine® LTX Reagent were mixed at ratio 1:1, incubated for 10 min in RT and then 250 µL of DNA-reagent complex was added into each well and cells were incubated at 37°C for 24h post-transfection (before assaying for transgene expression and selection).
Transfected cells were positively selected for 7 days in G418 (0.4 mg/mL; InvivoGen, Cat. Code ant-gn-1). Approximately 10 days after transfection, positively selected colonies were picked, transferred into separate wells of 24 well plates for further propagation.
Invasion assay
Invasion assay was performed using BioCoat Matrigel Invasion Chambers in 24-well plate format (Corning, Cat. no. 354480), according to manufacturer instructions. Briefly, DK-MG cells from both lines were seeded at 1x10⁴ per transwell in medium supplemented with 10% FBS (PAA, Cat. no. A15-104) on both sides. Medium was changed to serum free media after 24h and EGF at 20 ng/mL (Sigma, Cat. no. E9644) was added to the medium in the lower chamber. After three days of incubation, transwells were prepared into slides with Coomassie Blue used for cell staining. Images from seven random fields of view were obtained from each transwell and the average number of invasive cells was determined.
Viability assay
Cells seeded at 2x10⁵/well in 6-well plates were left to adhere overnight and incubated for 3 days in serum free medium on its own or supplemented with 10% FBS (PAA, Cat. no. A15-104) or 20 ng/mL EGF mL (Sigma, Cat. no. E9644). At this point, cells were scraped off without any medium change and viability assay was carried out using AccuChip4x kit on ADAM (Digital Bio) according to manufacturer guidelines.
Tumor samples
Tissue samples were obtained from patients diagnosed with glioblastoma undergoing tumor resection at the Department of Neurosurgery, Hospital of Saint Raphael in Krakow or at the Clinical Department of Neurosurgery, The Voivodal Specialistic Hospital in Olsztyn. All samples were collected using the protocol approved by the Bioethical Committee of the Medical University of Lodz (Approval No RNN/9/10/KE). Written informed consent was obtained from all patients and their data were processed and stored according to the principles expressed in the Declaration of Helsinki. The patients were diagnosed according to the World Health Organization Criteria for Brain Tumor Classification (2007).
Isolation of cells from fresh glioblastoma specimens started within 3 hours after neurosurgical operation. Neurosurgical specimens were shipped in 1x Hank’s Balanced Salt Solution (Biowest, Cat. no. L0607).
Establishment and growth of GB cells under the classical culture conditions
Fresh glioblastoma samples were washed twice with 1x Hank’s BSS (Biowest, Cat. no. L0607), centrifuged for 90 s at 80 x g each time, cut into < 1 mm3 fragments, washed again with 1x Hanks’ BSS and digested with collagenase type IV and dispase (both 200 U/mL; GIBCO, Life Technologies, Cat. no. 17104-019, StemCell Technologies, Cat. no. 07923, respectively) on shaker for 30 min at 37°C. Digested tissue was filtered using a 70 µm cell strainer (BD Biosciences, Cat. no. 352350). Filtered cells were washed twice with 1x Hank’s BSS with 90 s centrifugation at 80 × g and seeded onto 6-well plates at 2.5-5x10⁵ cells/well. Cells were cultured in Neurobasal Medium (GIBCO, Life Technologies, Cat. no. 21103-049) with B27 supplement (20 µl/mL; GIBCO, Life Technologies; Cat. no. 17504-044), Glutamax (10 µl/mL; GIBCO, Life Technologies; Cat. no. 35050-061), fibroblast growth factor-2 (20 ng/mL; Sigma, Cat. no. F0291), NEAA (GIBCO, Life Technologies, Cat. no. 11140-050) and heparin (2 µg/mL; StemCell Technologies, Cat. no. 07980). Growth factors and heparin were added twice a week. To assess effects of EGF or erlotinib, neurospheres were moved to new plates and cultured in AGM™ Astrocyte Growth Medium (Lonza, Cat. no. CC-3187) with AGM BulletKit (Lonza, Cat. no. CC-3186) for 24h to allow adhesion and either EGF (20 ng/mL), erlotinib (10 mM) or DMSO, where appropriate, were added. Neurospheres were imaged using BioStation CT, as described for stable cell lines. To establish stable cell lines, spheres were split by mechanical dissociation and transferred to new dish when they reached the size of 200-500 µm. Cells were cultured under normal culture conditions in AGM™ Astrocyte Growth Medium with AGM BulletKit.
MLPA
Multiplex Ligation-dependent Probe Amplification (MLPA) was carried out using P105-D1 Glioblastoma-2 probemix (MRC-Holland, Cat. no. D1-0413) and SALSA MLPA EK1 kit - FAM (MRC-Holland, Cat. no. EK1-FAM), as described in [27].
Inhibitors used
DK-MG cells were seeded in 6-well plates at 2x10⁵ cells per well for western blot analysis or at 4x10⁴ cells per well for real-time observation, incubated overnight to allow for adhesion and serum starved for subsequent 24h. Serum free medium containing appropriate inhibitors was applied onto cells and incubated for indicated amount of time, prior to stimulation with 20ng/mL EGF (Sigma-Aldrich) or 5ng/mL TNFa (Cell Signaling Technology) for 20 or 30min, as indicated, prior to lysis for western blotting or left for real-time observation.
Following concentrations of inhibitors were used: DMSO (Sigma, Cat. No.D2438, solvent control), 10 µM Erlotinib (Molecula; Cat. No. 89983631), 2.5 µM ACHP (Tocris Bioscience, Cat. No. 4547), 1 µM CID2858522 (Tocris Bioscience, Cat. No. 4246).
Western blotting
Cells were lysed in cell lysis buffer (50 mM Tris-HCl pH 7.5, 1 mM EDTA, 1 mM EGTA, 1 mM Sodium Orthovanadate, 10 µM β-glycerophosphate, 5 µM Sodium Pyrophosphate and 0.5% Triton X-100) freshly supplemented with Protease Inhibitor Cocktail (Sigma, Cat. no. P8340) at 4°C. Proteins were purified by centrifugation for 5 min at 7,000 x g, separated on 8% SDS-PAGE and transferred onto the PVDF membrane (Immobilon - P, Merck Millipore, Cat. no. IPVH00010). Membrane was blocked with 5% PhosphoBlocker Blocking Reagent (Cell Biolabs, Cat. no. AKR-104) and probed with antibodies listed in Sup.Table.2. Bands were visualized using Amersham ECL Prime Western Blotting Detection Reagent (GE Healthcare, Cat. no. RPN2232) on ChemiDoc XRS (Bio-Rad).
BrdU incorporation, immunofluorescence and image analysis
5-bromo-2’-deoxyuridine incorporation assay as well as immunofluorescent analysis was performed as described previously [27]. Briefly, cells were fixed in 4% PFA/PBS, permeabilized with 0.1% Triton-X100/PBS and blocked with 2% donkey serum (Sigma, Cat. no. D9663) and incubated with appropriate antibodies (Sup.Table.2). For EGFRWT degradation experiment, cells were stimulated with EGF (20 ng/mL;Sigma, Cat. no. E9644) for 1h prior to fixation. Alexa Fluor 568 Phalloidin (Life Technologies, Cat. no. A12380) was incubated at 1:50 together with secondary antibodies, according to manufacturer guidelines. Following fixation of slides with Prolong Gold with DAPI (Life Technologies, Cat. no. P36935), slides were imaged on Nikon Eclipse Ci (Nikon, Tokyo, Japan) fluorescent microscope, images were captured using NIS - Elements F (Nikon, Tokyo, Japan) Software and processed using ImageJ software [71]. In case of a synthetic Caspase 3/7 activity reporter - CellEvent Caspase-3/7 Green (Life Technologies, Cat. no. R37111) - live cells were incubated with the solution for 1h according to manufacturer guidelines. Cells were fixed and imaged as described above. Obtained images were analyzed using CellProfiler freeware analysis software [72]. At least 100 cells were used per single analysis.
Quantitative real-time PCR
Total RNA was isolated as described for NGS. Concentration of nucleic acids was measured spectrophotometrically (NanoPhotometer, Implen) and 250 ng of total RNA was used for reverse transcribed using a QuantiTect Rev. Transcription Kit (Qiagen, Cat. no. 205311) according to the manufacturer’s protocol. 50 ng of prepared cDNA was used in qRT-PCR reaction as a template along with 200 nM of each primer, 6 µL of SYBR Select Master Mix (2X) (Life Technologies, Cat. no. 4472908) and total volume of 12 µL on StepOne-Plus Real-Time PCR System (Life Technologies). Sup.Table.3 summarizes primer sequences used. The cycling conditions were as follows: 2 min at 50°C, 10 min at 95°C, followed by 40 cycles of: 15 s at 95°C, 30 s at 60°C and 30 s at 72°C. To confirm the specificity of the amplification signal, the gene dissociation curve was considered in each case, using LinRegPCR software. Normalized relative expression level was calculated utilizing the method described previously by Pfaffl and colleagues [73], based on each sample’s average Ct value and each gene’s average PCR efficiency. The pool for qRT-PCR containing EGFRvIII that does not occur in normal tissue, mRNA isolated from 15 cancer tissues positive for mutant receptor was pooled and diluted 50 times.
Real time cell observation
DK-MG cells were seeded at 4x10⁴ cells/well in 6-well plates, left overnight to adhere in full medium, serum starved for 24h, pre-treated with indicated inhibitors for 1h and incubated in serum free medium supplemented with 20 ng/mL of EGF (Sigma, Cat. no. E9644) or 10% FBS (PAA, Cat. no. A15-104) as indicated. At this time plate was placed in BioStation CT (Nikon) and incubated for 5 days under normal culture conditions (16% O2, 5% CO2). Every 6h five images per well were taken at 10 x magnification, with first set of images taken within 3h following loading into the machine. Cell counts were performed using CL-Quant Software v3.10 (DRVision Technologies).
Mice inoculation and measurement
Crl:SHO-PrkdcscidHrhr mice were delivered by Animalab (Poznan, Poland) and all studies involving mice were conducted in accordance with federal and institutional guidelines. Xenograft tumors were generated as described in [74]. Briefly, DK-MG cells cultured under standard conditions were collected by centrifugation, supernatant was discarded and cell clumps eliminated. 2x10⁶ cells were mixed with equal volume of Matrigel (BD Biosciences, Cat. no. 356234) and injected subcutaneously on the right/left flank of 5-6 week old mice. The two longest perpendicular axes in the x/y plane of each xenograft tumor were measured 3 times a week with an electronic caliper and tumor volume was calculated according to formula: 0.5xy2 [75]. After 6 weeks, mice were sacrificed.
Reproducibility and statistical analysis
All experiments were conducted in at least three replicates and representative images/graphs are shown. Relevant statistical analysis method is indicated in the figure legend. Analysis was performed in GraphPad Prism 5 (Graphpad Software).
Acknowledgments
Words of gratitude are directed towards Ms. Monika Rieske for help in figure preparation and Michal Bienkowski for comments and suggestions.
Grant support
This study was supported by Innovative Economy Operational Programme grant no. POIG.01.04-00-10-037/11-00. Studies on glioblastoma samples were supported by National Science Center Grant No.2011/03/N/NZ1/06534.
Conflicts of Interest
Authors declare that there are no conflicts of interest.
References
1. Stupp R, Mason WP, van den Bent MJ, Weller M, Fisher B, Taphoorn MJB, Belanger K, Brandes AA, Marosi C, Bogdahn U, Curschmann J, Janzer RC, Ludwin SK et al. Radiotherapy plus concomitant and adjuvant temozolomide for glioblastoma. N Engl J Med. 2005; 352: 987–96.
2. Stupp R, Hegi ME, Mason WP, van den Bent MJ, Taphoorn MJB, Janzer RC, Ludwin SK, Allgeier A, Fisher B, Belanger K, Hau P, Brandes AA, Gijtenbeek J et al. Effects of radiotherapy with concomitant and adjuvant temozolomide versus radiotherapy alone on survival in glioblastoma in a randomised phase III study: 5-year analysis of the EORTC-NCIC trial. Lancet Oncol. 2009; 10: 459–66.
3. Xu LW, Chow KKH, Lim M, Li G. Current vaccine trials in glioblastoma: A review. J Immunol Res. 2014; 2014: 796856.
4. Nagane M, Coufal F, Lin H, Bögler O, Cavenee WK, Huang HJ. A common mutant epidermal growth factor receptor confers enhanced tumorigenicity on human glioblastoma cells by increasing proliferation and reducing apoptosis. Cancer Res. 1996;56: 5079–86.
5. Brennan CW, Verhaak RGW, McKenna A, Campos B, Noushmehr H, Salama SR, Zheng S, Chakravarty D, Sanborn JZ, Berman SH, Beroukhim R, Bernard B, Wu C-J et al. The somatic genomic landscape of glioblastoma. Cell. 2013;155: 462–77.
6. Gan HK, Cvrljevic AN, Johns TG. The epidermal growth factor receptor variant III (EGFRvIII): Where wild things are altered. FEBS J. 2013; 280: 5350–70.
7. Choe G, Park JK, Jouben-Steele L, Kremen TJ, Liau LM, Vinters H V, Cloughesy TF, Mischel PS. Active matrix metalloproteinase 9 expression is associated with primary glioblastoma subtype. Clin Cancer Res. 2002; 8: 2894–901.
8. Giese A, Bjerkvig R, Berens ME, Westphal M. Cost of migration: invasion of malignant gliomas and implications for treatment. J Clin Oncol. 2003; 21: 1624–36.
9. Patel MA, Kim JE, Ruzevick J, Li G, Lim M. The future of glioblastoma therapy: synergism of standard of care and immunotherapy. Cancers (Basel). 2014; 6: 1953–85.
10. Reardon DA, Wen PY, Mellinghoff IK. Targeted molecular therapies against epidermal growth factor receptor: past experiences and challenges. Neuro Oncol. 2014; 16 Suppl 8: viii7–13.
11. Snuderl M, Fazlollahi L, Le LP, Nitta M, Zhelyazkova BH, Davidson CJ, Akhavanfard S, Cahill DP, Aldape KD, Betensky RA, Louis DN, Iafrate AJ. Mosaic amplification of multiple receptor tyrosine kinase genes in glioblastoma. Cancer Cell. 2011; 20: 810–7.
12. Wong AJ, Ruppert JM, Bigner SH, Grzeschik CH, Humphrey PA, Bigner DS, Vogelstein B. Structural alterations of the epidermal growth factor receptor gene in human gliomas. Proc Natl Acad Sci U S A. 1992; 89: 2965–9.
13. Del Vecchio CA, Giacomini CP, Vogel H, Jensen KC, Florio T, Merlo A, Pollack JR, Wong AJ. EGFRvIII gene rearrangement is an early event in glioblastoma tumorigenesis and expression defines a hierarchy modulated by epigenetic mechanisms. Oncogene. 2013; 32: 2670–81.
14. Francis JM, Zhang CZ, Maire CL, Jung J, Manzo VE, Adalsteinsson VA, Homer H, Haidar S, Blumenstiel B, Pedamallu CS, Ligon AH, Love JC, Meyerson M et al. EGFR variant heterogeneity in glioblastoma resolved through single-nucleus sequencing. Cancer Discov. 2014; 4: 956–71.
15. Inda MDM, Bonavia R, Mukasa A, Narita Y, Sah DWY, Vandenberg S, Brennan C, Johns TG, Bachoo R, Hadwiger P, Tan P, DePinho RA, Cavenee W et al. Tumor heterogeneity is an active process maintained by a mutant EGFR-induced cytokine circuit in glioblastoma. Genes Dev. 2010; 24: 1731–45.
16. Ramnarain DB, Park S, Lee DY, Hatanpaa KJ, Scoggin SO, Otu H, Libermann TA, Raisanen JM, Ashfaq R, Wong ET, Wu J, Elliott R, Habib AA. Differential gene expression analysis reveals generation of an autocrine loop by a mutant epidermal growth factor receptor in glioma cells. Cancer Res. 2006; 66: 867–74.
17. Fan QW, Cheng C, Gustafson WC, Charron E, Zipper P, Wong R, Chen J, Lau J, Knobbe-Thomsen C, Weller M, Jura N, Reifenberger G, Shokat K et al. EGFR Phosphorylates Tumor-Derived EGFRvIII Driving STAT3/5 and Progression in Glioblastoma. Cancer Cell. 2013; 24: 438–49.
18. Polisetty RV, Gupta MK, Nair SC, Ramamoorthy K, Tiwary S, Shiras A, Chandak GR, Sirdeshmukh R. Glioblastoma cell secretome: Analysis of three glioblastoma cell lines reveal 148 non-redundant proteins. J Proteomics. 2011; 74: 1918–25.
19. Formolo CA, Williams R, Gordish-Dressman H, MacDonald TJ, Lee NH, Hathout Y. Secretome signature of invasive glioblastoma multiforme. J Proteome Res. 2011; 10: 3149–59.
20. Sangar V, Funk CC, Kusebauch U, Campbell DS, Moritz RL, Price ND. Quantitative proteomic analysis reveals effects of EGFR on invasion-promoting proteins secreted by glioblastoma cells. Mol Cell Proteomics. 2014; 13: 2618–31.
21. Xing W-J, Zou Y, Han Q-L, Dong Y-C, Deng Z-L, Lv X-H, Jiang T, Ren H. Effects of epidermal growth factor receptor and phosphatase and tensin homologue gene expression on the inhibition of U87MG glioblastoma cell proliferation induced by protein kinase inhibitors. Clin Exp Pharmacol Physiol. 2013; 40: 13–21.
22. Feng H, Hu B, Vuori K, Sarkaria JN, Furnari FB, Cavenee WK, Cheng S-Y. EGFRvIII stimulates glioma growth and invasion through PKA-dependent serine phosphorylation of Dock180. Oncogene. 2014; 33: 2504–12.
23. Do Carmo A, Balça-Silva J, Matias D, Lopes MC. PKC signaling in glioblastoma. Cancer Biol Ther. 2013;14: 287–94.
24. Lal A, Glazer CA, Martinson HM, Friedman HS, Archer GE, Sampson JH, Riggins GJ. Mutant epidermal growth factor receptor up-regulates molecular effectors of tumor invasion. Cancer Res. 2002; 62: 3335–9.
25. Nathanson DA, Gini B, Mottahedeh J, Visnyei K, Koga T, Gomez G, Eskin A, Hwang K, Wang J, Masui K, Paucar A, Yang H, Ohashi M et al. Targeted Therapy Resistance Mediated by Dynamic Regulation of Extrachromosomal Mutant EGFR DNA. Science. 2014; 343: 72–6.
26. Patane M, Porrati P, Bottega E, Morosini S, Cantini G, Girgenti V, Rizzo A, Eoli M, Pollo B, Sciacca FL, Pellegatta S, Finocchiaro G. Frequency of NFKBIA deletions is low in glioblastomas and skewed in glioblastoma neurospheres. Mol Cancer. 2013; 12: 160.
27. Stoczynska-Fidelus E, Piaskowski S, Bienkowski M, Banaszczyk M, Hulas-Bigoszewska K, Winiecka-Klimek M, Radomiak-Zaluska A, Och W, Borowiec M, Zieba J, Treda C, Rieske P. The failure in the stabilization of glioblastoma-derived cell lines: Spontaneous in vitro senescence as the main culprit. PLoS One. 2014; 9: e87136.
28. Johnson H, Del Rosario AM, Bryson BD, Schroeder MA, Sarkaria JN, White FM. Molecular characterization of EGFR and EGFRvIII signaling networks in human glioblastoma tumor xenografts. Mol Cell Proteomics. 2012; 11: 1724–40.
29. Schulte A, Günther HS, Martens T, Zapf S, Riethdorf S, Wülfing C, Stoupiec M, Westphal M, Lamszus K. Glioblastoma stem-like cell lines with either maintenance or loss of high-level EGFR amplification, generated via modulation of ligand concentration. Clin Cancer Res. 2012; 18: 1901–13.
30. Stockhausen M-T, Kristoffersen K, Stobbe L, Poulsen HS. Differentiation of glioblastoma multiforme stem-like cells leads to downregulation of EGFR and EGFRvIII and decreased tumorigenic and stem-like cell potential. Cancer Biol Ther. 2014; 15: 216–24.
31. Huang PH, Miraldi ER, Xu AM, Kundukulam VA, Amanda M, Rosario D, Flynn RA, Cavenee WK, Furnari FB, Forest M. Phosphotyrosine signaling analysis of site-specific mutations on EGFRvIII identifies determinants governing glioblastoma cell growth. Mol Biosyst. 2010; 6: 1227–37.
32. Erdem-Eraslan L, Gao Y, Kloosterhof NK, Atlasi Y, Demmers J, Sacchetti A, Kros JM, Sillevis Smitt P, Aerts J, French PJ. Mutation specific functions of EGFR result in a mutation-specific downstream pathway activation. Eur J Cancer. 2015; 51: 893–903.
33. Li L, Puliyappadamba VT, Chakraborty S, Rehman A, Vemireddy V, Saha D, Souza RF, Hatanpaa KJ, Koduru P, Burma S, Boothman DA, Habib AA. EGFR wild type antagonizes EGFRvIII-mediated activation of Met in glioblastoma. Oncogene. 2015; 34: 1–6.
34. Bredel M, Scholtens DM, Yadav AK, Alvarez AA, Renfrow JJ, Chandler JP, Yu IL, Carro MS, Dai F, Tagge MJ, Ferrarese R, Bredel C, Phillips HS et al. NFKBIA deletion in glioblastomas. N Engl J Med. 2011; 364: 627–37.
35. Knobbe CB, Merlo A, Reifenberger G. Pten signaling in gliomas. Neuro Oncol. 2002; 4: 196–211.
36. Wikstrand CJ, Hale LP, Batra SK, Hill ML, Humphrey PA, Kurpad SN, McLendon RE, Moscatello D, Pegram CN, Reist CJ. Monoclonal antibodies against EGFRvIII are tumor specific and react with breast and lung carcinomas and malignant gliomas. Cancer Res. 1995; 55: 3140–8.
37. Banaszczyk M, Stoczynska-Fidelus E, Winiecka-Klimek M, Bienkowski M, Och W, Rieske P, Piaskowski S. EGFRvIII--a stable target for anti-EGFRvIII therapy. Anticancer Res. 2013; 33: 5343–8.
38. Goh LK, Huang F, Kim W, Gygi S, Sorkin A. Multiple mechanisms collectively regulate clathrin-mediated endocytosis of the epidermal growth factor receptor. J Cell Biol. 2010; 189: 871–83.
39. Mutch LJ, Howden JD, Jenner EPL, Poulter NS, Rappoport JZ. Polarised clathrin-mediated endocytosis of EGFR during chemotactic invasion. Traffic. 2014; 15: 648–64.
40. Puliyappadamba VT, Chakraborty S, Chauncey SS, Li L, Hatanpaa KJ, Mickey B, Noorani S, Shu H-KG, Burma S, Boothman DA, Habib AA. Opposing effect of EGFRWT on EGFRvIII-mediated NF-κB activation with RIP1 as a cell death switch. Cell Rep. 2013; 4: 764–75.
41. Tanaka K, Babic I, Nathanson D, Akhavan D, Guo D, Gini B, Dang J, Zhu S, Yang H, De Jesus J, Amzajerdi AN, Zhang Y, Dibble CC et al. Oncogenic EGFR signaling activates an mTORC2-NF-κB pathway that promotes chemotherapy resistance. Cancer Discov. 2011; 1: 524–38.
42. Bonavia R, Inda MM, Vandenberg S, Cheng S-Y, Nagane M, Hadwiger P, Tan P, Sah DWY, Cavenee WK, Furnari FB. EGFRvIII promotes glioma angiogenesis and growth through the NF-κB, interleukin-8 pathway. Oncogene. 2012; 31: 4054–66.
43. Nagane M, Levitzki A, Gazit A, Cavenee WK, Huang HJ. Drug resistance of human glioblastoma cells conferred by a tumor-specific mutant epidermal growth factor receptor through modulation of Bcl-XL and caspase-3-like proteases. Proc Natl Acad Sci U S A. 1998; 95: 5724–9.
44. Latha K, Li M, Chumbalkar V, Gururaj A, Hwang Y, Dakeng S, Sawaya R, Aldape K, Cavenee WK, Bogler O, Furnari FB. Nuclear EGFRvIII-STAT5b complex contributes to glioblastoma cell survival by direct activation of the Bcl-XL promoter. Int J Cancer. 2013; 132: 509–20.
45. Kang MH, Reynolds CP. Bcl-2 inhibitors: targeting mitochondrial apoptotic pathways in cancer therapy. Clin Cancer Res. 2009; 15: 1126–32.
46. Padfield E, Ellis HP, Kurian KM. Current Therapeutic Advances Targeting EGFR and EGFRvIII in Glioblastoma. Front Oncol. 2015; 5: 5.
47. Kinsella P, Howley R, Doolan P, Clarke C, Madden SF, Clynes M, Farrell M, Amberger-Murphy V. Characterization and response of newly developed high-grade glioma cultures to the tyrosine kinase inhibitors, erlotinib, gefitinib and imatinib. Exp Cell Res. Elsevier Inc. 2012; 318: 641–52.
48. Vogel TW, Zhuang Z, Li J, Okamoto H, Furuta M, Lee Y-S, Zeng W, Oldfield EH, Vortmeyer AO, Weil RJ. Proteins and protein pattern differences between glioma cell lines and glioblastoma multiforme. Clin Cancer Res. 2005; 11: 3624–32.
49. Rae JM, Scheys JO, Clark KM, Chadwick RB, Kiefer MC, Lippman ME. EGFR and EGFRvIII expression in primary breast cancer and cell lines. Breast Cancer Res Treat. 2004; 87: 87–95.
50. Ge H, Gong X, Tang CK. Evidence of high incidence of EGFRvIII expression and coexpression with EGFR in human invasive breast cancer by laser capture microdissection and immunohistochemical analysis. Int J Cancer. 2002; 98: 357–61.
51. Bigner SH, Humphrey PA, Wong AJ, Vogelstein B, Mark J, Friedman HS, Bigner DD. Characterization of the epidermal growth factor receptor in human glioma cell lines and xenografts. Cancer Res. 1990; 50: 8017–22.
52. Stoczynska-Fidelus E, Och W, Rieske P, Bienkowski M, Banaszczyk M, Winiecka-Klimek M, Zieba J, Janik K, Rosiak K, Treda C, Stawski R, Radomiak-Zaluska A, Piaskowski S. Spontaneous In Vitro Senescence of Glioma Cells Confirmed by an Antibody Against IDH1R132H. Anticancer Res. 2014; 34: 2859–67.
53. Witusik-Perkowska M, Rieske P, Hułas-Bigoszewska K, Zakrzewska M, Stawski R, Kulczycka-Wojdala D, Bienkowski M, Stoczynska-Fidelus E, Gresner SM, Piaskowski S, Jaskolski DJ, Papierz W, Zakrzewski K et al. Glioblastoma-derived spheroid cultures as an experimental model for analysis of EGFR anomalies. J Neurooncol. 2011; 102: 395–407.
54. Saikali S, Avril T, Collet B, Hamlat A, Bansard J-Y, Drenou B, Guegan Y, Quillien V. Expression of nine tumour antigens in a series of human glioblastoma multiforme: interest of EGFRvIII, IL-13Ralpha2, gp100 and TRP-2 for immunotherapy. J Neurooncol. 2007; 81: 139–48.
55. Struve N, Riedel M, Schulte A, Rieckmann T, Grob TJ, Gal A, Rothkamm K, Lamszus K, Petersen C, Dikomey E, Kriegs M. EGFRvIII does not affect radiosensitivity with or without gefitinib treatment in glioblastoma cells. Oncotarget. 2015; 6: 33867–77. doi: 10.18632/oncotarget.5293.
56. Chen J-R, Xu H-Z, Yao Y, Qin Z-Y. Prognostic value of epidermal growth factor receptor amplification and EGFRvIII in glioblastoma: meta-analysis. Acta Neurol Scand. 2015; 132: 310–22.
57. Hemmings BA, Restuccia DF. PI3K-PKB/Akt pathway. Cold Spring Harb Perspect Biol. 2012; 4: a011189.
58. Testa JR, Tsichlis PN. AKT signaling in normal and malignant cells. Oncogene. 2005; 24: 7391–3.
59. Zadeh G, Bhat KL, Aldape K. EGFR and EGFRvIII in Glioblastoma: Partners in Crime. Cancer Cell. 2013; 24: 403–4.
60. Lin Y, Bai L, Chen W, Xu S. The NF-κB activation pathways, emerging molecular targets for cancer prevention and therapy. Expert Opin Ther Pat. 2011;14(1):45–55.
61. Puliyappadamba VT, Hatanpaa KJ, Chakraborty S, Habib AA. The role of NF-κB in the pathogenesis of glioma. Mol Cell Oncol. 2014; 1: e963478.
62. Zhu H, Cao X, Ali-Osman F, Keir S, Lo H-W. EGFR and EGFRvIII interact with PUMA to inhibit mitochondrial translocalization of PUMA and PUMA-mediated apoptosis independent of EGFR kinase activity. Cancer Lett. 2010; 294: 101–10.
63. Nishikawa R, Sugiyama T, Narita Y, Furnari F, Cavenee WK, Matsutani M. Immunohistochemical analysis of the mutant epidermal growth factor, deltaEGFR, in glioblastoma. Brain Tumor Pathol. 2004; 21: 53–6.
64. Nishikawa R, Ji XD, Harmon RC, Lazar CS, Gill GN, Cavenee WK, Huang HJ. A mutant epidermal growth factor receptor common in human glioma confers enhanced tumorigenicity. Proc Natl Acad Sci U S A. 1994; 9: 7727–31.
65. Li L, Chakraborty S, Yang C-R, Hatanpaa KJ, Cipher DJ, Puliyappadamba VT, Rehman A, Jiwani AJ, Mickey B, Madden C, Raisanen J, Burma S, Saha D et al. An EGFR wild type-EGFRvIII-HB-EGF feed-forward loop regulates the activation of EGFRvIII. Oncogene. 2014; 33: 4253–64.
66. Roberts PJ, Der CJ. Targeting the Raf-MEK-ERK mitogen-activated protein kinase cascade for the treatment of cancer. Oncogene. 2007; 26: 3291–310.
67. Gurgis FMS, Yeung YT, Tang MXM, Heng B, Buckland M, Ammit AJ, Haapasalo J, Haapasalo H, Guillemin GJ, Grewal T, Munoz L. The p38-MK2-HuR pathway potentiates EGFRvIII-IL-1β-driven IL-6 secretion in glioblastoma cells. Oncogene. 2015; 34: 2934–42.
68. Yamoutpour F, Bodempudi V, Park SE, Pan W, Mauzy MJ, Kratzke RA, Dudek A, Potter DA, Woo RA, O’Rourke DM, Tindall DJ, Farassati F. Gene silencing for epidermal growth factor receptor variant III induces cell-specific cytotoxicity. Mol Cancer Ther. 2008; 7: 3586–97.
69. Micallef J, Taccone M, Mukherjee J, Croul S, Busby J, Moran MF, Guha A. Epidermal growth factor receptor variant III-induced glioma invasion is mediated through myristoylated alanine-rich protein kinase C substrate overexpression. Cancer Res. 2009; 69: 7548–56.
70. Puram S V, Yeung CM, Jahani-Asl A, Lin C, de la Iglesia N, Konopka G, Jackson-Grusby L, Bonni A. STAT3-iNOS Signaling Mediates EGFRvIII-Induced Glial Proliferation and Transformation. J Neurosci. 2012; 32: 7806–18.
71. Schneider CA, Rasband WS, Eliceiri KW. NIH Image to ImageJ: 25 years of image analysis. Nat Methods. 2012; 9: 671–5.
72. Carpenter AE, Jones TR, Lamprecht MR, Clarke C, Kang IH, Friman O, Guertin DA, Chang JH, Lindquist RA, Moffat J, Golland P, Sabatini DM. CellProfiler: image analysis software for identifying and quantifying cell phenotypes. Genome Biol. 2006; 7: R100.
73. Pfaffl MW. A new mathematical model for relative quantification in real-time RT-PCR. Nucleic Acids Res. 2001; 29: e45.
74. Fridman R, Benton G, Aranoutova I, Kleinman HK, Bonfil RD. Increased initiation and growth of tumor cell lines, cancer stem cells and biopsy material in mice using basement membrane matrix protein (Cultrex or Matrigel) co-injection. Nat Protoc. 2012; 7: 1138–44.
75. Ayers GD, McKinley ET, Zhao P, Fritz JM, Metry RE, Deal BC, Adlerz KM, Coffey RJ, Manning HC. Volume of preclinical xenograft tumors is more accurately assessed by ultrasound imaging than manual caliper measurements. J Ultrasound Med. 2010; 29: 891–901.