
INTRODUCTION
Toll-like receptors (TLRs) are innate immune receptors with unique antigen-recognition domains. Toll-like receptor 4, for example recognizes lipopolysaccharide and TLRs 1, 2 and 6 form heterodimers to recognize different kinds of lipopeptides, which are components of bacterial cell wall [1]. Bacteria-recognizing TLRs are found, not only in immune cells, but also in epithelial cells and fibroblasts. Epithelial cells sense luminal pathogens via TLRs and activate immune cells and consequent inflammation [2].
Bacterial infection affects carcinogenesis by altering cytokine and chemokine expression. These stimulate inflammation, angiogenesis and metastasis [3]. The best characterized pathway is correlation between gastric cancer and Helicobacter pylori infection [4], where aberrant TLR expression is involved [5]. Esophageal microbiome shows characteristic features in Barrett’s esophagus and esophageal adenocarcinoma, but their actual pathogenetic significance is not known [6].
In esophageal epithelium, TLR9 expression increases during premalignant and malignant changes [7–9] and TLR9 activation stimulates invasion in esophageal adenocarcinoma cells [10]. Epithelial TLR5 expression increases along with development esophageal columnar dysplasia and is a marker of dysplasia [11]. No published information on TLRs 1, 2, 4 or 6 in esophageal dysplasia or adenocarcinoma could be found [12].
The aim of this study was to assess the expression of TLRs 1, 2, 4 or 6 in different stages of esophageal metaplasia-dysplasia-adenocarcinoma-sequence.
RESULTS
Expression of TLRs 1, 2, 4 and 6 in esophageal squamous epithelium, in Barrett’s esophagus, dysplasia and cancer
TLRs 1, 2, 4 and 6 were all expressed in normal and metaplastic esophagus. The expression of all of these TLRs was the lowest in normal esophageal squamous epithelium and increased towards to high-grade dysplasia. In cancer, the expression was the most variable. Expression of TLRs was mainly cytoplasmic. The percentage of cytoplasmic staining was 100% in nearly all lesions in all of the TLRs. Histoscores for the different TLRs summarised in Table 1.
Table 1: Baseline characteristics of TLR1, 2, 4 and 6 expression in normal esophageal squamous epithelium and in different esophageal lesions
TLR1 |
histoscore mean |
histoscore median |
histoscore IQR |
statistical significance |
nuclei mean |
median |
IQR |
statistical significance |
|---|---|---|---|---|---|---|---|---|
Normal epithelium |
106 |
100 |
10 |
|
57 |
53 |
65 |
bcdef |
Gastric metaplasia |
143 |
135 |
100 |
a |
16 |
5 |
28 |
def |
Intestinal metaplasia |
194 |
200 |
63 |
ab |
18 |
5 |
35 |
ef |
Low-grade dysplasia |
222 |
200 |
100 |
abcf |
10 |
0 |
15 |
f |
High-grade dysplasia |
243 |
250 |
100 |
abcf |
5.7 |
0 |
5 |
f |
Adenocarcinoma |
189 |
200 |
150 |
ab |
4.0 |
0 |
0 |
|
|
|
|
|
|
|
|
|
|
TLR2 |
|
|
|
|
|
|
|
|
Normal epithelium |
108 |
100 |
10 |
|
- |
|
|
|
Gastric metaplasia |
137 |
150 |
118 |
a |
- |
|
|
|
Intestinal metaplasia |
158 |
170 |
100 |
ab |
- |
|
|
|
Low-grade dysplasia |
185 |
200 |
74 |
ab |
- |
|
|
|
High-grade dysplasia |
241 |
200 |
200 |
abc |
- |
|
|
|
Adenocarcinoma |
202 |
200 |
100 |
abc |
- |
|
|
|
|
|
|
|
|
|
|
|
|
TLR4 |
|
|
|
|
|
|
|
|
Normal epithelium |
105 |
100 |
1 |
|
60 |
85 |
80 |
bcdef |
Gastric metaplasia |
160 |
150 |
100 |
a |
39 |
30 |
83 |
f |
Intestinal metaplasia |
244 |
250 |
100 |
ab |
43 |
38 |
85 |
f |
Low-grade dysplasia |
218 |
225 |
75 |
ab |
35 |
0 |
95 |
|
High-grade dysplasia |
247 |
250 |
100 |
ab |
31 |
0 |
85 |
|
Adenocarcinoma |
234 |
250 |
100 |
ab |
31 |
0 |
95 |
|
|
|
|
|
|
|
|
|
|
TLR6 |
|
|
|
|
|
|
|
|
Normal epithelium |
119 |
100 |
44 |
|
- |
|
|
|
Gastric metaplasia |
151 |
150 |
100 |
a |
- |
|
|
|
Intestinal metaplasia |
211 |
200 |
50 |
ab |
- |
|
|
|
Low-grade dysplasia |
242 |
250 |
100 |
abc |
- |
|
|
|
High-grade dysplasia |
245 |
300 |
100 |
abcf |
- |
|
|
|
Adenocarcinoma |
219 |
250 |
150 |
ab |
- |
|
|
|
Intensity was assessed with a four point scale from negative (0) to strong intensity (3). The extent of the staining was expressed as percentage of positive cells and positive cell nuclei (0–100%). Histoscore is counted by multiplying intensity with the percentage of positive cells (0–300) Values are presented as mean, median and interquartile range (IQR). Statistically significant differences are shown for histoscores and nuclear TLR expression. Letters are placed to indicate the lesion with higher TLR expression.
a compared to normal epithelium, p < 0.05.
b compared to gastric metaplasia, p < 0.05.
c compared to intestinal metaplasia, p < 0.05.
d compared to low-grade dysplasia, p < 0.05.
e compared to high-grade dysplasia, p < 0.05.
f compared to adenocarcinoma, p < 0.05.
Interestingly, TLR1 (14%; 14/99) and TLR4 (33%; 33/99) showed nuclear staining in esophageal adenocarcinoma. Freely available NucPred analysis was done to predict the probability of translocation of these proteins to the nucleus [13]. NucPred score (range 0–1.0) was 0.61 for TLR1 and 0.43 for TLR4, meaning that it is somewhat probable that these proteins translocate to nucleus. By using immunofluorescence analysis, we confirmed the nuclear localization of TLR4 as shown in Figure 1. We could not confirm nuclear localization for TLR1 (data not shown).
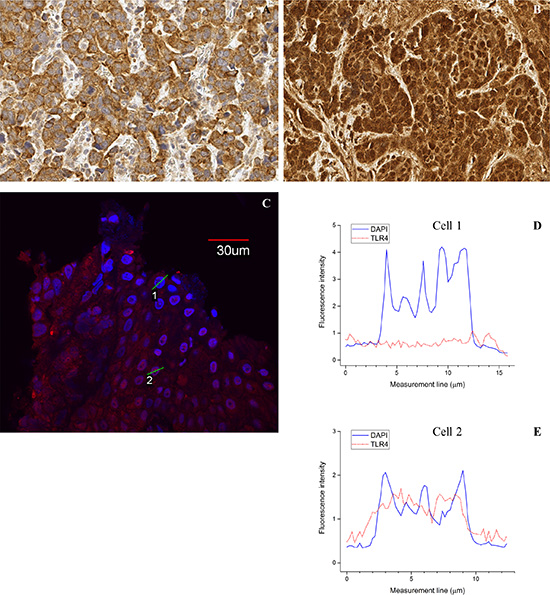
Figure 1: Examples of nuclear TLR4 expression. Immunohistochemical staining showing negative (A) and positive (B) nuclear TLR4 staining. Immunofluorescence confirming variable nuclear expression with examples of both TLR4 (red label) negative (cell 1) and positive (cell 2) nuclei in the same carcinoma sample (C). Nuclei are marked with DNA specific DAPI staining (blue). Corresponding intensity profiles of TLR (D, E) of carcinoma cells with TLR4 positive cytoplasm but negative nucleus (see figure C, Cell 1) and both positive cytoplasm and nucleus (see figure C, Cell 2). Solid line shows the intensity of DAPI and dotted line the intensity of TLR4. Magnification 40x (IHC) and 60x (IF) were used.
The TLR1 histoscore was increased in both types of metaplasia when compared to normal epithelium. The expression of TLR1 was the highest in high-grade dysplasia and similar in low-grade dysplasia and intestinal metaplasia. Nuclear expression of TLR1 became more infrequent during preneoplastic and neoplastic changes, when compared to normal epithelium. The expression of TLR2 was slightly, but significantly increased from normal epithelium towards adenocarcinoma. Toll-like receptor 4 expression was the lowest in normal epithelium and gastric metaplasia. The expression of TLR4 was similar between intestinal metaplasia, low- and high-grade dysplasia and adenocarcinoma. TLR6 had similar pattern of expression to other TLRs. TLR6 intensity increased from normal epithelium and gastric metaplasia towards intestinal metaplasia and high-grade dysplasia, which had clearly the highest TLR intensity.
Generally the expression of all examined TLRs increased from normal epithelium towards high-grade dysplasia. The most profound increase in the TLR staining was observed in transition from gastric metaplasia to intestinal-type metaplasia. The examples of immunohistochemical stainings with different TLRs are shown in Figure 2.
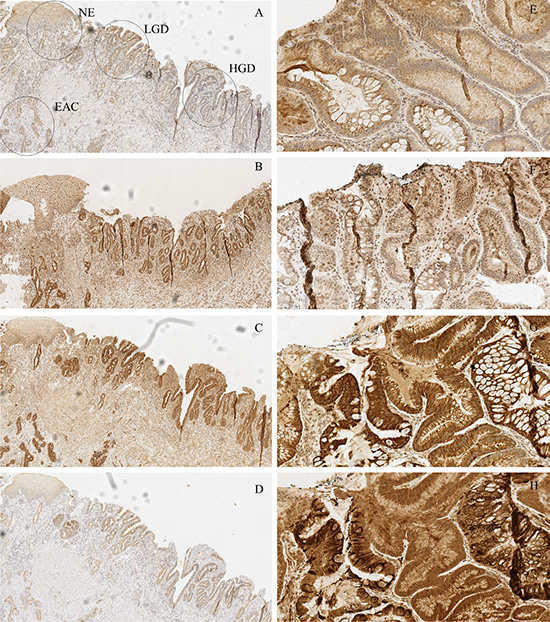
Figure 2: Examples of typical expression patterns of TLR1 (A, E), TLR2 (B, F), TLR4 (C, G) and TLR6 (D, H). (A–D) represent the same sample with normal epithelium (NE), low-grade dysplasia (LGD), high grade dysplasia (HGD) and esophageal adenocarcinoma (EAC) marked in the figure A. Gradual increase is found through normal epithelium – metaplasia – dysplasia sequence. E-H show intestinal type metaplasia (left) and gastric type metaplasia (right). Gastric metaplasia presented a strong polarized staining to the basal cytoplasm in TLR 1, 4 and 6 stainings. TLR1 and TLR2 show basal polarization in intestinal metaplasia, whereas TLR4 and TLR6 are expressed more diffusely. Expression pattern of all studied TLRs in adenocarcinoma is diffuse extending homogenously throughout the cell cytoplasm with no apparent basal polarization. Magnifications 6× and 20× were used.
Relation between TLRs, clinicopathological variables and cancer survival
Presence of nuclear expression of TLR1 correlated with distant metastases (P < 0.001). However, the nuclear TLR1 expression could not be confirmed. High TLR4 expression associated to high T-class (P < 0.01) and nuclear expression of TLR4 also correlated with distant metastases (P < 0.001). TLR4 histoscore and nuclear expression predicted survival in univariate (P < 0.05, Figure 3), but not in multivariate analysis (data not shown). Nuclear TLR1 expression showed survival trend (P = 0.075, Figure 3). TLR2 and 6 expression in cancer tissue was not associated to clinicopathological parameters or prognosis (data not shown). Table 2 summarizes the relation between clinicopathological variables, nuclear expressions and histoscores of TLR1 and 4.
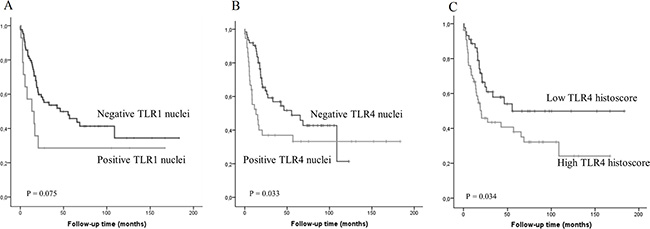
Figure 3: Kaplan-Meier curve showing esophageal adenocarcinoma survival stratified by nuclear TLR1 (A) or TLR4 (B) expression and TLR4 histoscore (C).
Table 2: TLR1 and 4 nuclear expressions and histoscores compared to clinicopathological variables in esophageal adenocarcinoma
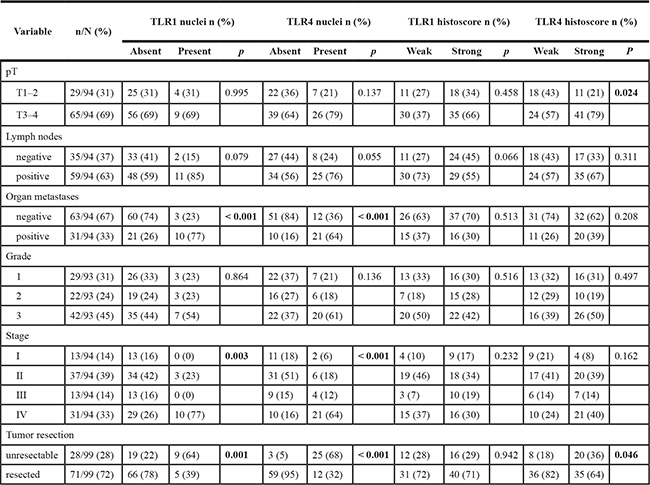
Significant p-values are shown in bold.
DISCUSSION
We demonstrate widespread expression of TLRs 1, 2, 4 and 6 in normal esophageal squamous epithelium, columnar metaplasia and dysplasia of Barrett’s esophagus, as well as esophageal adenocarcinoma. Expression of all of these TLR types showed general pattern of stepwise increase in metaplasia, dysplasia and adenocarcinoma. By American definition, Barrett’s esophagus is defined as columnar-lined esophagus, with intestinal-type goblet cells in the epithelium. Some studies have shown increased risk of cancer in intestinal metaplasia compared to gastric metaplasia [14]. The largest incremental increase in TLR expression was observed in between gastric-type and intestinal-type metaplasia, suggesting major inflammatory changes between these two epithelial types. Interestingly, TLR4 expression in the cytoplasm and the presence of nuclear TLR4 expression correlated to distant metastases and poor prognosis.
Based on our results, TLR1/2/6-network is upregulated in Barrett’s metaplasia, dysplasia, and cancer. Activation of these receptors induces inflammatory reactions via NF-kappaB [1]. In cancers, ligands of these TLRs have been shown to stimulate inflammatory cytokines, but also to induce tumor regression [15]. In agreement with present findings, earlier studies have reported TLRs 1, 2 and 6 to be expressed in normal esophagus. TLR2 is known to upregulate beta-defensin 2 upon activation in esophageal cells [16]. Upregulation of TLR1/2/6-network in Barrett’s metaplasia, dysplasia, and cancer could mark improved recognition of bacteria by precancerous metaplastic and dysplastic cells leading to inflammation, which is one of the hallmarks of cancer [3]. Upregulation in the TLR1/2/6 network could possibly increase the recognition of fungal organisms. Proton-pump inhibitor treatment increases the risk esophageal Candida colonization [17]. This might contribute to the proinflammatory cascade in Barrett’s esophagus. Expression levels of TLR1 and TLR6 showed decrease in carcinomas as compared with premalignant epithelium. Variation of expression was high in carcinomas suggesting that increased aberration of cellular regulatory mechanisms could be a reason leading to downregulation in some cases. Another potential mechanism is that invasive cells in carcinomas do not have contact with lumen and therefore are less in contact with luminal TLR ligands. This could modify the expression of TLRs.
Cytoplasmic TLR4 expression increased towards dysplasia and cancer. Previous studies have shown TLR4 expression in various cancer types. [18–23] TLR4 activation has been linked to increased invasion and nodal metastasis in breast cancer, as well as induction of tumor growth in ovarian cancer [20, 21]. TLR4 knockdown attenuates tumor growth in lung cancer [19]. Supporting role of TLR4 activation in pathogenesis of esophageal inflammation and carcinoma, TLR4 activation has been shown to induce Interleukin-8 and NF-kB in esophageal epithelial cells and, more pronouncedly so, in Barrett’s esophagus. TLR4 activation also increased cyclo-oxygenase 2 expression in Barrett’s esophagus [24]. These results suggest that TLR4 activation is involved in pathogenesis of esophageal adenocarcinoma, and that increased cyclo-oxygenase 2 activation is a mediator of this activation similar to gastric cancer [25].
Although proportion of epithelial cell nuclei with TLR1 and TLR4 expression decreased towards malignancy, the presence of nuclear staining for both TLR1 in (12%) and TLR4 (33%) was common in esophageal adenocarcinomas. Interestingly, for TLR4 the nuclear staining correlated to distant metastasis and poor prognosis.
The mechanism of nuclear translocation of TLR4 and the correlation with prognosis remain speculative. TLR4 contains several sequences indicating nuclear localization [13]. Alternatively, nuclear translocation might be related with carrier proteins, but no such proteins have been identified. By using transcription factor sequence identification analysis program (www.transcriptionfactor.org) we could not find potential transcription factor sequences in TLR4 [26]. However, we think that translocation of these membrane-bound TLRs to nucleus is due to increased amount of these proteins and related signaling activity. Low nuclear expression of TLR4 has been previously linked to development of laryngeal squamous cell carcinoma [27]. However, this finding was not confirmed by other techniques.
In conclusion, upregulation of bacterial and fungal component-sensing TLRs is present in esophageal metaplasia-dysplasia-adenocarcinoma sequence. TLR expression is greatly increased in transition from gastric metaplasia to intestinal metaplasia, suggesting changes in innate immune activation between these two conditions. High cytoplasmic expression of TLR4 and presence of nuclear expression of TLR4 associate with advanced stage and poor prognosis in esophageal adenocarcinoma
MATERIALS AND METHODS
Patients
Paraffin-embedded, archival specimens of esophageal adenocarcinoma or esophageal dysplasia were obtained from the Department of Pathology, Oulu University Hospital, between the years 1987–2013. The final series consisted of 99 patients with esophageal adenocarcinoma, 10 with high-grade dysplasia, and 20 with low-grade dysplasia as the most advanced lesion. The material has been earlier described elsewhere [11]. The median age of the cancer patients was 64 years (range 43–90). The median follow-up time was 36 months (range 0–288 months) for the surviving patients. The patient survival data was acquired from Statistics Finland, and the other relevant data was acquired from the patient records (Table 3). We could not retrieve full clinical data from 6 of the patients and survival data from 5 of the cancer patients.
Table 3: Baseline characteristics of the patients with esophageal adenocarcinoma (EAC), high-grade dysplasia (HGD) and low-grade dysplasia (LGD)
Patient clinical data |
EAC N = 99 |
|
HGD N = 10 |
|
|
LGD N = 20 |
|
|---|---|---|---|---|---|---|---|
Age at diagnosis |
n/N |
% |
n/N |
% |
|
n/N |
% |
< 60 yrs |
34/99 |
34 |
5/10 |
50 |
|
4/20 |
20 |
60–65 yrs |
21/99 |
21 |
3/10 |
30 |
|
3/20 |
15 |
> 65 yrs |
43/99 |
43 |
2/10 |
20 |
|
13/20 |
65 |
Sex |
|||||||
Male |
82/99 |
83 |
10/10 |
100 |
|
13/20 |
65 |
Female |
17/99 |
17 |
0/10 |
0 |
|
7/20 |
35 |
Tumor grade |
|||||||
1 |
29/92 |
32 |
|
|
|
|
|
2 |
22/92 |
24 |
|
|
|
|
|
3 |
41/92 |
45 |
|
|
|
|
|
T-classification |
|||||||
I |
13/93 |
14 |
|
|
|
|
|
II |
14/93 |
15 |
|
|
|
|
|
III |
51/93 |
55 |
|
|
|
|
|
IV |
15/93 |
16 |
|
|
|
|
|
Lymph nodes |
|||||||
Negative |
35/93 |
62 |
|
|
|
|
|
Positive |
58/93 |
38 |
|
|
|
|
|
Distal metastases |
|||||||
Negative |
63/93 |
68 |
|
|
|
|
|
Positive |
30/93 |
32 |
|
|
|
|
|
Tumor stage |
|||||||
I |
13/93 |
14 |
|
|
|
|
|
II |
37/93 |
40 |
|
|
|
|
|
III |
13/93 |
14 |
|
|
|
|
|
IV |
30/93 |
32 |
|
|
|
|
|
Total of 99 patients with EAC, 10 patients with HGD and 20 with LGD are presented in the Table. Full clinical data could not be obtained from 7 patients.
The use of patient samples and the data inquiry were approved by the Oulu University Hospital Ethics Committee. The need to obtain a written or oral consent from the patients for using the samples in research was waived by the Finnish National Authority for Medicolegal Affairs (VALVIRA, Dnro 10832/06.01.03.01/2014).
Immunohistochemistry
Immunohistochemistry was performed on the tissue block sections, which were first selected by expert gastrointestinal pathologist, on the basis of hematoxylin and eosin-staining, to be representative for the tumor mass in the resected specimen. TLR immunostaining was performed with a commercial monoclonal antibody (IMG-5012, rabbit IgG1, Clone N/A for TLR1, MAB0066, mouse IgG1, lot number 0062201B-09 for TLR2, H00007099-M02, mouse IgG2a kappa, lot number 11277-3B6 for TLR4 and PAB3555, polyclonal rabbit IgG1, lot number SH030317H for TLR6 Imgenex, San Diego, CA and Abnova Corporation) at dilutions of 1:75 (TLR1), 1:75 (TLR2), 1:1000 (TLR4) and 1:750 (TLR6). For immunohistochemical detection of the antibody reaction, we used the Dako Envision kit (Dako, Copenhagen, Denmark) with a high temperature antigen retrieval in Tris-EDTA (for Ki67, TLR9) buffer for 15 minutes. Diaminiobenzidine (Dako basic DAB-kit) was used as a chromogen. All staining was done with Dako Autostainer (Dako, Copenhagen, Denmark).
We validated the immunohistochemical analysis through positive and two series of negative controls (omitting the primary antibody and by replacing primary antibody with the mouse primary antibody isotype control). Lymphocytes of the lymph nodes in the sample material were used as an internal positive control for TLR staining. To assess the effect of paraffin block age on the preservation of the studied antigens we compared the TLR staining intensities in normal esophageal epithelium between old and new blocks (grouped by the median age of the blocks). No significant differences were found indicating that age of tissue blocks does not significantly affect staining intensity
Immunofluorescence
Formalin-fixed and paraffin-embedded esophageal sections were deparaffinized followed by treatment with citrate buffer in pH 6. Nonspecific staining was blocked by treatment with 1% bovine serum albumin for 20 min and 150 ul of normal gout serum. Incubation with primary antibodies for 60 min (TLR4) and overnight (TLR1) at room temperature was then performed. The primary antibodies used are described in the immunohistochemistry section. After several washes, Alexa Fluor 568 or Alexa Fluor 594 conjugated to goat anti-rabbitt (TLR1) and goat anti-mouse IgG (TLR4) (Life Technologies) was applied at appropriate dilutions and incubated for 30 min at room temperature. DNA specific DAPI staining was applied. Samples were mounted with H-1200 (Vector, Gdynia, Poland) and examined by using a Olympus FluoView FV1000 confocal microscope (Olympus corp, Tokyo, Japan). Used objective was 60x/1.35. Excitation and detection wavelengths for DAPI were 405 nm and 430– 470 nm, and 568 nm (TLR4) with long pass 560 nm for Alexa fluor 568 and 594.
Assessment of TLR expression
The histological sample slides were digitized using Aperio AT2 Console, Leica Biosystems Imaging Inc, Nussloch, Germany, Different lesions in the specimens were identified and marked by an expert gastrointestinal pathologist (T.J.K.). TLR immunoreactivity was analyzed by two independent researchers who were blinded from the clinical data, using method described earlier [11]. We assessed the intensity of staining (0–3) and the percentage of staining (0–100) in different lesions. Mean values of two independent estimates were used if there was no difference over 1 in the intensity or over 30% in the percentage. If the difference was more extensive, consensus was reached after re-evaluation with a third researcher. Re-evaluation was however not needed in any of the samples, indicating a good reproducibility. Mean intensity and mean percentage was then multiplied together to obtain a histoscore (0–300). Histoscore was dichotomized into equally sized groups by the median value of each TLR histoscore. Percentage of cells showing membranous and nuclear staining was also assessed. After the analysis, the samples were dichotomized by nuclear staining, the staining being either “0 = absent” or “1 = present”.
Intensity profiles of TLR4 and DAPI were acquired from immunofluorescence sample by analyzing the detectable fluorescence with 0.2 μm interval horizontally through the selected cells. Olympus FluoView FV1000 software was used in the analysis.
Statistical analysis
We used IBM SPSS Statistics 22.0 (IBM corp., Armonk, NY) for statistical analyses. To compare TLRs expression between different lesions we used Kruskall-Wallis due to skewed distributions. The chi-square-test was used to calculate statistically significant differences between prognostic and clinicopathologic variables. Life tables were calculated according to the Kaplan-Meier method, and the survival curves were compared using the log-rank test. Cox proportional hazards model with backward selection was used for multivariate analysis with following covariates: Age, gender, T-stage, N-stage, M-stage and grade of differentiation.
ACKNOWLEDGMENTS
We thank Erja Tomperi and Riitta Vuento for their excellent technical assistance, as well as statistician Pasi Ohtonen for his help with statistical problems.
GRANT SUPPORT
This work was supported by grants from the Orion Research Foundation (J.H.K.), Thelma Mäkikyrö Foundation (J.H.K.) Päivikki and Sakari Sohlberg Foundation (H.H.), the Emil Aaltonen Foundation (H.H), Georg C. and Mary Ehrnroot Foundation (H.H.), and the Finnish Medical Foundation (H.H.).
CONFLICTS OF INTEREST
The authors state no potential conflicts of interest.
REFERENCES
1. Takeda K, Kaisho T, Akira S. Toll-like receptors. Annu Rev Immunol. 2003; 21:335–376.
2. Wells JM, Rossi O, Meijerink M, van Baarlen P. Epithelial crosstalk at the microbiota-mucosal interface. Proc Natl Acad Sci U S A. 2011; 108:4607–4614.
3. Hanahan D, Weinberg RA. Hallmarks of cancer: the next generation. Cell. 2011; 144:646–674.
4. Suerbaum S, Michetti P. Helicobacter pylori infection. N Engl J Med. 2002; 347:1175–1186.
5. Castano-Rodriguez N, Kaakoush NO, Mitchell HM. Pattern-recognition receptors and gastric cancer. Front Immunol. 2014; 5:336.
6. Baghdadi J, Chaudhary N, Pei Z, Yang L. Microbiome, innate immunity, and esophageal adenocarcinoma. Clin Lab Med. 2014; 34:721–732.
7. Takala H, Kauppila JH, Soini Y, Selander KS, Vuopala KS, Lehenkari PP, Saarnio J, Karttunen TJ. Toll-like receptor 9 is a novel biomarker for esophageal squamous cell dysplasia and squamous cell carcinoma progression. J Innate Immun. 2011; 3:631–638.
8. Sheyhidin I, Nabi G, Hasim A, Zhang RP, Ainiwaer J, Ma H, Wang H. Overexpression of TLR3, TLR4, TLR7 and TLR9 in esophageal squamous cell carcinoma. World J Gastroenterol. 2011; 17:3745–3751.
9. Huhta H, Helminen O, Kauppila JH, Takala H, Metsikko K, Lehenkari P, Saarnio J, Karttunen T. Toll-like receptor 9 expression in the natural history of Barrett mucosa. Virchows Arch. 2015; 467:9–18.
10. Kauppila JH, Karttunen TJ, Saarnio J, Nyberg P, Salo T, Graves DE, Lehenkari PP, Selander KS. Short DNA sequences and bacterial DNA induce esophageal, gastric, and colorectal cancer cell invasion. APMIS. 2013; 121:511–522.
11. Helminen O, Huhta H, Takala H, Lehenkari PP, Saarnio J, Kauppila JH. Karttunen TJ. Increased Toll-like receptor 5 expression indicates esophageal columnar dysplasia. Virchows Arch. 2014; 464:11–18.
12. Kauppila JH, Selander KS. Toll-like receptors in esophageal cancer. Front Immunol. 2014; 5:200.
13. Brameier M, Krings A, MacCallum RM. NucPred—predicting nuclear localization of proteins. Bioinformatics. 2007; 23:1159–1160.
14. Booth CL, Thompson KS. Barrett’s esophagus: A review of diagnostic criteria, clinical surveillance practices and new developments. J Gastrointest Oncol. 2012; 3:232–242.
15. Zhang Y, Luo F, Cai Y, Liu N, Wang L, Xu D, Chu Y. TLR1/TLR2 agonist induces tumor regression by reciprocal modulation of effector and regulatory T cells. J Immunol. 2011; 186:1963–1969.
16. Lim DM, Narasimhan S, Michaylira CZ, Wang ML. TLR3-mediated NF-{kappa}B signaling in human esophageal epithelial cells. Am J Physiol Gastrointest Liver Physiol. 2009; 297:G1172–1180.
17. Daniell HW. Acid suppressing therapy as a risk factor for Candida esophagitis. Dis Esophagus. 2015. Apr 1. doi: 10.1111/dote.12354. [Epub ahead of print].
18. Jouhi L, Datta N, Renkonen S, Atula T, Makitie A, Haglund C, Ahmed A, Syrjanen S, Grenman R, Auvinen E, Lehtonen S, Hagstrom J. Expression of toll-like receptors in HPV-positive and HPV-negative oropharyngeal squamous cell carcinoma—an in vivo and in vitro study. Tumour Biol. 2015; 36:7755–7764.
19. Li D, Jin Y, Sun Y, Lei J, Liu C. Knockdown of toll-like receptor 4 inhibits human NSCLC cancer cell growth and inflammatory cytokine secretion in vitro and in vivo. Int J Oncol. 2014; 45:813–821.
20. Yang H, Wang B, Wang T, Xu L, He C, Wen H, Yan J, Su H, Zhu X. Toll-like receptor 4 prompts human breast cancer cells invasiveness via lipopolysaccharide stimulation and is overexpressed in patients with lymph node metastasis. PLoS One. 2014; 9:e109980.
21. Wang AC, Ma YB, Wu FX, Ma ZF, Liu NF, Gao R, Gao YS, Sheng XG. TLR4 induces tumor growth and inhibits paclitaxel activity in MyD88-positive human ovarian carcinoma. Oncol Lett. 2014; 7:871–877.
22. Wang Y, Cai J, Zeng X, Chen Y, Yan W, Ouyang Y, Xiao D, Zeng Z, Huang L, Liu A. Downregulation of toll-like receptor 4 induces suppressive effects on hepatitis B virus-related hepatocellular carcinoma via ERK1/2 signaling. BMC Cancer. 2015; 15:821.
23. Weng H, Deng Y, Xie Y, Liu H, Gong F. Expression and significance of HMGB1, TLR4 and NF-kappaB p65 in human epidermal tumors. BMC Cancer. 2013; 13:311.
24. Verbeek RE, Siersema PD, Ten Kate FJ, Fluiter K, Souza RF, Vleggaar FP, Bus P, van Baal JW. Toll-like receptor 4 activation in Barrett’s esophagus results in a strong increase in COX-2 expression. J Gastroenterol. 2014; 49:1121–1134.
25. Thiel A, Mrena J, Ristimaki A. Cyclooxygenase-2 and gastric cancer. Cancer Metastasis Rev. 2011; 30:387–395.
26. Wilson D, Charoensawan V, Kummerfeld SK, Teichmann SA. DBD—taxonomically broad transcription factor predictions: new content and functionality. Nucleic Acids Res. 2008; 36:D88–92.
27. Ilmarinen T, Hagstrom J, Haglund C, Auvinen E, Leivo I, Pitkaranta A, Aaltonen LM. Low expression of nuclear Toll-like receptor 4 in laryngeal papillomas transforming into squamous cell carcinoma. Otolaryngol Head Neck Surg. 2014; 151:785–790.