
INTRODUCTION
Worldwide, there are an estimated 84,400 new cases of nasopharyngeal carcinoma (NPC) and 51,600 NPC-related deaths in 2011 [1]. NPC has an obviously skewed geographical distribution, with an age-standardized incidence rate of 20–50 per 100 000 males in South China and a rate of 0.5 per 100 000 males in Caucasian populations [1]. Due to the anatomic constraints and its high degree of radiosensitivity, radiotherapy is the primary and only curative treatment for NPC. Despite its known limitations, TNM staging remains the most important prognostic factor in NPC currently [2]. Many new prognostic factors have also been reported, including plasma Epstein-Barr virus (EBV) DNA [3-5], primary tumor volume [6, 7], pre-treatment serum lactate dehydrogenase [8] and presence of comorbidities [9].
Since it was first reported by Lin et al. [3], the prognostic value of plasma EBV DNA has been widely investigated during the last decade. Recently, plasma EBV DNA has been used in the clinical setting [4, 10, 11] and has been established as a reliable biomarker for detection, monitoring and prognostic prediction in NPC patients [5, 12]. However, these previous studies were focusing on the prognostic value of pre-treatment plasma EBV DNA level in NPC patients with stage I–IV cancer, and no study has investigated the prognostic impact of pre-treatment EBV status in advanced stage NPC.
A recent review by Chua et al. showed that patients with non-viral-associated NPC had different pathogenesis and outcomes compared with patients with viral-associated tumors [13]. Moreover, patients with different EBV status may get different treatment strategies based on plasma EBV DNA level since the tumor burden could be represented by the plasma EBV DNA level [14]. Therefore, the prognostic difference between EBV-negative and EBV-positive patients is worth investigating.
On the basis of this premise, we conducted this retrospective study to evaluate the impact of tumor EBV status on survival outcomes in advanced-stage NPC patients in the era of intensity-modulated radiation therapy (IMRT).
RESULTS
Patient characteristics
Of the whole cohort, 248 (22.4%) patients with undetectable plasma pre-treatment EBV DNA were classified as the EBV-negative group, and the remaining were classified as the EBV-positive group. The male (841)-to-female (265) ratio was 3.2:1, and the median age was 45 years (range, 14–78 years). EBV-negative and EBV-positive patients were similar in terms of the majority of the host factors and histological categories. Additionally, the number of patients receiving pre-treatment PET-CT test in EBV-negative group was similar to that in EBV-positive group. However, a higher number of patients in the EBV-positive group than in the EBV-negative group had tumors classified as T4 (P < 0.001), N2-3 (P < 0.001) and stage IV (P < 0.001). Moreover, a higher percentage of Patients in the EBV-negative group than in EBV-positive group received IMRT alone (P < 0.001) (Table 1).
Table 1: Baseline Characteristics of the 1106 patients with Advanced-Stage NPC
Characteristics |
EBV - |
EBV + |
Pa |
|---|---|---|---|
No. (%) |
No. (%) |
||
Gender |
0.439 |
||
Male |
184 (74.2) |
657 (76.6) |
|
Female |
64 (25.8) |
201 (23.4) |
|
Age (years) |
0.142 |
||
≥50 |
74 (29.8) |
299 (34.8) |
|
<50 |
174 (70.2) |
559 (65.2) |
|
WHO pathological classification |
0.696 |
||
Type I |
2 (0.8) |
5 (0.6) |
|
Type II/III |
246 (99.2) |
853 (99.4) |
|
Family history |
0.89 |
||
Yes |
67 (27.0) |
228 (26.6) |
|
No |
181 (73.0) |
630 (73.4) |
|
Smoking |
0.288 |
||
Yes |
91 (36.7) |
347 (40.4) |
|
No |
157 (63.3) |
511 (59.6) |
|
Drinking |
0.774 |
||
Yes |
35 (14.1) |
115 (13.4) |
|
No |
213 (85.9) |
743 (86.6) |
|
PET-CT |
0.385 |
||
Yes |
72 (29.0) |
274 (31.9) |
|
No |
176 (71.0) |
584 (68.1) |
|
T classificationb |
<0.001 |
||
T1 |
13 (5.2) |
37 (4.3) |
|
T2 |
7 (2.8) |
53 (6.2) |
|
T3 |
193 (77.8) |
523 (61.0) |
|
T4 |
35 (14.2) |
245 (28.5) |
|
N classificationb |
<0.001 |
||
N0 |
68 (27.4) |
53 (6.2) |
|
N1 |
137 (55.3) |
474 (55.2) |
|
N2 |
34 (13.7) |
203 (23.7) |
|
N3 |
9 (3.6) |
128 (14.9) |
|
Overall stageb |
<0.001 |
||
III |
205 (82.7) |
509 (59.3) |
|
ⅣA-IVB |
43 (17.3) |
349 (40.7) |
|
Treatment regimen |
<0.001 |
||
IMRT |
32 (12.9) |
36 (4.2) |
|
IMRT + NCT/ACT |
20 (8.1) |
105 (12.2) |
|
CCRT +/- NCT/ACT |
196 (79.0) |
717 (83.6) |
Abbreviations: -, negative; +, positive; EBV = Epstein-Barr virus; WHO = World Health Organization; PET = positron emission tomography; NPC = nasopharyngeal carcinoma; IMRT = intensity-modulated radiotherapy; NCT = neoadjuvant chemotherapy; ACT = adjuvant chemotherapy; CCRT = concurrent chemoradiotherapy.
aP values were calculated using the chi-square test or Fisher exact test if indicated.
bAccording to the 7th edition of the AJCC/UICC staging system.
Failure patterns and treatment outcomes
The outcomes of treatment failure are summarized in Table 2. The median follow-up time for this entire cohort was 49.8 months (range, 1.3–70.7 months), and 198 (17.9%) patients were lost to follow-up. By the last follow-up, 11 (4.4%) patients in the EBV-negative group and 53 (6.2%) patients in the EBV-positive group developed local failure, 7 (2.8%) patients in the EBV-negative group and 40 (4.7%) patients in the EBV-positive group suffered regional failure, and 9 (3.6%) patients in the EBV-negative group and 129 (15.0%) patients in the EBV-positive group had distant failure. There was no significant difference between the two groups with regard to locoregional failure (P = 0.143). However, the percentage of distant metastasis events was significantly higher in the EBV-positive group (15.0% vs. 3.6%, P < 0.001) than that in the EBV-negative group. Moreover, there were 16 (6.5%) deaths in EBV-negative group and 125 (14.6%) deaths in EBV-positive group; the EBV-positive group had a higher percentage of cancer-related deaths (P = 0.005).
Table 2: Failure Patterns in EBV-negative and EBV-positive Patients with NPC
Failure patterns |
EBV -(%) |
EBV + (%) |
Pa |
|---|---|---|---|
Local only |
8 (3.2) |
33 (3.8) |
0.417 |
Local + regional |
2 (0.8) |
6 (0.7) |
1.000 |
Local + distant |
1 (0.4) |
8 (0.9) |
0.662 |
Local + regional + distant |
0 (0) |
6 (0.7) |
0.407 |
Regional only |
4 (1.6) |
19 (2.2) |
0.398 |
Regional + distant |
1 (0.4) |
9 (1.0) |
0.557 |
Distant only |
7 (2.8) |
106 (12.4) |
<0.001 |
Total locoregional |
16 (6.5) |
81 (9.4) |
0.143 |
Total distant |
9 (3.6) |
129 (15.0) |
<0.001 |
Total |
23 (9.3) |
187 (21.8) |
<0.001 |
Cause of death |
0.005 |
||
Cancer |
10 (62.5) |
111 (88.8) |
|
Non-cancer |
6 (37.5) |
14 (11.2) |
|
Total |
16 |
125 |
Abbreviations: -, negative; +, positive; EBV = Epstein-Barr virus; NPC = nasopharyngeal carcinoma.
aP values were calculated using the chi-square test or Fisher exact test if indicated.
Univariate analysis
For the entire cohort, the estimated 4-year disease-free survival (DFS), overall survival (OS), distant metastasis-survival (DMFS) and locoregional relapse-free survival (LRRFS) were 79.6%, 87.6%, 87.4% and 90.9%, respectively. The estimated 4-year DFS, OS, DMFS and LRRFS rates for EBV-negative group vs. EBV-positive group were 88.9% vs. 76.9% (P < 0.001), 93.6% vs. 85.9% (P = 0.001), 96.7% vs. 84.8% (P < 0.001) and 94.1% vs. 90.0% (P = 0.1) (Figure 1), respectively.
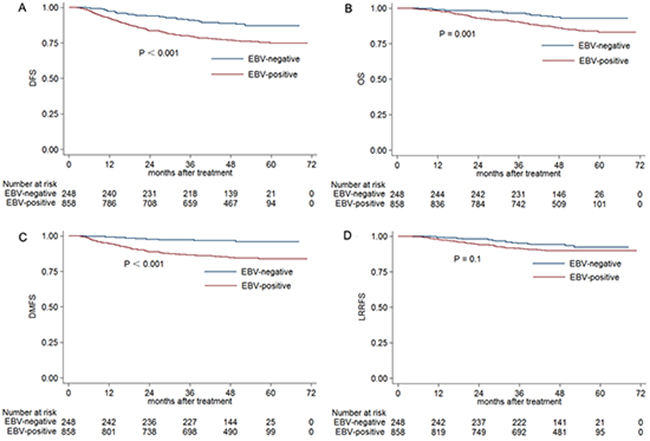
Figure 1: Kaplan-Meier DFS. A. OS B. DMFS C. and LRRFS D. curves for NPC patients with stage III–IVB disease classified as EBV-negative and EBV-positive groups. Abbreviations: DFS = disease-free survival; OS = overall survival; DMFS = distant metastasis-free survival; LRRFS = local-regional relapse-free survival.
Multivariate analysis
Multivariate analysis was performed to adjust for various prognostic factors. The findings from multivariate analysis are listed in Table 3. EBV status was found to be an independent prognostic factor for poor DFS (HR, 1.813; 95% CI, 1.219–2.695; P = 0.003), OS (HR, 1.828; 95% CI, 1.075–3.107; P = 0.026), and DMFS (HR, 3.678; 95% CI, 1.859–7.277; P < 0.01). However, EBV-positive patients with NPC had the similar risk for locoregional failure as EBV-negative patients (HR, 1.452; 95% CI, 0.838–2.516; P = 0.184). Of note, overall stage had better prognostic value in DFS and OS compared with EBV status (Table 3).
Table 3: Multivariate Analysis of Patients with Stage III–IV NPC
Endpoint |
Variable |
Pa |
HR |
95% CI for HR |
|---|---|---|---|---|
DFS |
EBV status |
0.003 |
1.813 |
1.219–2.695 |
Age |
0.011 |
1.409 |
1.083–1.832 |
|
Overall stage |
< 0.001 |
1.850 |
1.421-2.410 |
|
OS |
EBV status |
0.026 |
1.828 |
1.075–3.107 |
Age |
<0.001 |
1.881 |
1.349–2.623 |
|
Pathology |
0.049 |
0.315 |
0.1–0.997 |
|
Overall stage |
<0.001 |
2.273 |
1.613-3.203 |
|
DMFS |
EBV status |
<0.001 |
3.678 |
1.859–7.277 |
Overall stage |
<0.001 |
2.022 |
1.441–2.836 |
|
LRRFS |
Pathology |
0.002 |
0.165 |
0.052–0.521 |
Overall stage |
0.02 |
1.610 |
1.078-2.403 |
Abbreviations: EBV = Epstein-Barr virus; NPC = nasopharyngeal carcinoma; DFS = disease-free survival; OS = overall survival; DMFS = distant metastases-free survival; LRRFS = loco-regional relapse-free survival; HR = hazard ratio; CI = confidence interval.
aP values were calculated using an adjusted Cox proportional hazards model.
The following variables were included in the Cox proportional hazards model with backward elimination: gender (male vs. female), age (≥50 y vs. <50 y), pathology (type I vs. type II/III), family history (yes vs. no), smoking (yes vs. no), drinking (yes vs. no), overall stage (III vs. IV), treatment regimen (IMRT vs. IMRT + NCT/ACT vs. CCRT +/- NCT/ACT), EBV status (negative vs. positive).
Subgroup analysis according to the clinical stage
To further investigate the prognostic value of the EBV status for different clinical tumor stages, subgroup analysis was conducted according to the T, N and overall stage (Table 4). The results of the subgroup analysis showed that the prognostic differences between the EBV-negative and EBV-positive groups were prominent in patients with stage T3, N1 and III cancer. Multivariate analysis showed that the EBV status was an independent prognostic factor for DMFS (HR, 2.933; 95% CI, 1.251–6.877; P = 0.013) in the stage T3 subgroup; for DFS (HR, 1.696; 95% CI, 1.006–2.859; P = 0.047), OS (HR, 2.266; 95% CI, 1.027–4.999; P = 0.043) and DMFS (HR, 4.980; 95% CI, 1.554–15.955; P = 0.007) in the stage N1 subgroup; for DFS (HR, 1.849; 95% CI, 1.151–2.972; P = 0.011), OS (HR, 2.798; 95% CI, 1.314–5.954; P = 0.008) and DMFS (HR, 3.984; 95% CI, 1.718–9.239; P = 0.001) in the stage III subgroup.
Table 4: Subgroup Analysis of the EBV-negative and EBV-positive Groups According to the Clinical Stage
4-year DFS |
4-year OS |
4-year DMFS |
4-year LRRFS |
|||||||||
|---|---|---|---|---|---|---|---|---|---|---|---|---|
Stage |
EBV – |
EBV + |
Pa |
EBV - |
EBV + |
Pa |
EBV - |
EBV + |
Pa |
EBV - |
EBV + |
Pa |
(%) |
(%) |
(%) |
(%) |
(%) |
(%) |
(%) |
(%) |
|||||
T |
||||||||||||
T1 |
84.6 |
64.3 |
0.211 |
92.3 |
82.7 |
0.466 |
100 |
74.1 |
0.063 |
91.7 |
90.9 |
0.952 |
T2 |
85.7 |
75.1 |
0.616 |
83.3 |
82.6 |
0.882 |
85.7 |
84.4 |
0.994 |
100 |
89.7 |
0.409 |
T3 |
90.5 |
81.0 |
0.004 |
96.2 |
89.2 |
0.005 |
97.3 |
87.6 |
0.001 |
94.1 |
92.3 |
0.67 |
T4 |
82.4 |
70.5 |
0.121 |
81.2 |
80.2 |
0.575 |
94.2 |
80.4 |
0.061 |
94.2 |
85.0 |
0.165 |
N |
||||||||||||
N0 |
92.6 |
84.7 |
0.159 |
93.3 |
90.3 |
0.437 |
97.1 |
92.4 |
0.241 |
95.6 |
92.0 |
0.415 |
N1 |
88.0 |
81.2 |
0.065 |
94.7 |
89.1 |
0.03 |
97.8 |
88.8 |
0.002 |
92.4 |
90.9 |
0.714 |
N2 |
87.7 |
72.5 |
0.102 |
90.9 |
83.3 |
0.269 |
93.6 |
81.2 |
0.148 |
96.7 |
87.1 |
0.274 |
N3 |
76.2 |
64.7 |
0.539 |
88.9 |
76.6 |
0.895 |
85.7 |
72.1 |
0.39 |
100 |
90.1 |
0.382 |
Overall |
||||||||||||
III |
90.5 |
82.1 |
0.009 |
96.0 |
89.9 |
0.007 |
97.5 |
88.9 |
<0.001 |
94.0 |
91.9 |
0.602 |
IV |
80.8 |
69.3 |
0.113 |
82.2 |
80.1 |
0.692 |
92.7 |
78.6 |
0.044 |
95.1 |
87.0 |
0.151 |
Abbreviations: EBV = Epstein-Barr virus; DFS = disease-free survival; OS = overall survival; DMFS = distant metastases-free survival; LRRFS = loco-regional relapse-free survival. -, negative; +, positive.
aP values were calculated using the unadjusted log-rank test.
DISCUSSION
To the best of our knowledge, this current study is the first large-scale study to report the impact of EBV status on the prognosis of patients with stage III–IVB NPC in a population with a high prevalence of EBV infection and NPC. Distant metastasis had been the main treatment failure pattern for EBV-positive patients. The results of univariate analysis may be less meaning because of the unbalanced distribution of tumor stage and treatment intensity. However, the outcomes of multivariate analysis showed that patients with positive EBV have an obviously poorer prognosis than EBV-negative patients, and overall stage still remained the most important prognostic factor. Moreover, subgroup analysis revealed that this difference was mainly observed in patients with T3, N1 disease and overall stage III.
Previous study had discussed the different pathogenesis in EBV-negative and EBV-positive NPC [13]. EBV-associated NPC follows a stepwise malignant transformation consists of latent EBV infection, evasion of host immune surveillance, loss of heterogeneity at specific chromosomal regions, genetic mutations and activation of oncogenic signaling pathways, and epigenetic silencing of tumor suppressor genes [15, 16]. However, human papilloma virus (HPV) has been considered as a contributing factor in EBV-negative NPC in non-endemic regions [17-21] and is correlated to poor prognosis [21]. However, patients with negative EBV in our study had obviously better prognosis than EBV-positive patients, which was inconsistent with the results of the study by Stenmark et al. [21]. This indicated that EBV-negative patients in the endemic region did not have HPV infection.
Of note, a higher percentage of patients in the EBV-positive group had advanced-stage NPC than patients in the EBV-negative group; which indicating that EBV-positive patients had a greater tumor burden than EBV-negative patients. Therefore, different treatment strategies should be performed for EBV-negative and EBV-positive patients before, during and after treatment. In pre-treatment phase, thorough evaluation including PET-CT examination should be performed for EBV-positive patients to enhance the accuracy of tumor stage since patients with positive EBV had a higher percentage of advanced-stage NPC compared with EBV-negative patients. The outcomes of this current study revealed that distant metastasis was the main failure pattern for EBV-positive patients. Therefore, in treatment phase, neoadjuvant chemotherapy (NCT) plus concurrent chemoradiotherapy (CCRT) may be better treatment regimen for EBV-positive patients, and CCRT may be enough for EBV-negative patients since distant failure was not the main failure pattern. Previous studies reported that recurrence or distant metastases could be detected in time based on the post-treatment plasma EBV DNA level [22, 23]. In the follow-up phase, clinicians should therefore gain more insight into the follow-up of EBV-negative patients since the disease recurrence could not be detected based on post-treatment plasma EBV DNA level. Moreover, post-treatment EBV DNA should be frequently detected since distant metastasis is the main treatment failure for EBV-positive patients.
In the subgroup analysis, the difference in prognosis was mainly noted in the subgroups T3, N1 and III. For patients with stage T4 or N2-3 NPC, the tumor burden and risk of distant metastases were high in both the EBV-negative and EBV-positive groups. Therefore, the poor prognosis in patients with advanced stage NPC may dilute the prognostic impact of EBV. For patients with T1-2 and N0 disease, the tumor burden was small, and EBV-positive patients had a very low plasma EBV DNA level [5, 23, 24]. Hence, the prognostic impact of EBV may be not obvious. Hence, in clinical practice, patients with stage T3, N1 and III stage and positive plasma EBV DNA may need more intensive chemotherapy regimens like NCT + CCRT. However, CCRT alone may be enough for patients with negative plasma EBV DNA and stage T3, N1 and III disease.
The current study revealed that patients who are negative for EBV have a better prognosis than those who are positive for EBV. However, two main limitations may exist in this current study. First, our study was a retrospective one for which the follow-up time was insufficient, so DFS was chosen as the major endpoint to address this shortcoming. Moreover, the judgement of EBV status was only based on plasma EBV DNA level and more accurate diagnosed criteria should be used in future studies. Future prospective clinical studies should be warranted to confirm the results of this current study.
MATERIALS AND METHODS
Patient selection
We retrospectively analysed 1811 patients with previously untreated, biopsy-proven NPC with no evidence of distant metastasis, who were treated between November 2009 and February 2012 at Sun Yat-sen University Cancer Center. Patients with advanced-stage NPC (III–IVB) and pre-treatment plasma EBV DNA data were recruited, so only 1106 patients were analysed further. This study was conducted in compliance with the institutional policy regarding the protection of patients’ private information and was approved by the Research Ethics Committee of Sun Yat-sen University Cancer Center. Informed consent was obtained from all the patients.
Clinical staging
The routine staging workup included a complete history and clinical examinations of the head and neck region, direct fibre-optic nasopharyngoscopy, magnetic resonance imaging (MRI) of the skull base and whole neck, chest radiography, whole-body bone scan and abdominal sonography, as well as positron emission tomography (PET)-CT if clinical indicated. Tumour-related plasma EBV DNA load was tested. All patients underwent a dental evaluation before radiotherapy.
All patients were restaged according to the 7th edition of the International Union against Cancer/American Joint Committee on Cancer (UICC/AJCC) system [25]. All MRI materials and clinical records were reviewed to minimize heterogeneity in the restaging. Two radiologists (L.Z.L. and L.T.) employed at our hospital separately evaluated all the scans, and disagreements were resolved by consensus.
DNA extraction and real-time quantitative PCR
Before treatment, peripheral blood (3 ml) was collected from each patient, placed in an ethylene diamine tetra acetic-coated tube, and centrifuged at 1600 g for 15 min to isolate plasma and peripheral blood cells (PBCs). The plasma samples were stored at −80°C until further processing. DNA was extracted from plasma using the QIAamp Blood Kit (Qiagen, Hilden, Germany) and the blood and body fluid protocol recommended by the manufacturer. A total of 500 μl of each plasma sample was used for DNA extraction per column, and the final elution volume was 50 μl per column.
The concentration of EBV DNA in the plasma was measured using a real-time quantitative PCR assay targeting the BamH I-W region of the EBV genome. The sequences of the forward and reverse primers were 5′-GCCAG AGGTA AGTGG ACTTT-3′ and 5′-TACCA CCTCC TCTTC TTGCT-3′ respectively. A dual fluorescence-labelled oligomer, 5′-(FAM)CACAC CCAGG CACAC ACTAC ACAT(TAMRA)-3′, served as the probe. Sequence data for the EBV genome were obtained from the GenBank sequence database. The principles of the real-time quantitative PCR assay and detailed reaction setup procedures were as described previously [4, 24]. The plasma EBV DNA concentration was calculated using the following equation: C = Q × (VDNA/VPCR) ×(1/VEXT), in which C represents the target concentration in plasma (copies/ml), Q represents the target quantity (copy number) determined by PCR, VDNA represents the total volume of DNA obtained after extraction (typically 50 μl/Qiagen extraction), VPCR represents the volume of DNA solution used for PCR (typically 2 μl), and VEXT represents the volume of plasma extracted (typically 0.5 ml) [24].
CLINICAL TREATMENT
Radiotherapy
All patients underwent IMRT at Sun Yat-sen University Cancer Center. Immobilization was carried out using a custom-made head-to neck-thermoplastic cast with the patient’s neck resting on a support. A high-resolution planning CT scan with contrast was taken from the vertex to 2 cm below the sternoclavicular joint at a slice thickness of 3 mm. Target volumes were delineated slice-by-slice on treatment planning CT scans using an individualized delineation protocol that complies with the guidelines of the International Commission on Radiation Units and Measurements reports 50 and 62. The prescribed doses were 66–72 Gy at 2.12–2.43 Gy/fraction to the planning target volume (PTV) of the primary gross tumour volume (GTVnx), 64–70 Gy to the PTV of the GTV of the involved lymph nodes (GTVnd), 60–63 Gy to the PTV of the high-risk clinical target volume (CTV1), and 54–56 Gy to the PTV of the low-risk clinical target volume (CTV2). All targets were treated simultaneously using the simultaneous integrated boost technique.
Chemotherapy
According to our institutional guidelines, before commencing treatment, we recommended radiotherapy alone for stage I disease, concurrent chemoradiotherapy for stage II disease, and concurrent chemoradiotherapy (CCRT) +/- neoadjuvant/adjuvant chemotherapy for stage III to IVB disease. Neoadjuvant or adjuvant chemotherapy consisted of cisplatin with 5-fluorouracil, cisplatin with taxels (docetaxel and paclitaxel) or a triplet of cisplatin and 5-fluorouracil plus taxels every three weeks for two or three cycles. Concurrent chemotherapy consisted of weekly cisplatin (30-40 mg/m2) or 3-weekly cisplatin (80-100 mg/m2) on weeks 1, 4 and 7 of radiotherapy.
Follow-up and statistical analysis
Patient follow-up was conducted from the first day of therapy to the day of last examination or death. Patients were examined at least every 3 months during the first 2 years, with follow-up examinations conducted every 6 months thereafter until death. DFS was set as the first endpoint, and secondary endpoints included OS, DMFS and LRRFS.
The chi-square test or Fisher exact test was used to compare categorical variables and treatment failure patterns between the EBV-positive and EBV-negative group. Life-table estimation was performed using the Kaplan-Meier method, and differences were compared using the log-rank test. The multivariate Cox proportional hazards model was used to estimate the hazard ratios (HRs) and calculate 95% confidence intervals (CIs). The variables input in the model included age, gender, pathology type, T classification, N classification, chemotherapy, pre-treatment EBV DNA level, smoking and drinking. All statistical tests were two-sided; P < 0.05 was considered to indicate statistical significance. Stata Statistical Package (STATA 12; StataCorp LP, College Station, TX, USA) was used for all the analyses.
CONCLUSION
In summary, our current study confirmed that the EBV status was found to be an independent prognostic factor for patients with stage III–IVB NPC. NCT plus CCRT should be better treatment regimen for patients with positive EBV since distant metastasis was the main failure pattern, and CCRT may be enough for EBV-negative patients since distant metastasis was not the main failure pattern.
CONFLICTS OF INTEREST
The authors declare no conflict of interest.
GRANT SUPPORT
This work was supported by grants from the Key Laboratory Construction Project of Guangzhou City, China (No.121800085), the Health & Medical Collaborative Innovation Project of Guangzhou City, China (201400000001), the Sun Yat-sen University Clinical Research 5010 Program (No. 2012011), the Science and Technology Project of Guangzhou City, China (No. 14570006), and the Planned Science and Technology Project of Guangdong Province (No. 2013B020400004).
REFERENCES
1. Jemal A, Bray F, Center MM, Ferlay J, Ward E, Forman D. Global cancer statistics. CA Cancer J Clin. 2011; 61: 69-90.
2. Lee AW, Ma BB, Ng WT, Chan AT. Management of Nasopharyngeal Carcinoma: Current Practice and Future Perspective. J Clin Oncol. 2015; 33:3356-64.
3. Lin JC, Wang WY, Chen KY, Wei YH, Liang WM, Jan JS, Jiang RS. Quantification of plasma Epstein-Barr virus DNA in patients with advanced nasopharyngeal carcinoma. N Engl J Med. 2004; 350: 2461-70.
4. Lin JC, Wang WY, Liang WM, Chou HY, Jan JS, Jiang RS, Wang JY, Twu CW, Liang KL, Chan J, Shen WC. Long-term prognostic effects of plasma epstein-barr virus DNA by minor groove binder-probe real-time quantitative PCR on nasopharyngeal carcinoma patients receiving concurrent chemoradiotherapy. Int J Radiat Oncol Biol Phys. 2007; 68: 1342-8.
5. Lo YM, Chan LY, Chan AT, Leung SF, Lo KW, Zhang J, Lee JC, Hjelm NM, Johnson PJ, Huang DP. Quantitative and temporal correlation between circulating cell-free Epstein-Barr virus DNA and tumor recurrence in nasopharyngeal carcinoma. Cancer Res. 1999; 59: 5452-5.
6. Guo R, Sun Y, Yu XL, Yin WJ, Li WF, Chen YY, Mao YP, Liu LZ, Li L, Lin AH, Ma J. Is primary tumor volume still a prognostic factor in intensity modulated radiation therapy for nasopharyngeal carcinoma? Radiother Oncol. 2012; 104: 294-9.
7. Tian YM, Xiao WW, Bai L, Liu XW, Zhao C, Lu TX, Han F. Impact of primary tumor volume and location on the prognosis of patients with locally recurrent nasopharyngeal carcinoma. Chin J Cancer. 2015; 34: 247-53.
8. Wan XB, Wei L, Li H, Dong M, Lin Q, Ma XK, Huang PY, Wen JY, Li X, Chen J, Ruan DY, Lin ZX, Chen ZH, et al. High pretreatment serum lactate dehydrogenase level correlates with disease relapse and predicts an inferior outcome in locally advanced nasopharyngeal carcinoma. Eur J Cancer, 2013; 49: 2356-64.
9. Guo R, Chen XZ, Chen L, Jiang F, Tang LL, Mao YP, Zhou GQ, Li WF, Liu LZ, Tian L, Lin AH, Ma J. Comorbidity predicts poor prognosis in nasopharyngeal carcinoma: development and validation of a predictive score model. Radiother Oncol. 2015; 114: 249-56.
10. An X, Wang FH, Ding PR, Deng L, Jiang WQ, Zhang L, Shao JY, Li YH. Plasma Epstein-Barr virus DNA level strongly predicts survival in metastatic/recurrent nasopharyngeal carcinoma treated with palliative chemotherapy. Cancer. 2011; 117: 3750-7.
11. Twu CW, Wang WY, Liang WM, Jan JS, Jiang RS, Chao J, Jin YT, Lin JC. Comparison of the prognostic impact of serum anti-EBV antibody and plasma EBV DNA assays in nasopharyngeal carcinoma. Int J Radiat Oncol Biol Phys. 2007; 67: 130-7.
12. Lo YM, Leung SF, Chan LY, Lo KW, Zhang J, Chan AT, Lee JC, Hjelm NM, Johnson PJ, Huang DP. Plasma cell-free Epstein-Barr virus DNA quantitation in patients with nasopharyngeal carcinoma. Correlation with clinical staging. Ann N Y Acad Sci. 2000; 906: 99-101.
13. Chua ML, Wee JT, Hui EP, Chan AT. Nasopharyngeal carcinoma. Lancet. 2016; 387:1012-24.
14. Fan H, Nicholls J, Chua D, Chan KH, Sham J, Lee S, Gulley ML. Laboratory markers of tumor burden in nasopharyngeal carcinoma: a comparison of viral load and serologic tests for Epstein-Barr virus. Int J Cancer. 2004; 112: 1036-41.
15. Lo KW, Chung GT, To KF. Deciphering the molecular genetic basis of NPC through molecular, cytogenetic, and epigenetic approaches. Semin Cancer Biol. 2012; 22: 79-86.
16. Lo KW, Huang DP. Genetic and epigenetic changes in nasopharyngeal carcinoma. Semin Cancer Biol. 2002; 12: 451-62.
17. Chan YH, Lo CM, Lau HY, Lam TH. Vertically transmitted nasopharyngeal infection of the human papillomavirus: does it play an aetiological role in nasopharyngeal cancer? Oral Oncol. 2014; 50: 326-9.
18. Dogan S, Hedberg ML, Ferris RL, Rath TJ, Assaad AM, Chiosea SI. Human papillomavirus and Epstein-Barr virus in nasopharyngeal carcinoma in a low-incidence population. Head Neck. 2014; 36: 511-6.
19. Lin Z, Khong B, Kwok S, Cao H, West RB, Le QT, Kong CS. Human papillomavirus 16 detected in nasopharyngeal carcinomas in white Americans but not in endemic Southern Chinese patients. Head Neck. 2014; 36: 709-14.
20. Maxwell JH, Kumar B, Feng FY, McHugh JB, Cordell KG, Eisbruch A, Worden FP, Wolf GT, Prince ME, Moyer JS, Teknos TN, Chepeha DB, Stoerker J, et al. HPV-positive/p16-positive/EBV-negative nasopharyngeal carcinoma in white North Americans. Head Neck. 2010; 32: 562-7.
21. Stenmark MH, McHugh JB, Schipper M, Walline HM, Komarck C, Feng FY, Worden FP, Wolf GT, Chepeha DB, Prince ME, Bradford CR, Mukherji SK, Eisbruch A, et al. Nonendemic HPV-positive nasopharyngeal carcinoma: association with poor prognosis. Int J Radiat Oncol Biol Phys. 2014; 88: 580-8.
22. Ferrari D, Codeca C, Bertuzzi C, Broggio F, Crepaldi F, Luciani A, Floriani I, Ansarin M, Chiesa F, Alterio D, Foa P. Role of plasma EBV DNA levels in predicting recurrence of nasopharyngeal carcinoma in a Western population. BMC Cancer. 2012; 12: 208.
23. Hou X, Zhao C, Guo Y, Han F, Lu LX, Wu SX, Li S, Huang PY, Huang H, Zhang L. Different clinical significance of pre- and post-treatment plasma Epstein-Barr virus DNA load in nasopharyngeal carcinoma treated with radiotherapy. Clin Oncol (R Coll Radiol). 2011; 23: 128-33.
24. Shao JY, Zhang Y, Li YH, Gao HY, Feng HX, Wu QL, Cui NJ, Cheng G, Hu B, Hu LF, Ernberg I, Zeng YX. Comparison of Epstein-Barr virus DNA level in plasma, peripheral blood cell and tumor tissue in nasopharyngeal carcinoma. Anticancer Res. 2004; 24: 4059-66.
25. Edge SB, Compton CC. The American Joint Committee on Cancer: the 7th edition of the AJCC cancer staging manual and the future of TNM. Ann Surg Oncol. 2010; 17: 1471-4.