
Introduction
Dopamine (DA) is known to be implicated in a variety of functions including reward [1, 2] and physical mobility [3, 4]. The DA system has been known to be vulnerable to the effects of aging [5]. Human imaging studies have shown that the rate of D2R loss during aging occurs at approximately 10% per decade [6]. While it is apparent that D2R decreases in both human and rodent brains as a result of physiological deterioration following senescence, the functional consequences of this decline on behavior and lifespan are not fully understood [7-9].
The integrity of the DA system diminishes with age and contributes heavily to neurodegenerative diseases affecting motor output [10]. In particular, alterations in D2R have been associated as a primary mechanism for motor deficits [7, 11]. Several key areas of the brain are particularly vulnerable to the effects of aging: the substantia nigra (SNc), the ventral tegmental area (VTA), and the striatum. The SNc and VTA are the primary source for projecting DA neurons. DA neurons in the SNc project mainly to the dorsolateral striatum, forming the nigrostriatal pathway while DA neurons in the VTA project to the ventromedial striatum and the cortex, forming the mesolimbic and mesocortical pathways, respectively [12]. Decline in DA neuron populations within these areas, especially within the nigrostriatal pathway, has been shown to contribute to motor impairment and the progression of Parkinson’s disease (PD) [13-16]. Additionally, decreases in SNc connectivity within the basal ganglia circuitry [17] as well as a decline in midbrain DA synthesis [16] have also been associated with PD. Moreover, a D2R deficiency has been known to lead to reduced spontaneous mobility and produce PD-like symptoms [18]. However, it should be noted that alterations in other DA receptor may also play an integral role in motor output. While traditional models understand DA-related locomotion through the cAMP pathway, modulated by the opposite functions of D1 and D2 receptors, it has been demonstrated that the PLC/IP3 pathway also contributes to locomotion exclusively through the activation of the D1 receptor; thus establishing the involvement of D1 receptor function in the discussion of PD [19].
D2R ability to modulate reward seeking behavior, motivation, and expectation of a reward, influences feeding behavior [20]. Alterations in the DA reward system can lead to abnormal eating behavior; the down regulation of D2R receptor signaling is thought to reduce sensitivity to reward, providing an incentive to overeat [21, 22]. This has been shown in human and rodent imaging studies, where obese subjects showed lower striatal D2R expression, which may pose as a risk factor for overeating [23-25]. Obese subjects showed a negative correlation between striatal D2R expression and body mass index [23]. Similar findings of reduced striatal D2R expression were also seen in rodent studies [25]. Reductions in D2R gene expression have also been associated with lower metabolism in the prefrontal cortex (PFC), which plays an important role in inhibitory control. The combination of reduced D2R signaling and reductions in prefrontal metabolism are thought to be powerful mediators with respect to the role of food intake and may contribute to obesity [24].
An EE is characterized by sensory, motor and social stimulation relative to standard housing conditions [26]. The incorporation of exercise is an important component of an EE and its benefits have been shown to be a powerful mediator of brain function and behaviour [27-29]. Furthermore, it has been shown that the benefits of an EE promote neurogenesis within the hippocampus [30, 31]. An EE also has the ability to modulate DA activity within certain areas of the brain; specifically, mice living in an EE show reduced DA release within the PFC [32, 33].
While it can be difficult to analyze which environmental components have influence over various domains of cognition, it is thought that the aerobic exercise component is a critical factor involved in the formation of memory [34]. Mustroph and colleagues has demonstrated in C57BL/6J mice that an EE, without the exercise component, failed to increase neurogenesis within the hippocampus and consequently improve cognition [34]. It is suggested that exercise may counteract some of the age-related deficits in metabolic support and neuronal dysfunction [35]. Moreover, research on the role of D2R in the aging process have revealed important polymorphic associations of the dopamine D2R gene and magnification of the aging process especially as it relates to memory and cognition [36, 37]. There is also research showing that polymorphisms of the D2 gene may influence the ability to be able to change ones goals as a function of environment. This flexible cognitive switching is an endophenotype of executive functioning and is highly heritable. Specifically, Markett and colleagues showed that carriers of the D2 A1+ variant who have a 30% decrease in lower striatal dopamine D2 receptor density compared to A1- carriers show a larger backward inhibition effect [38]. In line with previous results demonstrating increased behavioral flexibility in carriers of this genetic variant which favors cognitive flexibility may be important for cognitive manipulation, survival and lifespan.
To determine whether the D2R gene is involved in the mechanism of environmental enrichment, different housing conditions were examined in mice. This study hypothesized that the D2 gene, in the presence of an EE, significantly influenced lifespan, body weight, and locomotor activity.
Results
Lifespan
Lifespan was measured in weeks and analyzed with a 2x3 Factorial ANOVA using sex, genotype and environment as the variable factors. Average lifespan for the entire population was 96.4 ± 1.43SE weeks, with the main effect of sex not being significant (F(1, 230) = .56; p > 0.05, ηp2 = .002).
The main effect of genotype was significant (F(2, 230) = 12.3; p < .001, ηp2 = 0.10; Figure 1), such that Drd2 -/- had a 15.2% shorter lifespan than Drd2 +/+ and 14.5% shorter lifespan than Drd2 +/- (p < .05). Similarly, lifespan means for Drd2 +/+ were significantly greater than Drd2 +/- (p > .05). Environment also had a significant effect (F(1, 230) = 6.64; p > .05, ηp2 = .03), such that EE mice lived 8.2% longer than DE mice.
The interaction of genotype x environment was also significant (F(2,230) = 7.00; p < .001, ηp2 = .05). Between environments, Drd2 +/+ mice significantly benefited from an EE, living more than 18% longer than their DE counterparts. The 13% increase in lifespan for Drd2 +/- EE mice over their DE counterparts was found to also be significant (p = .05), whereas Drd2 -/- lifespan was not significant between environments (p > .05) (see Figure 1). While the effects of genotype within a DE were not significant (F(2, 128) = .52 p > 0.05; η2 = 0.01), the effects of genotype in a EE were (F(2, 111) = 15.2; p < .001, η2 = .22), such that average lifespan for Drd2 -/- EE mice was 25% shorter than Drd2 +/+ EE and nearly 23% shorter than Drd2 +/- EE mice (p < .0001 for both). Lifespans between Drd2 +/+ and Drd2 +/- EE mice were not significant (p > .05) (see Figure 1 and Supplement Table 1).
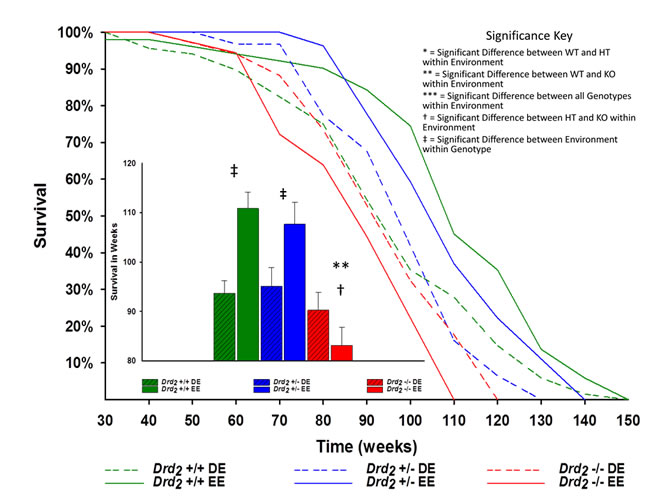
Figure 1: Main - Kaplan-Meier survival curves of mice for genotype and environment. DE mice are dashed line and EE mice have solid lines. Drd2 +/+ are green, Drd2 +/- are blue and Drd2 -/- are red. Inset - Average lifespan ± SEM for each group. Drd2 +/+ EE mice lived more than 18% longer than their DE counterparts; ‡p < 0.0001. Drd2 -/- EE mice were found to have a 25% shorter lifespan compared to Drd2 +/+ EE; **p < 0.0001, and 23% shorter compared to Drd2 +/- EE mice; †p < 0.0001. The 13% increase in Drd2 +/- EE over Drd2 +/- DE was found to be significant; p = 0.05.
Body weight
A 2 (sex) x 6 (time) mixed factorial ANOVA which weight was the dependent variable produced a significant main effect for sex (F(1, 273) = 216.42; p < 0.001, ηp2 = 0.44). Overall, male mice weighed more than female mice, and interaction of sex and time revealed that males were heavier than females during every time point.
Subsequent analysis was employed with a repeated measure ANCOVA using sex as a covariate, and genotype, environment and time as variable factors. There was a significant main effect for time (F(5, 1365) = 158.2; p < .001, ηp2 = 0.37) which was best explained by a quadratic effect (FQuadratic (1,273) = 274.95, p < .001, ηp2 = 0.50). For all groups, body weights rose during months 4 through 16, and then declined in months 20 and 24.
The main effect of genotype was significant (F(2, 273) = 4.62; p < .05, ηp2 = .03). Drd2 +/- mice weighed an overall 3% more than Drd2 +/+ (p < 0.05) and 5% heavier than Drd2 -/- (p < .01) (see Figure 2A).
The interaction of genotype and time was significant (F(10, 1365) = 12.90; p = .001, ηp2 = 0.09; Figure 2A). At 4 and 8 months of age, Drd2 +/+ mice weighed less than Drd2 +/- (p < .05) and Drd2 -/- (p < 0.001). At 12 months of age, Drd2 +/- had a greater body weight than Drd2 +/+ (p < .01). Drd2 +/- body weights peaked at 16 months of age and was more than 14% greater than both Drd2 +/+ and Drd2 -/- (p > 0.001 for both). At 20 and 24 months of age, Drd2 -/- body weight dropped by 8% to 11% compared to Drd2 +/+, and 6% to 7% compared to Drd2 +/- (see Figure 2A).
The interaction of genotype x environment x time was significant (F(10, 1365) = 10.70; p < .001, ηp2 = 0.07). However, the genotype x time interaction is greater (meaning more variation across genotypes) among the EE mice than the DE mice.
Within the DE, there was a significant effect for genotype for mice at 4 months of age, such that Drd2 -/- weighed significantly more than Drd2 +/+ (p < .01). All genotypes within the DE had equivalent body weights at 8 months of age, however, at 12 months, Drd2 +/- had greater a greater body weight than Drd2 +/+ (p < 05). At 16 months of age, Drd2 +/- weighed significantly more than Drd2 +/+ and Drd2 -/- mice (p < 0.001 for both). However, at 20 and 24 months of age, Drd2 +/- body weight dropped and all genotypes had equivalent weights (p > .05 for both time points)(see Figure 2B and Supplement Table 2). Within the EE, Drd2 +/+ had lower body weights at 4 months and 8 months of age compared to Drd2 +/- and Drd2 -/- (p < 05). Drd2 +/- body weight at 12 months of age was greater than Drd2 +/+ (p < .05). At 16 months of age Drd2 -/- body weight was less than both Drd2 +/+ and Drd2 +/- (p < .05). During 20 and 24 months of age, Drd2 +/+ were heavier than Drd2 +/- (p < .05), who were heavier than Drd2 -/- (p < .01) (see Figure 2B and Supplement Table 2).
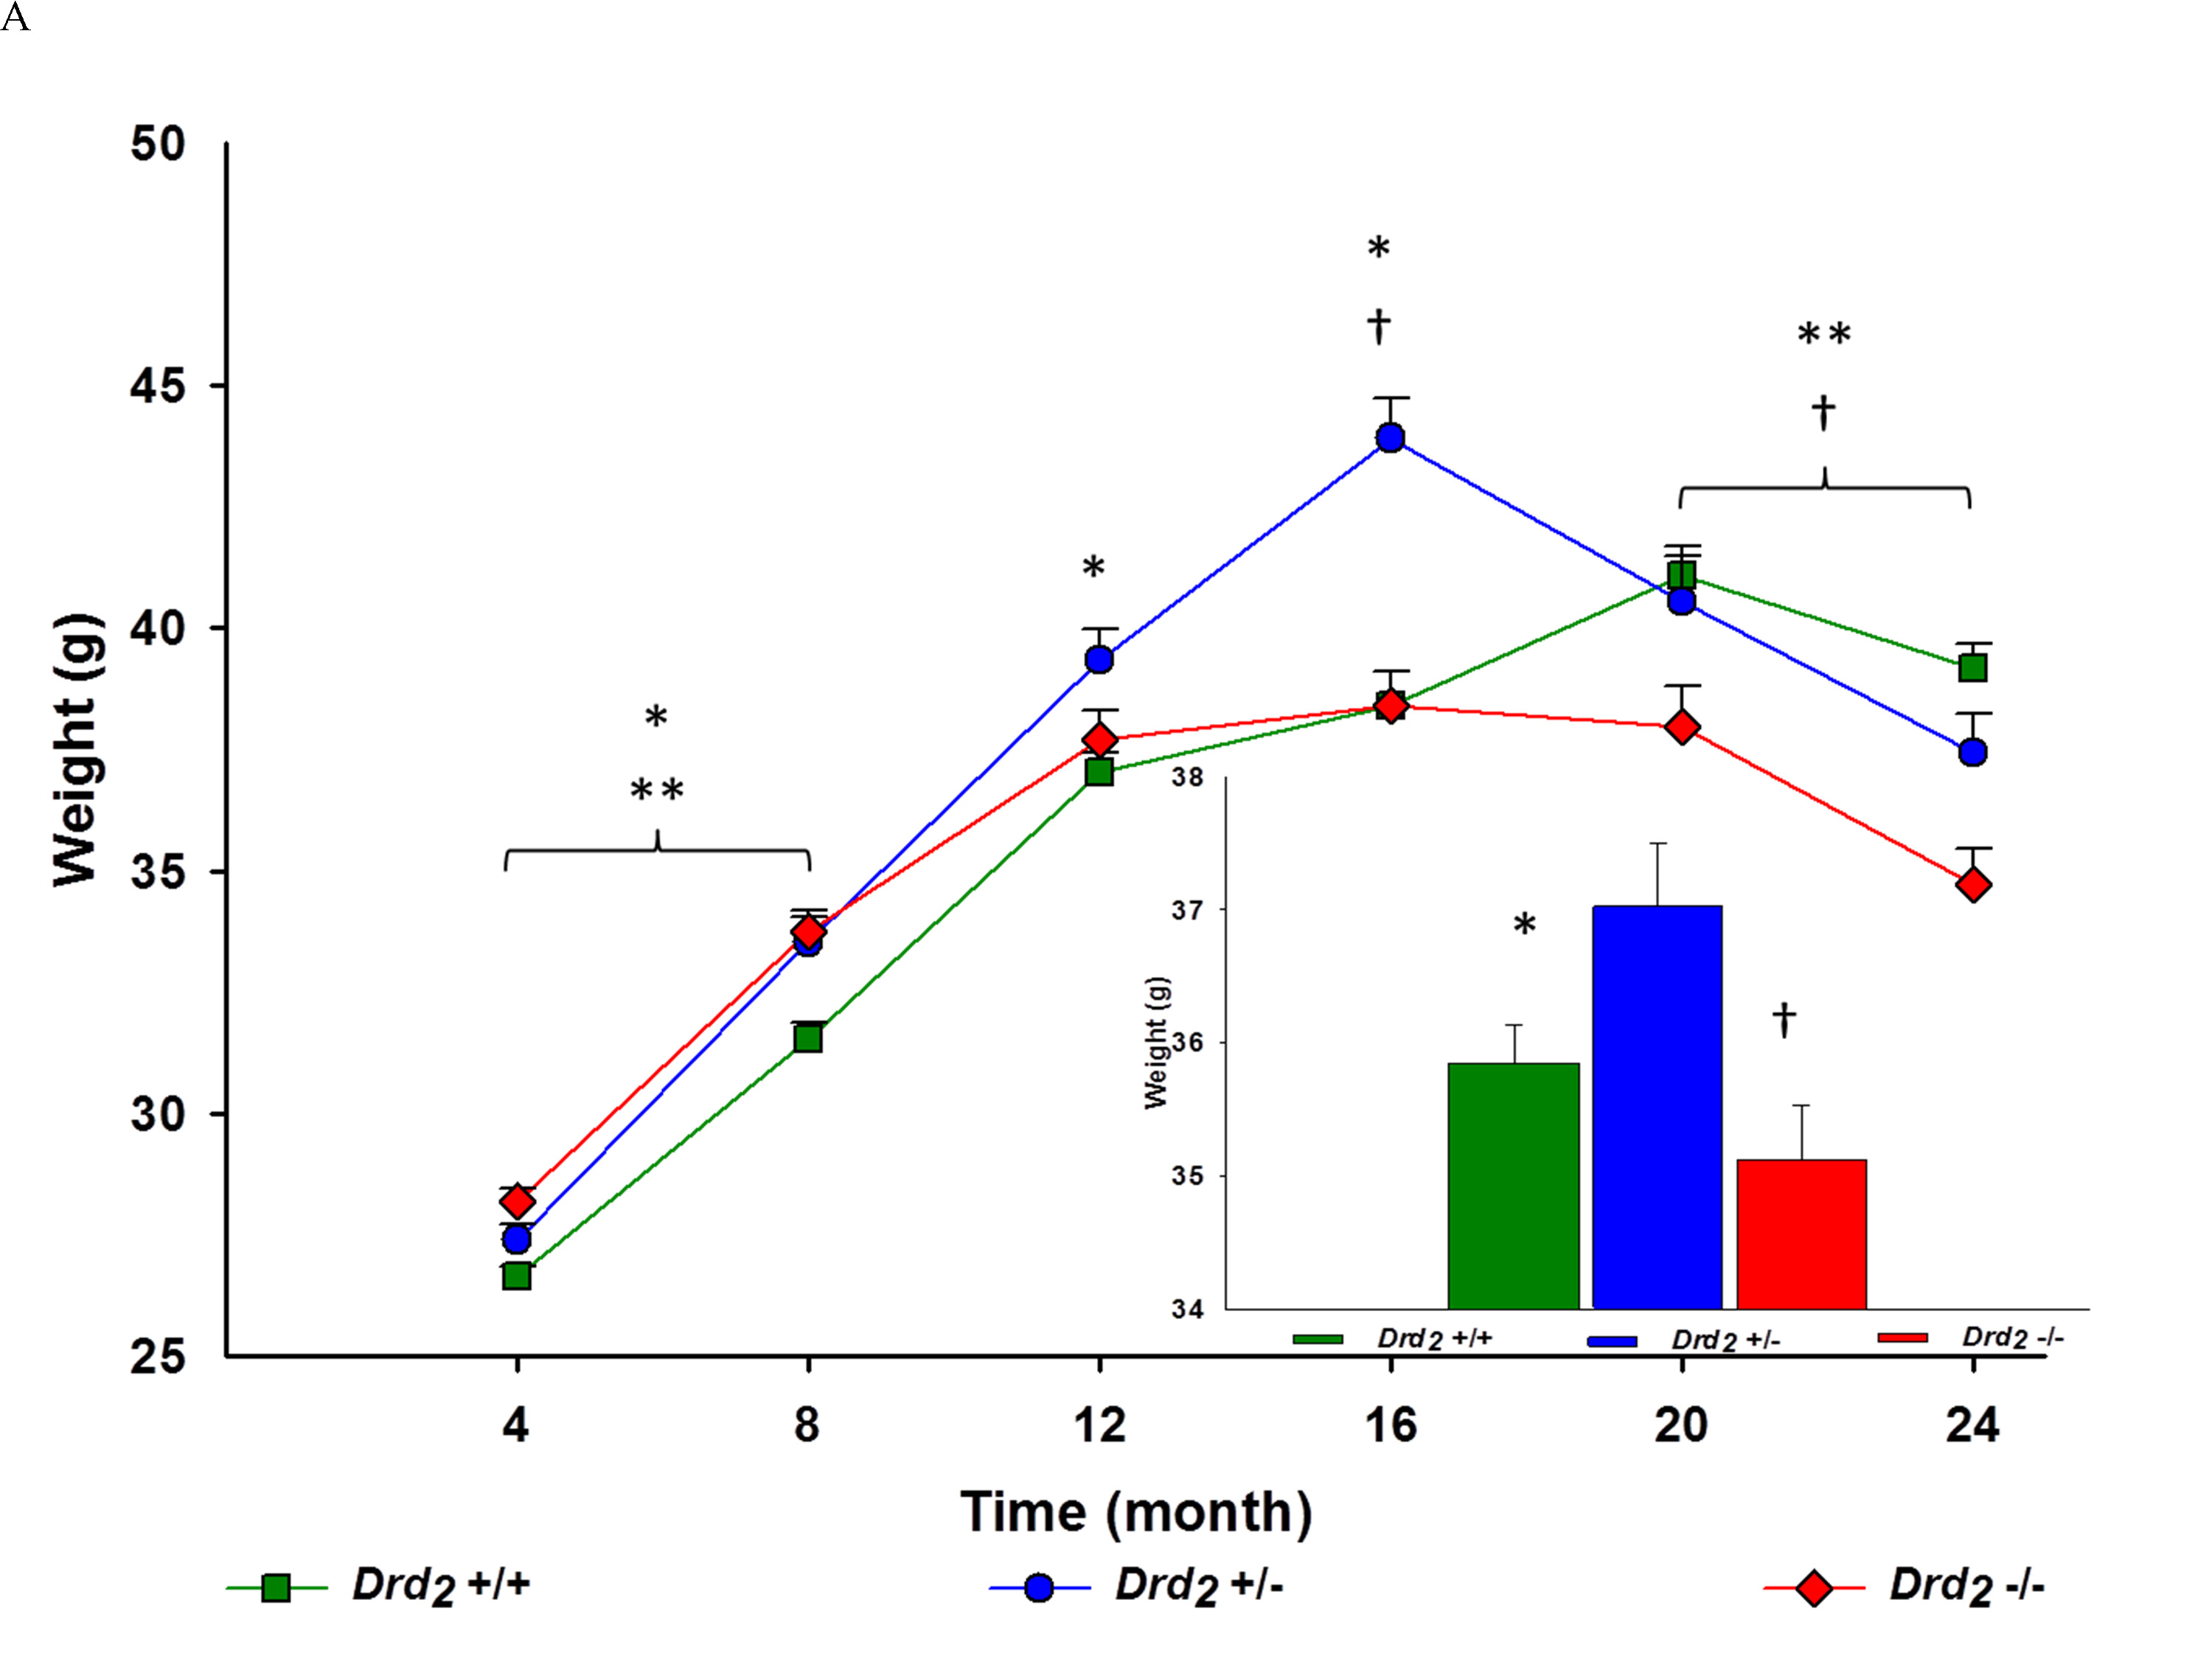
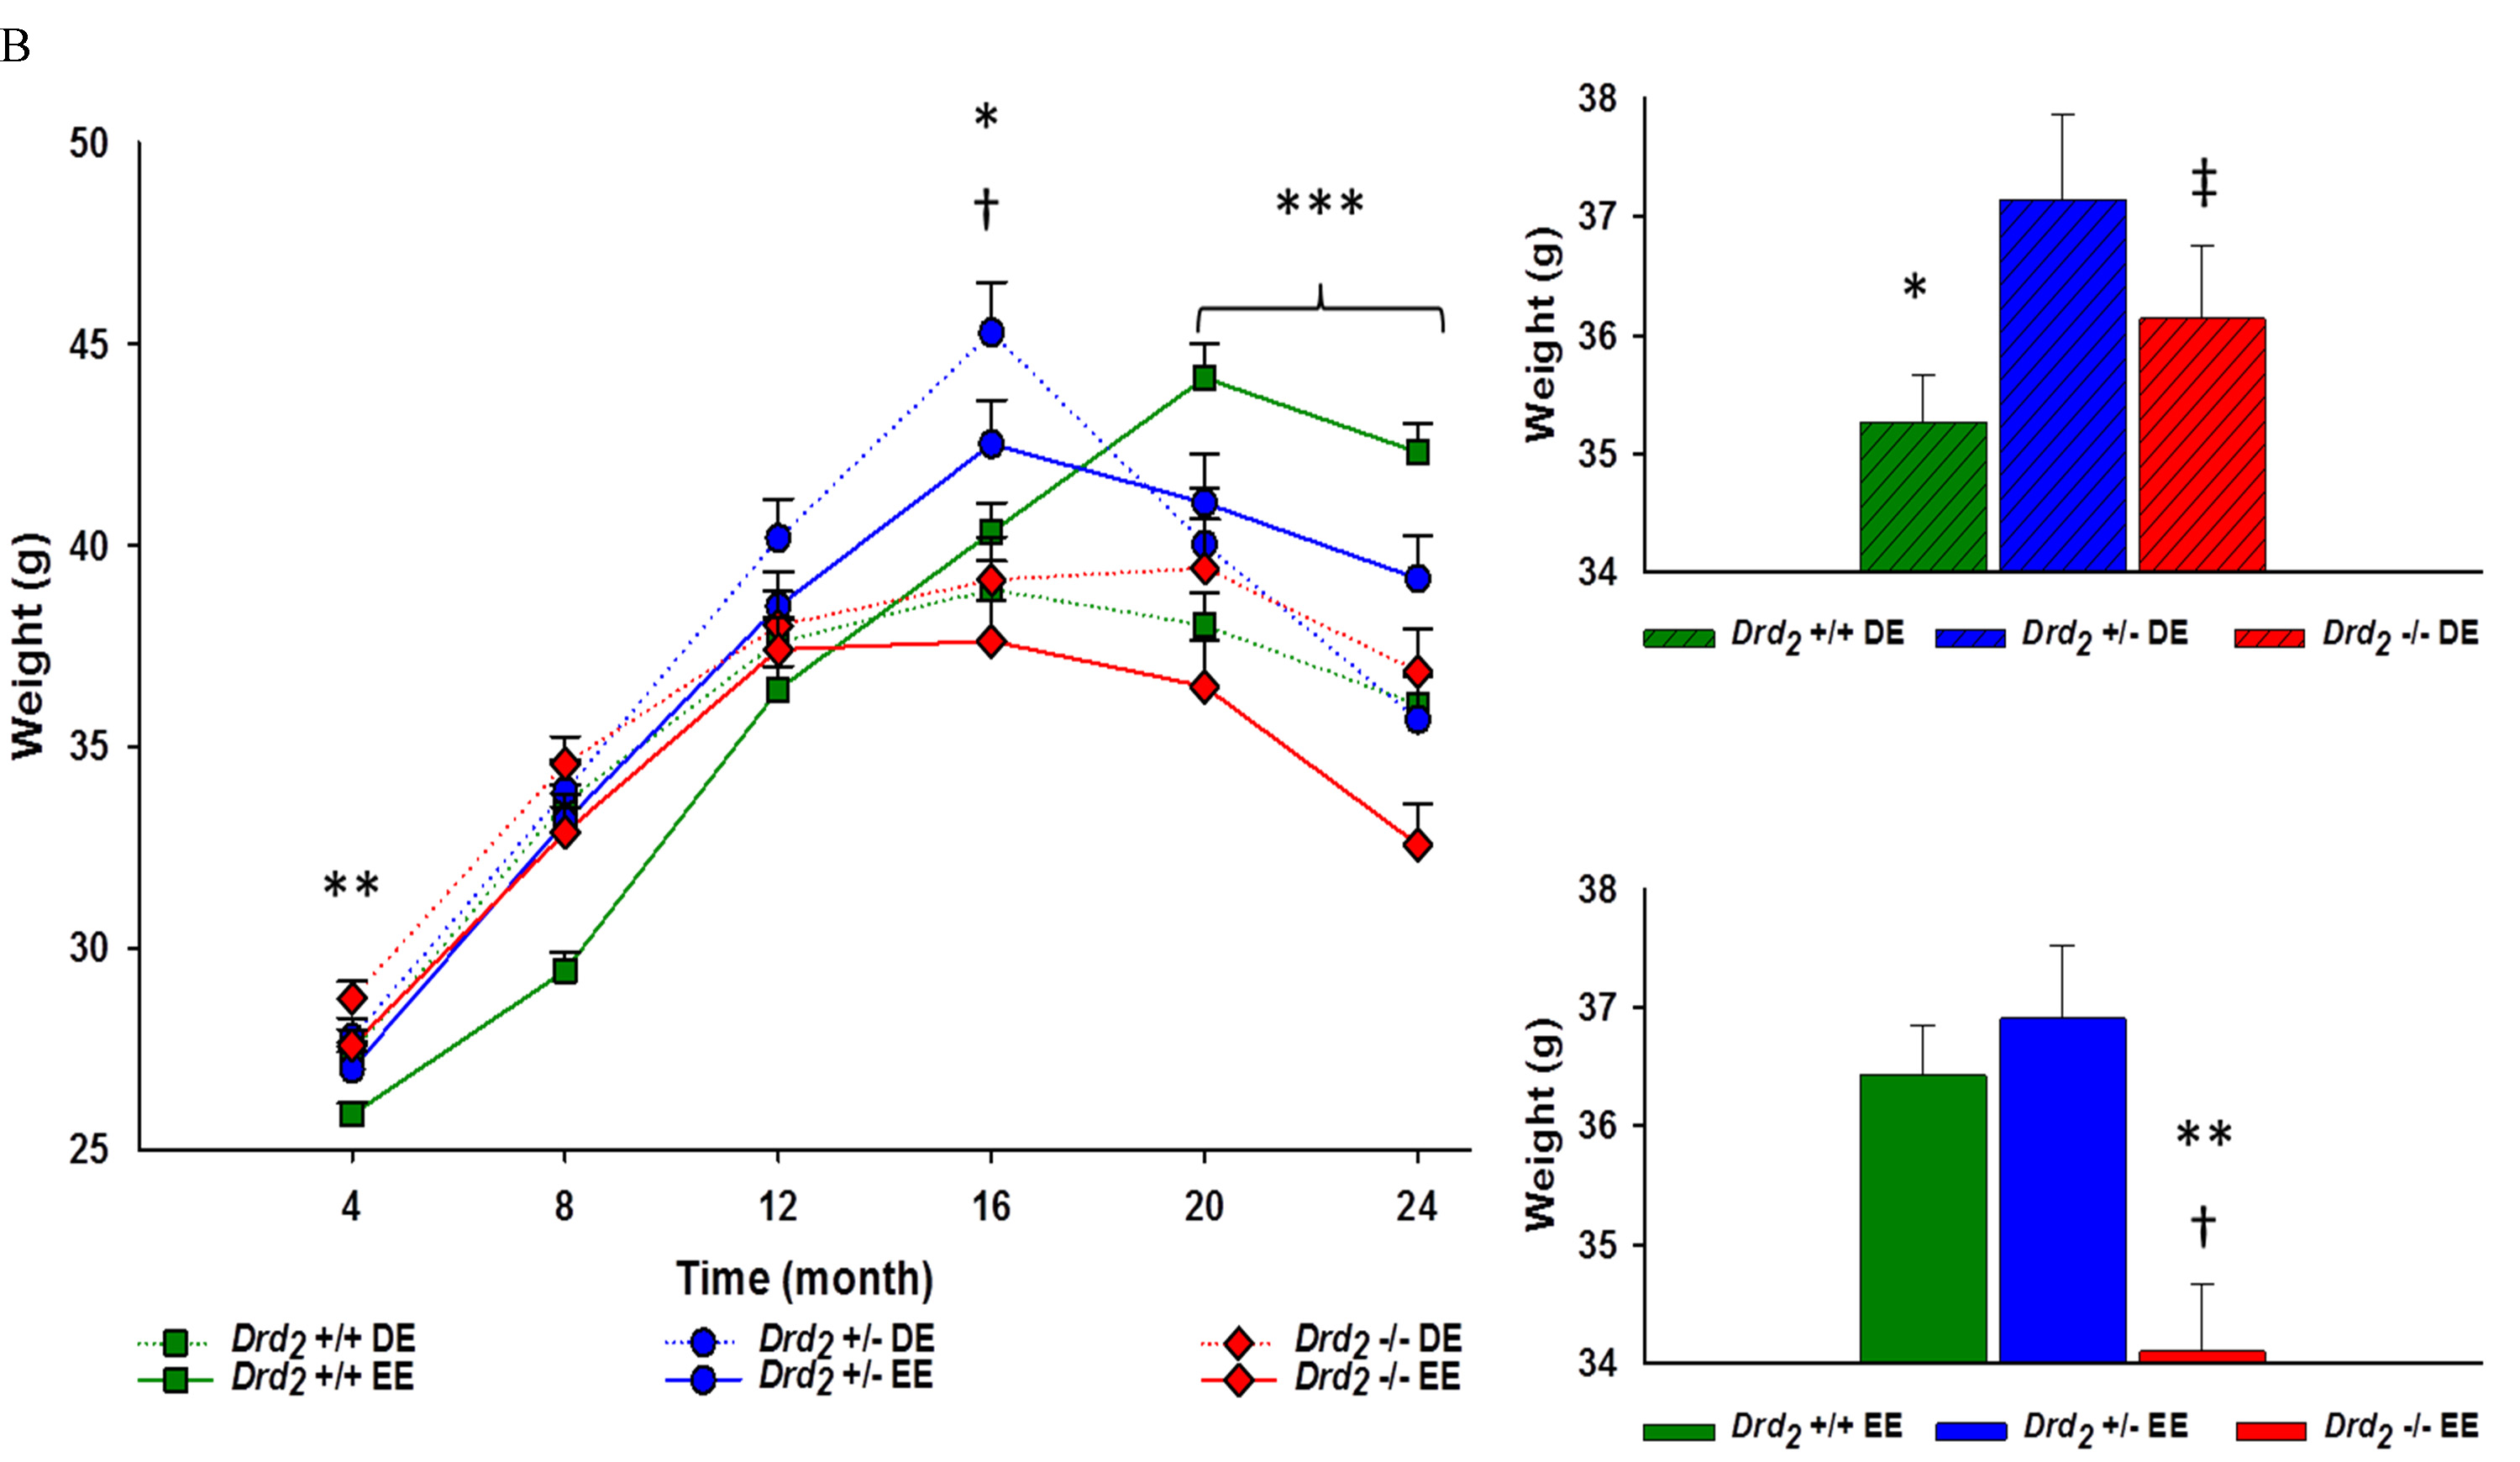
Figure 2: A. Main - Body weight for genotype, collapsing environment, at 4 month intervals for 24 months. Genotype x time interaction showed significantly different body weights at all time points; *Drd2 +/+ vs. Drd2 +/- p < 0.05, **Drd2 +/+ vs. Drd2 -/- p < 0.05, †Drd2 +/- vs. Drd2 -/- p < 0.05. Inset - Average body weight for each genotype ± SEM. Drd2 +/- had an overall 3% greater body weight than Drd2 +/+; *p < 0.05, and 5% greater body weight than Drd2 -/-; †p < 0.01. B. Left - Interaction of genotype x environment over time at 4 month intervals for 24 months. Significant differences between body weights were found at Month 4 and 16 DE mice, and Month 20 and 24 within EE mice; *Drd2 +/+ vs. Drd2 +/- p < 0.001, **Drd2 +/+ vs. Drd2 -/- p < 0.05, †Drd2 +/- vs. Drd2 -/- p < 0.05, ***Drd2 +/+ vs. Drd2 +/- vs. Drd2 -/- p < 0.001. Right - Average body weight for DE (Top) and EE (Bottom) for each genotype x environment. Within DE mice, Drd2 +/- had an overall 5% greater body weight than Drd2 +/+; *p < 0.05. Within EE mice, Drd2 -/- had an overall 6% lower body weight than **Drd2 +/+, and 8% lower than †Drd2 +/- ; p < 0.001. Between environments, ‡Drd2 -/- within the DE had a 6% overall greater body weight than their EE counterparts. A 3% difference in body weight between DE and EE Drd2 +/+ were found to be approaching significance; p = 0.05.
Locomotor
A mixed design ANOVA using sex and time as variable factors showed both the main effect of sex (F(1, 278) = 0.024; p > .05, η2 < .0001), and the interaction of sex over time (F(5, 1390) = 0.501; p > .05, η2 < .002) was not significant. Therefore, the variable sex has been dropped, and the remaining ANOVAs used genotype, environmental enrichment and time as factors.
The main effect for time was significant (F(5, 1370) = 17.3; p < .001, η2 = .06), which was best explained by a quadratic effect (FQuadratic (1, 274) = 38.3; p < .0001, η2 = .12). Activity was highest during 8 and 12 months of age, then declining through 16 to 24 months of age (see Supplement Table 3A).
The main effect for genotype (F(2, 274) = 89.8; p < .001, η2 = .40), and the interaction of genotype x time (F(10, 1370) = 6.01; p < 0.001, η2 = .04) were significant. Overall, Drd2 +/+ had the highest activity levels, and Drd2 -/- had the lowest (p < .0001 between all genotypes) (see Figure 3A). From 4 to 20 months of age, activity levels for Drd2 -/- were below Drd2 +/+ and Drd2 +/- (p < .05). From 12 to 24 months of age, Drd2 +/+ were more active than Drd2 +/-, (p < .05). At 24 months of age Drd2 -/- activity was equivalent to both Drd2 +/+ and Drd2 +/- mice (p > .05) (see Figure 3A). The main effect of environment (F(1, 274) = 35.3; p < .001, η2 = 0.11) and the interaction of environment x time (F(5, 1370) = 5.73; p < .001, η2 = .02) were significant and assessed using independent sample t-tests. It was found that DE mice were significantly more active than EE mice for every month, except at 24 months of age (p > .05).
The interaction of genotype and environment was significant (F(2, 274) = 8.82; p < .001, η2 = 0.06). Between environments, Drd2 +/+ and Drd2 -/- DE mice were 3% and 16% more active than their EE counterparts. Drd2 +/- activity was similar between environments (p > .05). A trend was seen where Drd2 +/+ were more active than Drd2 +/- (p < .05) and Drd2 +/- were more active than Drd2 -/- (p < .01) was seen within both environments (see Figure 3B). The interaction of genotype x environment x time was significant (F(10, 1370) = 3.50; p < .001, η2 = 0.03). Greater variation between genotypes existed in the EE (8.5%) compared to the DE (4.4%). Within the DE, Drd2 +/+ had greater activity levels compared to Drd2 +/- at 4 and 24 months of age (p < .05), while this was seen from 12 to 20 months of age within the EE (p < .01). Drd2 -/- activity levels were lower than Drd2 +/+ at every month, regardless of environment, except at 24 months of age where DE Drd2 -/- had similar locomotor activity as DE Drd2 +/+. Drd2 +/- activity was greater than Drd2 -/- in both environments at 4 and 8 months of age (p < .01). This continued within the EE for 12 and 16 months of age (p < .0001). (See Figure 3B and Supplement Table 3B).
Between environments and within genotype over time, Drd2 +/+ DE activity levels were only greater than Drd2 +/+ EE at 4 and 8 months of age (p < 0.01). Activity levels between Drd2 +/- DE and EE were similar for all months, except at 12 and 20 months of age, where DE activity was greater than EE activity (p < .05). In contrast, Drd2 -/- DE activity levels were greater than Drd2 -/- EE after 4 months of age (p < .05) (see Figure 3B and Supplement Table 3B).
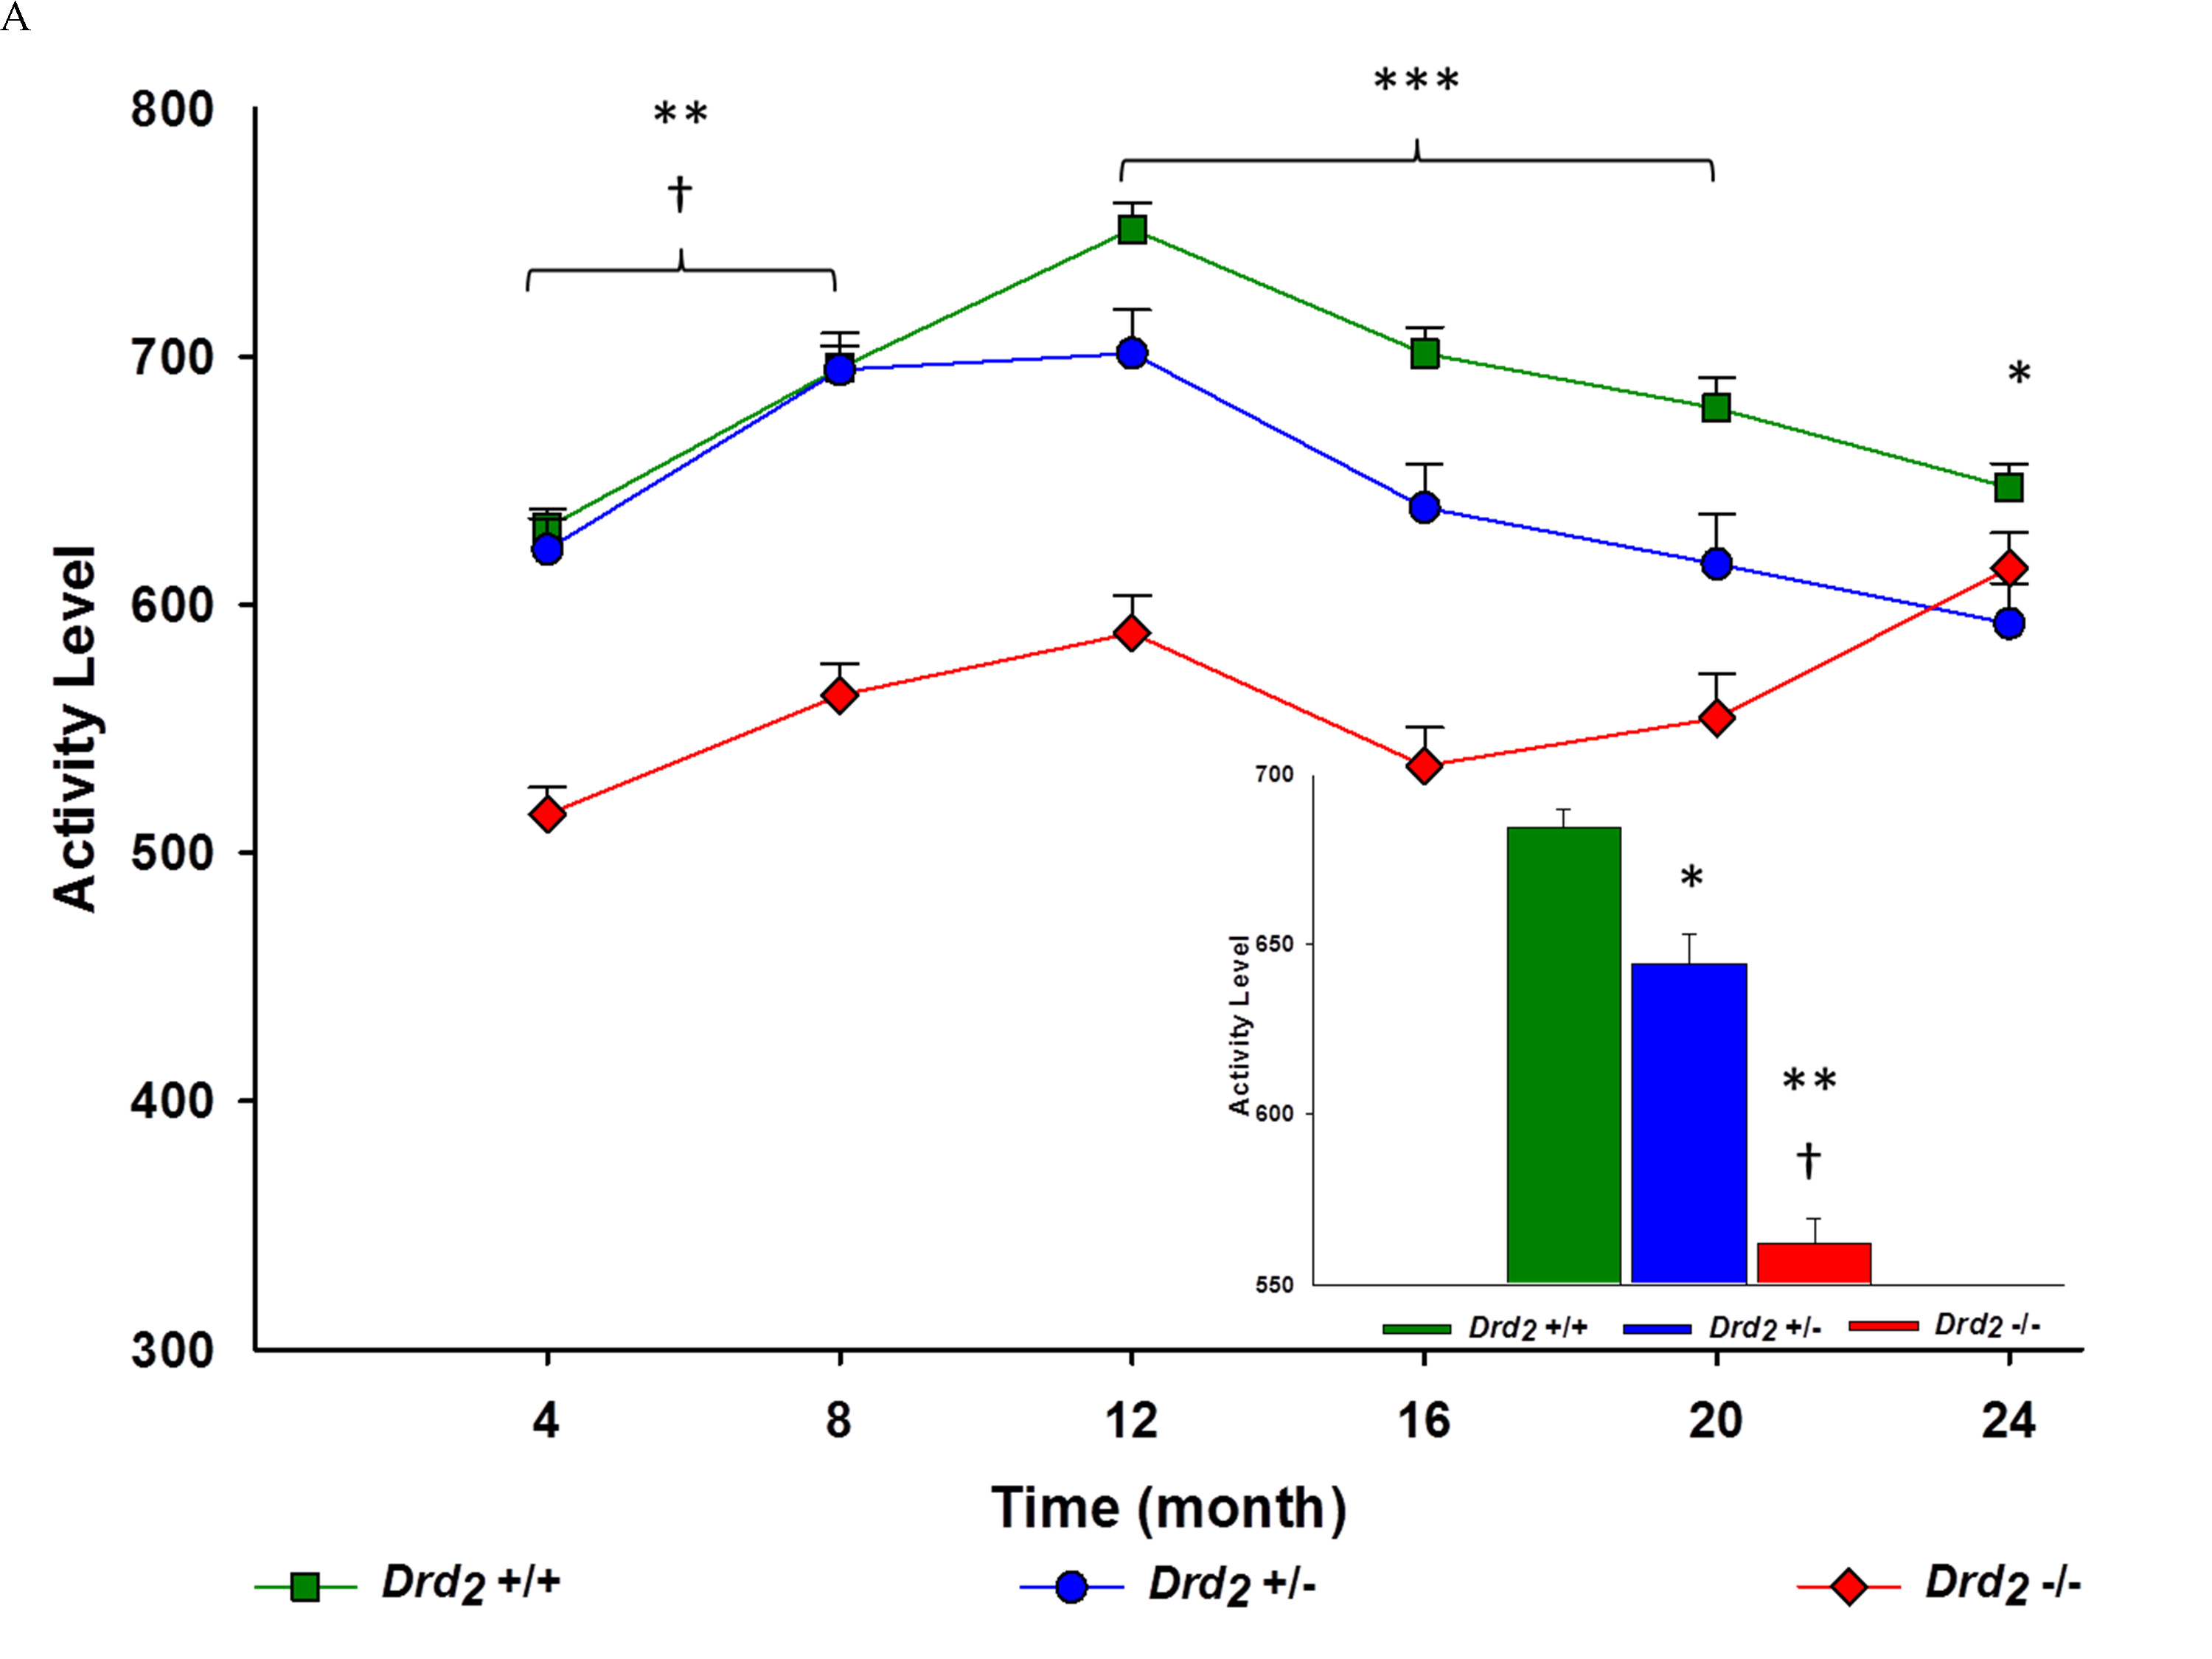
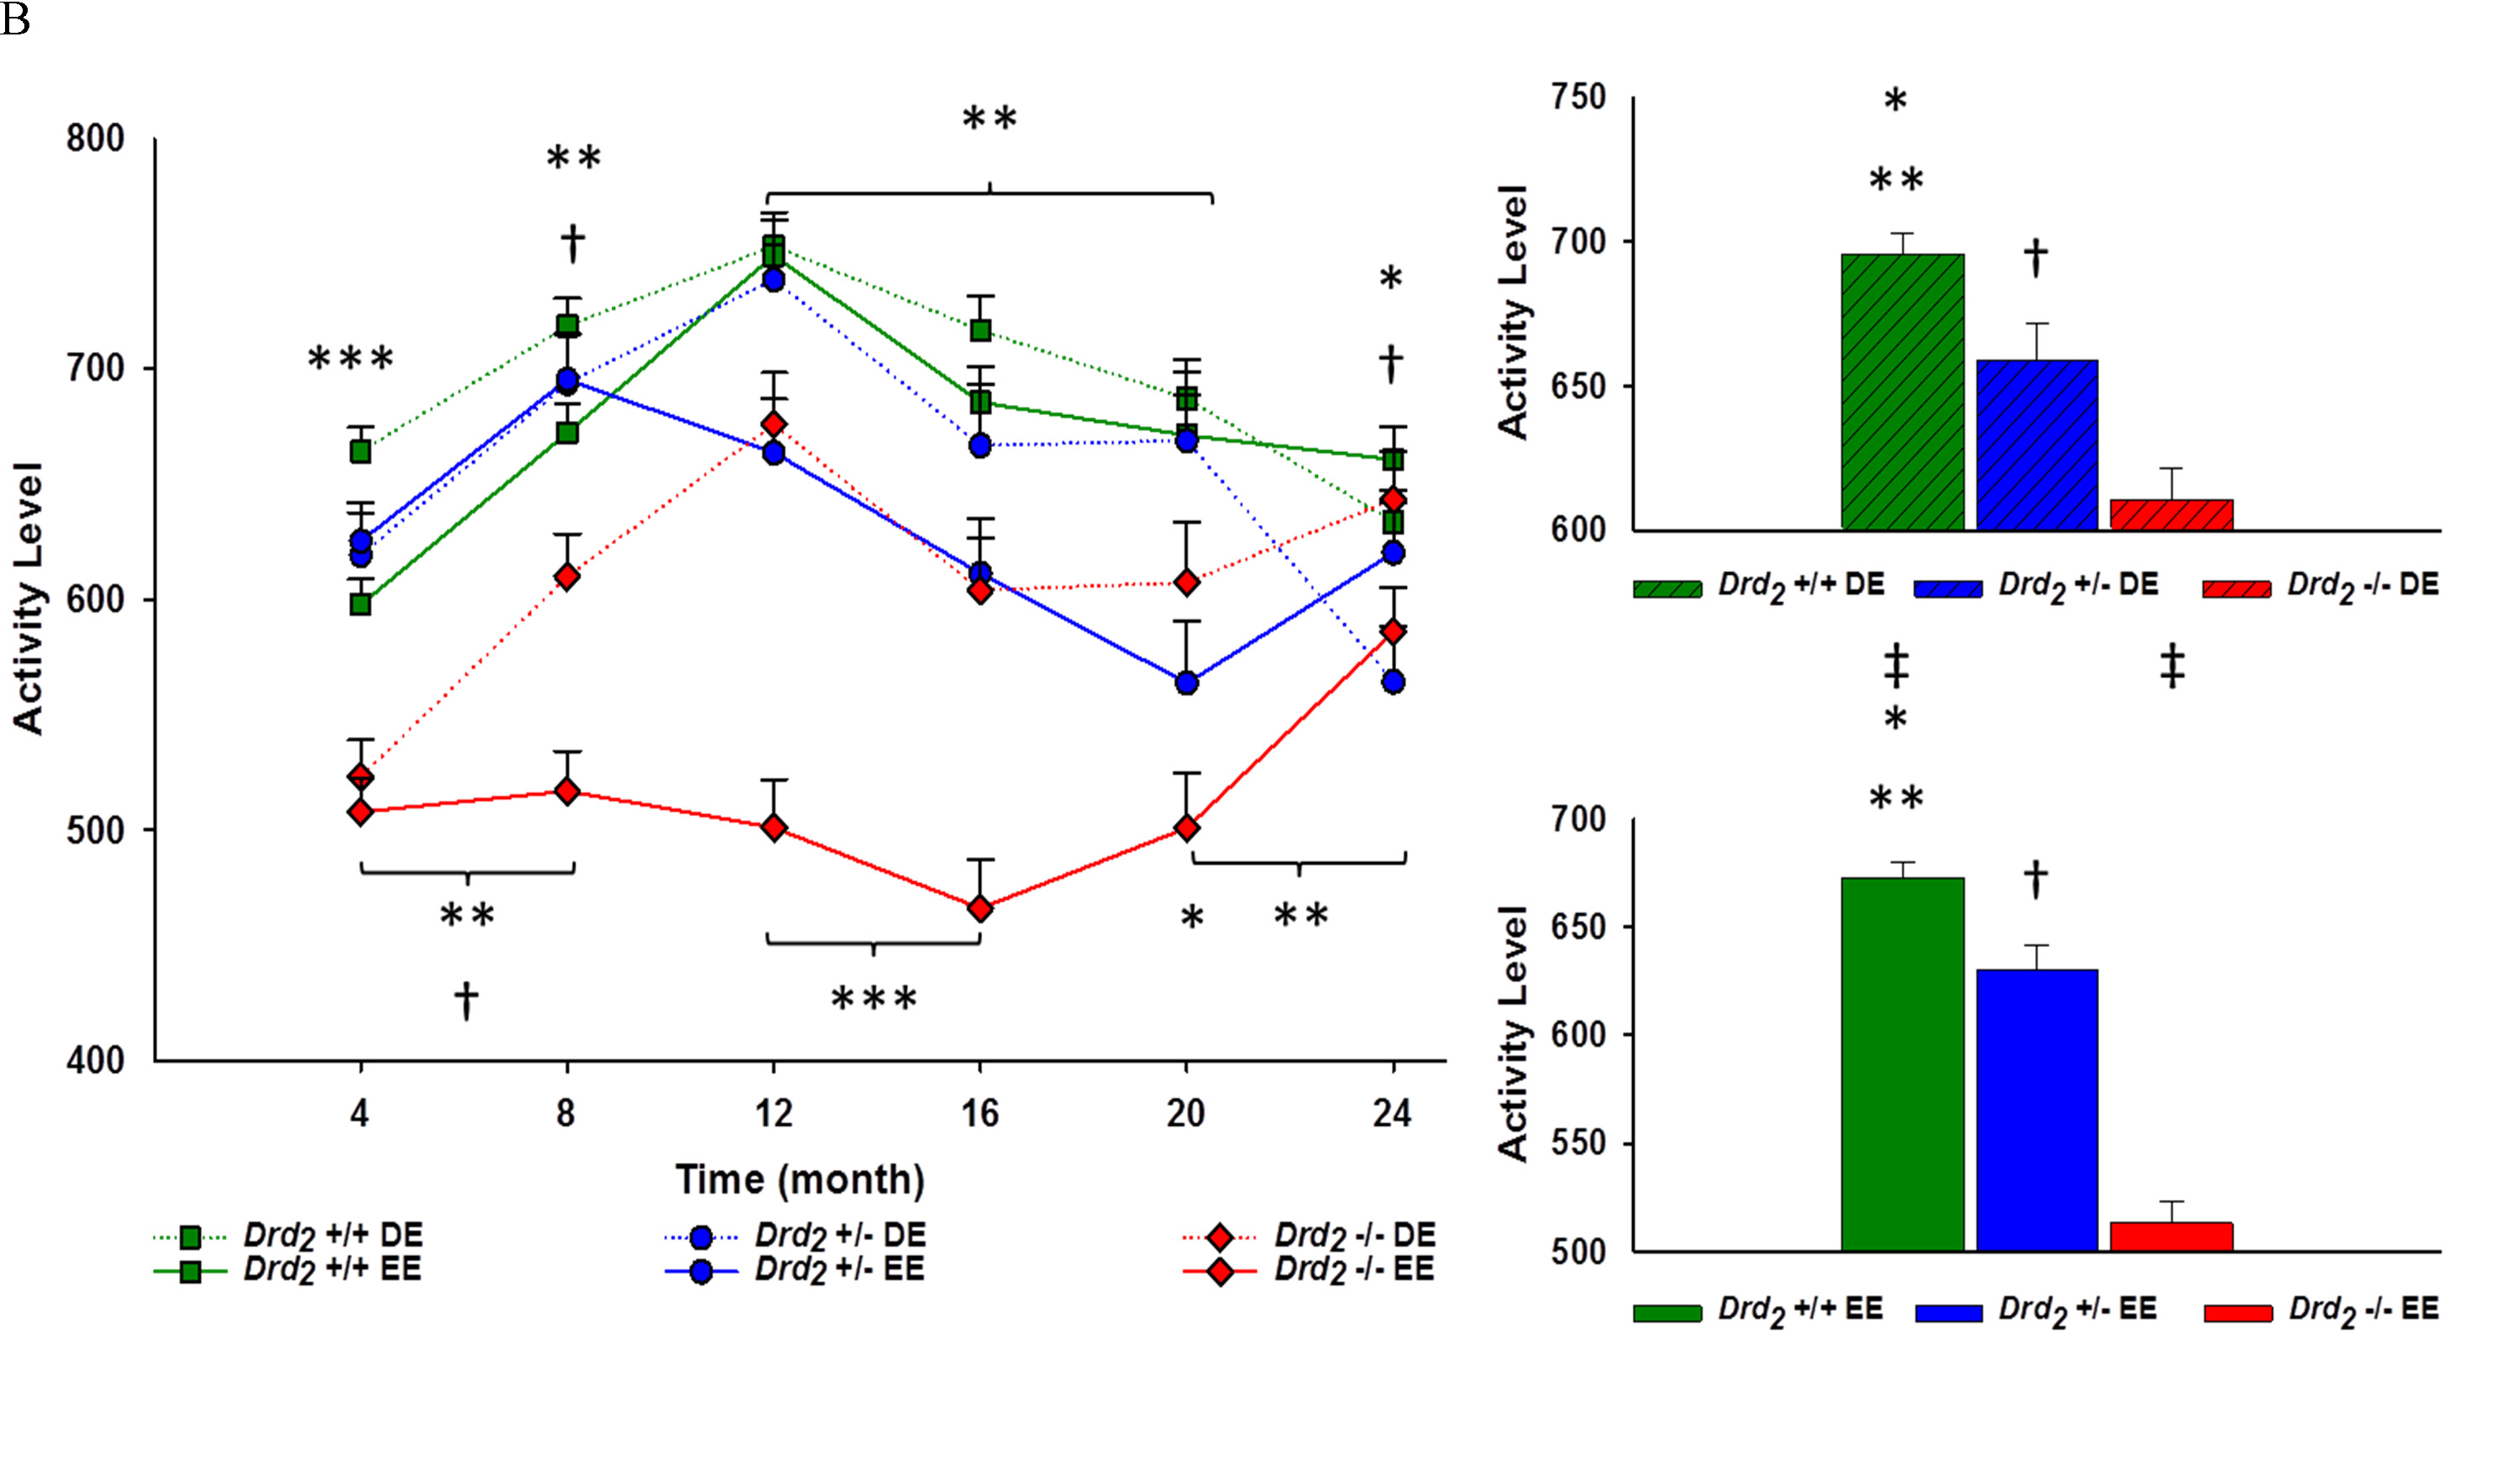
Figure 3: A. Main - Locomotor activity for genotype, collapsing environment, at 4 month intervals for 24 months. Genotype x time interaction showed hypoactivity among Drd2 -/- mice for all time points except Month 24, and Drd2 +/- compared to Drd2 +/+ following Month 12; *Drd2 +/+ vs. Drd2 +/- p < 0.01, **Drd2 +/+ vs. Drd2 -/- p < 0.0001, ***Drd2 +/+ vs. Drd2 +/- vs. Drd2 -/- p < 0.0001, †Drd2 +/- vs. Drd2 -/- p < 0.0001. Inset - Average locomotor activity for each genotype ± SEM. Overall locomotor activity for Drd2 +/+ were 6% greater than *Drd2 +/- and 18% greater than **Drd2 -/-. Overall activity for Drd2 +/- was also 13% greater than †Drd2 -/-; p < 0.0001 for all. B. Left - Interaction of genotype x environment over time at 4 month intervals for 24 months. Interaction of genotype x environment showed greater activity for Drd2 +/+ compared to Drd2 +/- DE mice at Month 4 and Month 24, and from Months 12 through 16 within the EE; *p < 0.05. Hypoactivity among Drd2 -/- lasted until Month 24 within the DE, and all time points within the EE compared to Drd2 +/+; **p < 0.05. Drd2 -/- had lower activity for both environments compared to Drd2 +/- and Month 4 and Month 8, and at Month 24 within the DE; ‡p < 0.05. Drd2 -/- EE remained hypoactive compared to Drd2 +/- EE up until Month 16; ‡p < 0.0001. Between environment, EE mice were hypoactive during Months 4 and 8 for Drd2 +/+ , Month 12 and Month 16 for Drd2 +/-, and after Month 4 for Drd2 -/-; p < 0.005 (not shown). Right - Average locomotor activity for DE (Top) and EE (Bottom) for each genotype x environment. Within DE mice, overall locomotor activity for Drd2 +/+ was 5% greater than Drd2 +/-; *p < 0.05, and 12% greater than Drd2 -/-; **p < 0.0001. Drd2 +/- were 7% more active overall compared to Drd2 -/-; †p < 0.01. Results were similar for EE mice, Drd2 +/+ were 6% more active overall than Drd2 +/-; *p < 0.01, and 24% more active overall compared to Drd2 -/-; **p < 0.0001. Drd2 +/- were 19% more active overall compared to †Drd2 -/-; p < 0.0001. Between environments, Drd2 +/+ DE mice were 3% more active; ‡p < 0.05, and Drd2 -/- DE mice were 16% more active; ‡p < 0.0001, than their respective EE counterparts. Locomotor activity between Drd2 +/- environments was not significant; p > 0.05.
Discussion
Lifespan/aging
Results supported the hypothesis and showed that the D2 gene along with environmental conditions combined to significantly influence lifespan, body weight, and locomotor activity. These data provide the first evidence of the role of D2R gene on lifespan in mammals (along with the mediating effects of environment) and are in agreement with very recent results by Landis et al in drosophila[39].
Mice with normal or reduced expression of the D2 gene and housed in an EE showed significant increases in lifespan. However, mice deficient in D2 failed to benefit from an EE. Similar increases in lifespan were also recently observed in D4 mice raised in an EE [40] . The D2 gene function appears to be a critical mediator linked to the behavior and lifespan effects associated with an EE. D2’s mediating role, however is environment-dependent and was not observed in mice raised in DE conditions.
Mice exposed to EE, experienced social interaction, cognitive stimulation (enrichment toys in the cage), and exercise (access to a running wheel). Earlier studies have demonstrated the mediating effects of exercise on lifespan. For example, it has been shown that rats who exercised starting from 1.5 months of age displayed significant increases in lifespan compared to sedentary rats; male rats allowed to exercise lived 19.3% longer than male controls and female rats allowed to exercise lived 11.5% longer than female controls [41]. Interestingly, Samorajski and colleagues showed that mice who began exercise treatment at a later stage of development - both continuously or intermittently until death - did not show these increases in lifespan [42]. Lifespan benefits associated with exercise appeared to be dependent upon the age at which the exercise treatment was introduced. Locomotor activity within the first 8 months of age can be seen as a predictive factor in lifespan (See Figure 4). It is therefore possible that the lifespan differences between environment groups observed here could be attributed to the effects of early and continuous exercise.
More recent studies on exercise have displayed it’s powerful health benefits, especially in relation to mitochondrial function which plays a critical role in many age-related neurodegenerative diseases [27, 43, 44]. The anti-aging and neuroprotective factors associated with exercise may be the key factor as to why Drd2 +/+ and Drd2 +/- EE mice showed increased lifespan in comparison to their DE cohorts. Interestingly, there is evidence for a powerful link between DA striatal function and longevity. This was made clear in an experiment showing the use of (-) deprenyl to counteract the age-related decline of nigrostriatal neurons [45]. Administration of either 0.25mg/kg of (-) deprenyl or saline solution was given three times a week to 2 year old rats; it was observed that (-) deprenyl-treated rats had an increased average lifespan of 197.98 ± 2.36 weeks compared to saline-treated rats with an average lifespan of 147.05 ± 0.56 weeks [45]. This is consistent with recent data in Drosophila showing that dopamine pathway genes including the D2 gene are candidate positive regulators of life span [39].
Body weight
D2R Deficiency has been highlighted as one of the many components involved in Reward Deficiency Syndrome (RDS) which is characterized by polymorphic variations of certain genes which precede RDS, causing aberrant DA transmission in the mesocroticolimbic pathway, producing a dysfunction in brain reward [46-50]. It’s possible that, given the strong connection between reward-seeking behavior and obesity [50, 51], an RDS-associated condition may underlie what is known as food addiction. Food addiction can be thought of as a manifestation of RDS, resulting in a self-compensatory mechanism for an imbalance of D2R expression within the striatum. The inability to adequately acquire the appropriate amount of reward from natural reinforcers may predispose an individual to obtain more than is necessary to reach satisfaction. This represents a non-homeostatic feeding mechanism where hedonic feeding acts as an overwhelming influence in achieving a sense of well-being and satisfaction (natural characteristics resulting from DA release). This is illustrative in the fact that Drd2 +/- DE mice have significantly higher body weights than Drd2 +/+ counterparts. The fact that this is not the case within an EE may indicate that there is an EE-associated protective factor which is attenuating the RDS impact on hedonic feeding in Drd2 +/- mice.
Hormones are known to act on the CNS and regulate energy balance and eating behavior. These data include, among others, the effects of leptin and insulin receptor expression within midbrain DA neurons of the SNc and VTA [52]. These areas represent potential targets for insulin and leptin to influence the DA-related motivational circuitry associated with feeding. Kim and colleagues have shown that Drd2 -/- mice have an increased sensitivity to leptin signaling, thus promoting reduced body weight and food intake [53]. This observation is seen in our data showing reduced weight in Drd2 -/- compared to Drd2 +/- and Drd2 +/+ mice, but only within an EE. Additional evidence shows that leptin is able to modulate D2R expression [54]. There appears to be an inverted-U shaped curve between D2R expression and body weight within the DE. Since the D2 receptor is involved in motivational and goal-oriented behaviors, it is possible that lacking the D2R entirely may not provide mice with the incentive to overeat and become at risk for obesity. Also, leptin signaling in midbrain DA regions may reduce the nonhomeostatic properties of food which could result in a diminished motivation to eat [55]. Even more, acute infusion of leptin into the lateral ventricle of male wistar rats has been shown to reduce extracellular DA release in the NAc following food intake [56]. It’s clear that there exists an intimate relationship between the D2R and leptin signaling; however this relationship remains far from completely understood especially with consideration to and interaction with environmental factors.
Opposite to the effects of leptin, the gastric hormone, ghrelin, alters homeostatic feeding behavior by stimulating hunger and food intake [57]. Ghrelin acts on the growth hormone secretagogue receptor (GHSR), which is known to be expressed in various locations including the hypothalamus, SNc, and VTA, and is implicated in the induction of feeding in both humans and rodents [58-60]. Recently, ghrelin has been shown to involve the DA system in the regulation of food intake and operant behavior. Evidence showing antagonism of D1, D2, and D3 receptors by pharmacological administration in Sprague-Dawley rats resulting in the prevention of hyperphagia from ghrelin illustrates how DA signaling is implication in food intake [61]. Also, administration of ghrelin into the VTA increased DA release in the NAc as well as locomotor activity [62]. Furthermore, it has been shown that ghrelin’s influence in the mesolimbic pathway may be a required component for the integration of environmental cues and responding to reward expectation, thus promoting an orexigenic drive [63]. The regulation of sensing and responding to environmental food cues through the function of the VTA could therefore be influenced directly by metabolic hormones. Ghrelin appears to exert some of its appetite-stimulating influences by directly modulating the mesolimbic pathway, thus promoting increased motivation to eat [64]. While the interaction between ghrelin and the DA system is still not fully understood it is possible that lifelong differences in D2R expression may play a key role in regulating ghrelin’s actions on feeding behavior.
Therefore these data suggest that environment can interact with D2R levels in producing effects on body weight; particularly within the EE. While Drd2 +/- mice had overall a greater body weight than Drd2 +/+ and Drd2 -/- mice, this was primarily seen within an EE. Diminished D2R expression and it’s correlation with higher body weight is consistent with obese humans data reporting a negative correlation with D2R expression [23]. A negative correlation has also been found between D2R expression and body weight in obese rats [65]. Since significant body weight differences among genotypes do not typically become apparent until the middle and late stages of lifespan, we could imply that alterations in metabolic signaling is associated with differences in D2R signaling and aging. The interaction between altered expression of the D2R and neuropeptides provides an explanation for lower body weight in Drd2 -/- mice within an EE, but not for the Drd2 -/- mice in a DE.
Locomotor activity
In support of previous studies, D2R expression played a critical role on locomotor activity [18, 66-68]. However, the interaction between D2R and locomotor activity and environmental influence is poorly understood. Here EE mice showed 8.5 % variability between the genotypes across time while DE mice showed 4.4% variability between genotypes across time in terms of activity. Environment-related changes in locomotor activity seen in the current study are supported by previous studies which also show hyperactivity within DE mice [69-71]. Developmental adaptations to the environment are thought to involve exploratory mechanisms. D1 receptor activation and the subsequent release of acetylcholine in the PFC has been shown to play an important role in spontaneous motor output and exploratory behavior [72, 73]. There is evidence that the effects of prefrontal D1 stimulation and acetylcholine release are modified in rats reared in an EE [72]. An EE appears to reduce D1 function within the PFC and reduce acetylcholine release in response to stress, contributing to reductions in spontaneous motor activity, and that that rodents reared in enriched settings were more efficient explorers and habituated to novel environments faster [74]. The hyperactivity seen in the DE mice may be due to inefficient exploration of the testing field. Interestingly, Drd2 -/- EE mice show a major reduction in locomotor activity compared to the Drd2 -/- DE mice. This finding suggests that the proposed model for EE-induced hypoactivity appears to hold true for mice deficient in D2R. Thus, it is plausible to assume that alterations in D1 function within the PFC occur in the absence of D2R.
Environment
Environmental conditions modify brain plasticity and induce changes on a cellular, molecular and behavioral level [75]. In order to understand the behavioral changes produced by an environment, it is necessary to look at the underlying neural mechanisms. Most interesting is the effect an environment has on the DA system. It has been established that novel and stressful stimuli within the environment can induce DA release within the PFC (possibly acting as a coping mechanism) via activation of VTA neurons [76-78]. It was further shown that stress-induced DA release in the PFC decreases with age [79, 80]. Additionally, it has been shown that the function of VTA DA neurons that project to the PFC are altered in rodents exposed to an EE; namely, stress-induced release of DA in the PFC was reduced in rats raised in an EE [81]. This is probably the result of a reduced perception of stress from the anxiolytic effects of an EE; in other words, an EE protects rodents so that they deal with future stressors more positively. Interestingly, previous reports have shown longevity to be correlated with stress reactivity to environmental factors between different strains of rats; namely, rats who were more behaviorally reactive to stress had a shorter lifespan. Since stressed rats showed earlier degeneration in dopaminergic pathways, it’s thought that the shortened lifespan might be the result of a failure to adapt to environmental challenges leading to reduced compensatory adjustments in surviving neurons [82]. Although the current study did not directly compare reactivity to stress between environments, it is hypothesized that this model of environment-dependent behavioral stress reactivity may play a role in the longer lifespans of Drd2 +/+ and Drd2 +/- mice in an EE.
Lastly, it has been postulated that an EE may have protective effects against mitochondrial dysfunction. Exercise in particular has received much attention given its widespread health benefits and neuroprotective role in modulating reactive oxygen species (ROS). In accompaniment of aging, mitochondrial dysfunction is a critical mechanism known to occur which can leave an organism vulnerable to neurodegenerative diseases [83]. Exercise appears to be an ROS modulator via neurotrophins such as BDNF. Since BDNF is critical to the support and maintenance of neuronal populations, thus promoting healthy cognitive abilities, it is suggested that exercise can be protective in attenuating age-related cellular damage in diseases like Alzheimer’s and Parkinson’s disease [84]. The ability of sustained exercise to promote neuroplasticity combined with the anxiolytic effects of social interaction and environment enrichment setting, do promote the survival and healthy function of mice. The current findings support that D2R plays an important role and interacts with an enriched environment (that includes exercise) to promote lifespan.
Limitations
The study of environmental enrichment is a complex phenomenon that can include multiple components such as type of enrichment stimuli (number of stimuli, novelty of stimuli), type of social interaction (play behavior, aggression, sexual behavior, social hierarchy), and exercise (forced versus voluntary). While many studies have characterized the individual contributions of each enrichment form, few, if any, have done so under the expressive differences of the D2R gene in rodents. Due to the fact that we are unable to distinguish between the individual component contributions of our designed enriched environment, we cannot determine which component is having a particular effect on the mice. It has yet to be established how these components operate in relation to D2R expression, thus further experimentation would be necessary in evaluating our enrichment components separately. Additionally, deleting a gene (as with our Drd2 -/- mice) may result in compensatory changes in other neurochemical signaling pathways. These developmental adaptations may produce alternative behavioral characteristics which might be unaccounted for [66].
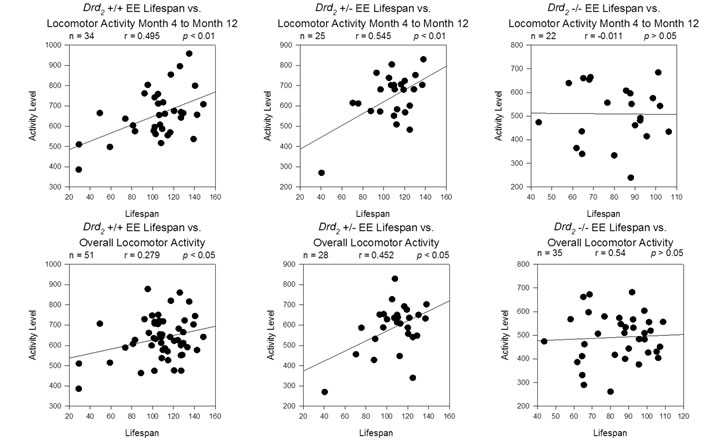
Figure 4: Top Row - Correlation of lifespan and average locomotor activity for Months 4 through 12 for Drd2 +/+ EE (Top Left), Drd2 +/- EE (Top Center) and Drd2 -/- EE mice (Top Right). A moderate and significant correlation was found for average locomotor activity in the first 8 months vs. lifespan for Drd2 +/+ EE (r = 0.495; p < 0.01) and Drd2 +/- EE (r = 0.545; p < 0.01), but not Drd2 -/- EE (p > 0.05). Bottom Row - Correlation of lifespan and overall average locomotor activity for the same groups produced similar results.
Conclusions
The dichotomy over genes versus environment has provided a rigorous and long debate in deciphering individual differences in longevity. In truth, there exists a complex interaction among the two which contribute to such individual differences observed. In describing the significant contributions on longevity, a recent paper has demonstrated that the Drd4 gene plays a critical role in modulating longevity within an EE [40]. The D4R, which is part of the same family of receptors as the D2R, appears to mediate lifespan similarly to D2R. While further research is needed into the specific environmental conditions, families of genetic polymorphisms and epigenetic mechanisms; these results provide the first evidence of D2R gene-environment interaction playing an important role in longevity and aging.
materials and Methods
Animals
Male and female D2 transgenic mice (breeding pairs were obtained from David Grandy of Oregon Health Sciences University, and bred as previously described [85, 86]), were split into 3 groups: mice that had either normal expression of the D2 receptor (Drd2 +/+), half of the levels of expression of the D2 receptor (Drd2 +/-), and mice that were deficient of the D2 receptor (Drd2-/-). These mice were placed in either an EE or a DE. The EE mice were group housed in a large cage (27 x 48 x 15 cm) with access to an igloo-shaped plastic container with a running wheel attachment and exploratory tunnels (Bio-Serv; Frenchtown, New Jersey, USA). The DE mice were single housed in a standard plastic cage (19 x 29 x 12 cm) without access to these enrichment objects. Mice from both environments were given bedding squares (Ancare; Bellmore, New York, USA). All mice were placed on an inverse 12 hour light cycle beginning at 0600 hours, with food and water given ad libitum. All experiments were approved by and conducted in compliance with Institutional Animal Care and Use Committee (IACUC).
Lifespan
Daily health inspections were made to assess the health of the mice based on the use of a Body Condition Scoring (BCS) approach [87], where mice weights, spontaneous mobility, and the presence and treatments for any skin lesions associated with aging were present. Mice that were determined to be reaching their endpoint or in poor health were deeply anesthetized with 3% isofluorane followed by cervical dislocation and head decapitation; their brains were collected for future analysis.
Body weight
Body weight measurements were taken in the middle of their dark cycle and conducted on a weekly basis. Body weight was binned into bi-monthly intervals starting at 16 weeks of age, and analyzed at 4 month intervals beginning at month 4 and ending on month 24.
Locomotor activity
Locomotor activity was measured bi-monthly by placing the mice in an optical sensor acrylic arena (measuring 26.67 x 48.26 x 15.24 cm) for one hour. Data was collected for analysis by VitalView software (Minimitter Corporation, Oregon, USA) and was binned into 4-month intervals beginning at month 4 and ending on month 24.
Analysis
Statistical analysis was performed using multiple repeated measures ANOVAs and ANCOVAs with SPSS software. Post hoc analyses were done using Fisher’s LSD with significance level of 5% [α= 0.05].
ACKNOWLEDGMENTS
We thank Dr. David Grandy for originally providing the breeder pairs for our colony as well as Diana Shustarovich, John Pagiazitis and Jeffrey Barnett for assistance with the care of the mouse colony.
Conflicts of interest
The authors have no conflicts of interests to declare.
This work was supported by the Research Foundation of NY (RIAQ094) and NIH (AA 11034).
References
1. Blum K, Noble EP, Sheridan PJ, Montgomery A, Ritchie T, Jagadeeswaran P, Nogami H, Briggs AH and Cohn JB. Allelic association of human dopamine D2 receptor gene in alcoholism. Jama. 1990; 263:2055-2060.
2. Dackis CA and Gold MS. New concepts in cocaine addiction: The dopamine depletion hypothesis. Neuroscience & Biobehavioral Reviews. 1985; 9:469-477.
3. Jaber M, Robinson SW, Missale C and Caron MG. Dopamine receptors and brain function. Neuropharmacology. 1996; 35:1503-1519.
4. Anzalone A, Lizardi-Ortiz JE, Ramos M, De Mei C, Hopf FW, Iaccarino C, Halbout B, Jacobsen J, Kinoshita C, Welter M, Caron MG, Bonci A, Sulzer D and Borrelli E. Dual Control of Dopamine Synthesis and Release by Presynaptic and Postsynaptic Dopamine D2 Receptors. The Journal of Neuroscience. 2012; 32:9023-9034.
5. Volkow ND, Logan J, Fowler JS, Wang GJ, Gur RC, Wong C, Felder C, Gatley SJ, Ding YS, Hitzemann R and Pappas N. Association between age-related decline in brain dopamine activity and impairment in frontal and cingulate metabolism. Am J Psychiatry. 2000; 157:75-80.
6. Rieckmann A, Karlsson S, Karlsson P, Brehmer Y, Fischer H, Farde L, Nyberg L and Bäckman L. Dopamine D1 Receptor Associations within and between Dopaminergic Pathways in Younger and Elderly Adults: Links to Cognitive Performance. Cerebral Cortex. 2011; 21:2023-2032.
7. Roth GS and Joseph JA. Cellular and molecular mechanisms of impaired dopaminergic function during aging. Annals of the New York Academy of Sciences. 1994; 719:129-135.
8. Shinkai T, Zhang L, Mathias SA and Roth GS. Dopamine induces apoptosis in cultured rat striatal neurons; possible mechanism of D2-dopamine receptor neuron loss during aging. Journal of Neuroscience Research. 1997; 47:393-399.
9. Volkow ND, Gur RC, Wang GJ, Fowler JS, Moberg PJ, Ding YS, Hitzemann R, Smith G and Logan J. Association between decline in brain dopamine activity with age and cognitive and motor impairment in healthy individuals. Am J Psychiatry. 1998; 155:344-349.
10. Cruz-Muros I. Aging of the rat mesostriatal system: differences between the nigrostriatal and the mesolimbic compartments. Experimental Neurology. 2007; 204:147-161.
11. Fetsko LA, Xu R and Wang Y. Effects of age and dopamine D2L receptor-deficiency on motor and learning functions. Neurobiology of Aging. 2005; 26:521-530.
12. Hu Z, Cooper M, Crockett DP and Zhou R. Differentiation of the midbrain dopaminergic pathways during mouse development. J Comp Neurol. 2004; 476:301-311.
13. Wise RA. Dopamine, learning and motivation. Nat Rev Neurosci. 2004; 5:483-494.
14. Allen E, Carlson KM, Zigmond MJ and Cavanaugh JE. L-DOPA reverses motor deficits associated with normal aging in mice. Neuroscience Letters. 2011; 489:1-4.
15. de la Fuente-Fernández R. Age-specific progression of nigrostriatal dysfunction in Parkinson’s disease. Ann Neurol. 2011; 69:803-810.
16. Darbin O. The aging striatal dopamine function. Parkinsonism & Related Disorders. 2012; 18:426-432.
17. Wu T, Wang J, Wang C, Hallett M, Zang Y, Wu X and Chan P. Basal ganglia circuits changes in Parkinson’s disease patients. Neuroscience Letters. 2012; 524:55-59.
18. Baik JH, Picetti R, Saiardi A, Thiriet G, Dierich A, Depaulis A, Le Meur M and Borrelli E. Parkinsonian-like locomotor impairment in mice lacking dopamine D2 receptors. Nature. 1995; 377:424-428.
19. Medvedev IO, Ramsey AJ, Masoud ST, Bermejo MK, Urs N, Sotnikova TD, Beaulieu JM, Gainetdinov RR and Salahpour A. D1 dopamine receptor coupling to PLCbeta regulates forward locomotion in mice. The Journal of neuroscience. 2013; 33:18125-18133.
20. Wang GJ, Volkow ND, Thanos PK and Fowler JS. Imaging of Brain Dopamine Pathways: Implications for Understanding Obesity. J Addict Med. 2009; 3:8-18.
21. Marco A, Schroeder M and Weller A. Feeding and reward: Ontogenetic changes in an animal model of obesity. Neuropharmacology. 2012; 62:2447-2454.
22. Geiger BM, Behr GG, Frank LE, Caldera-Siu AD, Beinfeld MC, Kokkotou EG and Pothos EN. Evidence for defective mesolimbic dopamine exocytosis in obesity-prone rats. Faseb J. 2008; 222740-2746.
23. Wang G-J, Volkow ND, Logan J, Pappas NR, Wong CT, Zhu W, Netusll N and Fowler JS. Brain dopamine and obesity. The Lancet. 2001; 357:354-357.
24. Volkow ND, Wang GJ, Telang F, Fowler J, Thanos PK, Logan J, Alexoff D, Ding YS and Wong C. Low Dopamine Striatal D2 Receptors are Associated with Prefrontal Metabolism in Obese Subjects: Possible Contributing Factors. Neuroimage. 2008 ;42:1537-43.
25. Johnson PM and Kenny PJ. Dopamine D2 receptors in addiction-like reward dysfunction and compulsive eating in obese rats. Nat Neurosci. 2010; 13:635-641.
26. Sztainberg Y and Chen A. An environmental enrichment model for mice. Nat Protocols. 2010; 5:1535-1539.
27. Cotman CW and Engesser-Cesar C. Exercise Enhances and Protects Brain Function. Exercise and Sport Sciences Reviews. 2002; 30:75-79.
28. Berchtold NC, Castello N and Cotman CW. Exercise and time-dependent benefits to learning and memory. Neuroscience. 2010; 167:588-597.
29. Vivar C, Potter MC and Praag H. All About Running: Synaptic Plasticity, Growth Factors and Adult Hippocampal Neurogenesis. Curr Top Behav Neurosci. 2013;15:189-210.
30. Kempermann G, Kuhn HG and Gage FH. More hippocampal neurons in adult mice living in an enriched environment. Nature. 1997; 386:493-495.
31. Vukovic J, Colditz MJ, Blackmore DG, Ruitenberg MJ and Bartlett PF. Microglia Modulate Hippocampal Neural Precursor Activity in Response to Exercise and Aging. The Journal of Neuroscience. 2012; 32:6435-6443.
32. Segovia G, Arco A and Mora F. Environmental enrichment, prefrontal cortex, stress, and aging of the brain. Journal of Neural Transmission. 2009; 116:1007-1016.
33. van Praag H, Kempermann G and Gage FH. Neural consequences of enviromental enrichment. Nat Rev Neurosci. 2000; 1:191-198.
34. Mustroph ML, Chen S, Desai SC, Cay EB, DeYoung EK and Rhodes JS. Aerobic exercise is the critical variable in an enriched environment that increases hippocampal neurogenesis and water maze learning in male C57BL/6J mice. Neuroscience. 2012; 219:62-71.
35. Anderson BJ, Greenwood SJ and McCloskey DP. Exercise as an intervention for the age-related decline in brain metabolic support. Frontiers in Aging Neuroscience. 2010; 2;pii: 30.
36. Papenberg G, Backman L, Nagel IE, Nietfeld W, Schroder J, Bertram L, Heekeren HR, Lindenberger U and Li SC. Dopaminergic gene polymorphisms affect long-term forgetting in old age: further support for the magnification hypothesis. Journal of cognitive neuroscience. 2013; 25:571-579.
37. Nagel IE, Chicherio C, Li SC, von Oertzen T, Sander T, Villringer A, Heekeren HR, Backman L and Lindenberger U. Human aging magnifies genetic effects on executive functioning and working memory. Frontiers in human neuroscience. 2008; 2:1.
38. Markett S, Montag C, Walter NT, Plieger T and Reuter M. On the molecular genetics of flexibility: the case of task-switching, inhibitory control and genetic variants. Cognitive, affective & behavioral neuroscience. 2011; 11:644-651.
39. Landis GN, Salomon MP, Keroles D, Brookes N, Sekimura T and Tower J. The progesterone antagonist mifepristone/RU486 blocks the negative effect on life span caused by mating in female Drosophila. Aging (Albany, NY). 2015; 7:53-69. doi: 10.18632/aging.100721.
40. Grady DL, Thanos PK, Corrada MM, Barnett JC, Jr., Ciobanu V, Shustarovich D, Napoli A, Moyzis AG, Grandy D, Rubinstein M, Wang GJ, Kawas CH, Chen C, Dong Q, Wang E, Volkow ND, et al. DRD4 genotype predicts longevity in mouse and human. J Neurosci. 2013; 33:286-291.
41. Goodrick CL. Effects of Long-Term Voluntary Wheel Exercise on Male and Female Wistar Rats. Gerontology. 1980; 26:22-33.
42. Samorajski, C Delaney, L Durham, JM Ordy, JA Johnson and Dunlap W. Effect of exercise on longevity, body weight, locomotor performance, and passive-avoidance memory of C57BL/6J mice. Neurobiology of Aging. 1985; 6:17-24.
43. Corbi G, Conti V, Russomanno G, Rengo G, Vitulli P, Ciccarelli AL, Filippelli A and Ferrara N. Is Physical Activity Able to Modify Oxidative Damage in Cardiovascular Aging? Oxidative Medicine and Cellular Longevity. 2012; 2012:6.
44. Gremeaux V. Exercise and longevity. Maturitas. 2012; 73:312-317.
45. Knoll J. The striatal dopamine dependency of life span in male rats. Longevity study with (-)deprenyl. Mechanisms of ageing and development. 1988; 46:237-262.
46. Blum K, Liu Y, Shriner R and Gold MS. Reward circuitry dopaminergic activation regulates food and drug craving behavior. Current pharmaceutical design. 2011; 17:1158-1167.
47. Blum K, Sheridan PJ, Wood RC, Braverman ER, Chen TJ, Cull JG and Comings DE. The D2 dopamine receptor gene as a determinant of reward deficiency syndrome. Journal of the Royal Society of Medicine. 1996; 89:396-400.
48. Blum K, Thanos PK, Badgaiyan RD, Febo M, Oscar-Berman M, Fratantonio J, Demotrovics Z and Gold MS. Neurogenetics and gene therapy for reward deficiency syndrome: are we going to the Promised Land? Expert opinion on biological therapy. 2015; 15:973-985.
49. Blum K, Febo M, Thanos PK, Baron D, Fratantonio J and Gold M. Clinically Combating Reward Deficiency Syndrome (RDS) with Dopamine Agonist Therapy as a Paradigm Shift: Dopamine for Dinner? Molecular neurobiology. 2015; 52:1862-1869.
50. Blum K, Thanos PK and Gold MS. Dopamine and glucose, obesity, and reward deficiency syndrome. Frontiers in psychology. 2014; 5:919.
51. Tomasi D and Volkow ND. Striatocortical pathway dysfunction in addiction and obesity: differences and similarities. Critical reviews in biochemistry and molecular biology. 2013; 48:1-19.
52. Figlewicz DP, Evans SB, Murphy J, Hoen M and Baskin DG. Expression of receptors for insulin and leptin in the ventral tegmental area/substantia nigra (VTA/SN) of the rat. Brain Res. 2003; 964:107-115.
53. Kim KS, Yoon YR, Lee HJ, Yoon S, Kim S-Y, Shin SW, An JJ, Kim M-S, Choi S-Y, Sun W and Baik J-H. Enhanced Hypothalamic Leptin Signaling in Mice Lacking Dopamine D2 Receptors. Journal of Biological Chemistry. 2010; 285:8905-8917.
54. Pfaffly J, Michaelides M, Wang G-J, Pessin JE, Volkow ND and Thanos PK. Leptin increases striatal dopamine D2 receptor binding in leptin-deficient obese (ob/ob) mice. Synapse. 2010; 64:503-510.
55. Davis JF, Choi DL, Schurdak JD, Fitzgerald MF, Clegg DJ, Lipton JW, Figlewicz DP and Benoit SC. Leptin Regulates Energy Balance and Motivation Through Action at Distinct Neural Circuits. Biological Psychiatry. 2011; 69:668-674.
56. Krügel U, Schraft T, Kittner H, Kiess W and Illes P. Basal and feeding-evoked dopamine release in the rat nucleus accumbens is depressed by leptin. European Journal of Pharmacology. 2003; 482:185-187.
57. Suzuki K, Jayasena CN and Bloom SR. Obesity and Appetite Control. Experimental diabetes research. 2012; 2012:19.
58. Currie PJ. Ghrelin is an orexigenic and metabolic signaling peptide in the arcuate and paraventricular nuclei. American journal of physiology Regulatory, integrative and comparative physiology. 2005; 289:R353-R358.
59. Druce MR, Wren AM, Park AJ, Milton JE, Patterson M, Frost G, Ghatei MA, Small C and Bloom SR. Ghrelin increases food intake in obese as well as lean subjects. Int J Obes Relat Metab Disord. 2005; 29:1130-1136.
60. Zigman JM, Jones JE, Lee CE, Saper CB and Elmquist JK. Expression of ghrelin receptor mRNA in the rat and the mouse brain. The Journal of comparative neurology. 2006; 494:528-548.
61. Romero-Pico A, Novelle MG, Folgueira C, Lopez M, Nogueiras R and Dieguez C. Central manipulation of dopamine receptors attenuates the orexigenic action of ghrelin. Psychopharmacology. 2013; 229:275-283.
62. Jerlhag E. Ghrelin administration into tegmental areas stimulates locomotor activity and increases extracellular concentration of dopamine in the nucleus accumbens. Addiction Biology. 2007; 12:6-16.
63. Skibicka KP. Ghrelin directly targets the ventral tegmental area to increase food motivation. Neuroscience. 2011; 180:129-137.
64. van Zessen R. Contribution of the mesolimbic dopamine system in mediating the effects of leptin and ghrelin on feeding. Proceedings of the Nutrition Society. 2012; 71:435-445.
65. Thanos PK, Michaelides M, Piyis YK, Wang G-J and Volkow ND. Food restriction markedly increases dopamine D2 receptor (D2R) in a rat model of obesity as assessed with in-vivo μPET imaging ([11C] raclopride) and in-vitro ([3H] spiperone) autoradiography. Synapse. 2008; 62:50-61.
66. Kelly MA, Rubinstein M, Phillips TJ, Lessov CN, Burkhart-Kasch S, Zhang G, Bunzow JR, Fang Y, Gerhardt GA, Grandy DK and Low MJ. Locomotor activity in D2 dopamine receptor-deficient mice is determined by gene dosage, genetic background, and developmental adaptations. J Neurosci. 1998; 18:3470-3479.
67. Fowler SC, Zarcone TJ, Vorontsova E and Chen R. Motor and associative deficits in D2 dopamine receptor knockout mice. Int J Dev Neurosci. 2002; 20:309-321.
68. Klinker F. Pharmacological blockade and genetic absence of the dopamine D2 receptor specifically modulate voluntary locomotor activity in mice. Behav Brain Res. 2013; 242:117-124.
69. Heidbreder CA, Weiss IC, Domeney AM, Pryce C, Homberg J, Hedou G, Feldon J, Moran MC and Nelson P. Behavioral, neurochemical and endocrinological characterization of the early social isolation syndrome. Neuroscience. 2000; 100:749-768.
70. Varty GB, Paulus MP, Braff DL and Geyer MA. Environmental enrichment and isolation rearing in the rat: effects on locomotor behavior and startle response plasticity. Biological Psychiatry. 2000; 47:864-873.
71. Fabricius K. Increased dopaminergic activity in socially isolated rats: an electrophysiological study. Neuroscience Letters. 2010; 482:117-122.
72. Del Arco A, Segovia G, Canales JJ, Garrido P, de Blas M, García-Verdugo JM and Mora F. Environmental enrichment reduces the function of D1 dopamine receptors in the prefrontal cortex of the rat. Journal of Neural Transmission. 2007; 114:43-48.
73. Segovia G, Del Arco A, Garrido P, de Blas M and Mora F. Environmental enrichment reduces the response to stress of the cholinergic system in the prefrontal cortex during aging. Neurochem Int. 2008; 52:1198-1203.
74. Zimmermann A, Stauffacher M, Langhans W and Würbel H. Enrichment-dependent differences in novelty exploration in rats can be explained by habituation. Behav Brain Res. 2001; 121:11-20.
75. Mora F, Segovia G and del Arco A. Aging, plasticity and environmental enrichment: Structural changes and neurotransmitter dynamics in several areas of the brain. Brain Research Reviews. 2007; 55:78-88.
76. Roth RH, Tam S-Y, Ida Y, Yang J-X and Deutch AY. Stress and the Mesocorticolimbic Dopamine Systemsa. Annals of the New York Academy of Sciences. 1988; 537:138-147.
77. Feenstra MGP and Botterblom MHA. Rapid sampling of extracellular dopamine in the rat prefrontal cortex during food consumption, handling and exposure to novelty. Brain Res. 1996; 742:17-24.
78. Tidey JW and Miczek KA. Social defeat stress selectively alters mesocorticolimbic dopamine release: an in vivo microdialysis study. Brain Res. 1996; 721:140-149.
79. Thierry AM, Tassin JP, Blanc G and Glowinski J. Selective activation of the mesocortical DA system by stress. Nature. 1976; 263:242-244.
80. Del Arco A. Dopamine release during stress in the prefrontal cortex of the rat decreases with age. Neuroreport. 2001; 12:4019-4022.
81. Segovia G, Del Arco A, de Blas M, Garrido P and Mora F. Effects of an enriched environment on the release of dopamine in the prefrontal cortex produced by stress and on working memory during aging in the awake rat. Behav Brain Res. 2008; 187:304-311.
82. Gilad GM, Rabey J, Tizabi Y and Gilad VH. Age-dependent loss and compensatory changes of septohippocampal cholinergic neurons in two rat strains differing in longevity and response to stress. Brain Res. 1987; 436:311-322.
83. Moreira PI, Zhu X, Wang X, Lee H-g, Nunomura A, Petersen RB, Perry G and Smith MA. Mitochondria: A therapeutic target in neurodegeneration. Biochimica et Biophysica Acta (BBA) - Molecular Basis of Disease. 2010; 1802:212-220.
84. Vaynman S. License to run: exercise impacts functional plasticity in the intact and injured central nervous system by using neurotrophins. Neurorehabilitation and neural repair. 2005; 19:283-295.
85. Delis F, Thanos PK, Rombola C, Rosko L, Grandy D, Wang G-J and Volkow ND. Chronic mild stress increases alcohol intake in mice with low dopamine D2 receptor levels. Behavioral Neuroscience. 2013; 127:95-105.
86. Delis F, Benveniste H, Xenos M, Grandy D, Wang G-J, Volkow ND and Thanos PK. Loss of Dopamine D2 Receptors Induces Atrophy in the Temporal and Parietal Cortices and the Caudal Thalamus of Ethanol-Consuming Mice. Alcoholism: Clinical and Experimental Research. 2012; 36:815-825.
87. Ullman-Culleré and Foltz. Body Condition Scoring: A Rapid and Accurate Method for Assessing Health Status in Mice. Laboratory Animal Science. 1999; 49;319-23.