
INTRODUCTION
Although single nucleotide polymorphisms (SNPs) are potential predicting biomarkers of cancer risk, they have limited use for multistage complex diseases involving multiple genes [1–3]. Several studies have reported that gene–gene interactions are more important than single genes in promoting cancer susceptibility [3–5]. For example, polymorphisms that individually have a weak effect can have a strong effect when acting together [6]. Similarly, in epistasis, which is a phenomenon that consists of the effect of complex interactions, is greater than the main effects of any single susceptibility gene [5, 7].
MiRNAs bind to the 3′-untranslated regions of coding genes to suppress or downregulate gene expression. Translational regulation is performed by a network of miRNAs and target genes such that one miRNA can regulate multiple different genes, or one target gene can be regulated by several miRNAs [8]. In recent years, several studies have simultaneously screened miRNA SNPs and target gene SNPs, and interactions between specific pairs to promote carcinogenic effect have been identified [9].
We previously screened miRNAs targeting a single gene, and identified three different miRNA polymorphisms (pri-let-7e rs8111742, pri-miR-365b rs121224 and pri-miR-4795 rs1002765) that had no or only weak effects on gastric cancer (GC) and atrophic gastritis (AG) risk (unpublished data). However, these three miRNA SNPs were all located in the promoter region of miRNA genes (rs8111742 at −565 bp of the let-7e gene, rs121224 at −430 bp of the miR-365b gene, and rs1002765 at −1635 bp of the miR-4795 gene), suggesting that they may be functional polymorphisms. All miRNAs were predicted to stimulate/inhibit pepsinogen C (PGC) gene, which is expressed by terminally differentiated gastric mucosa cells. PGC is a diagnostic biomarker for GC and AG (precancerous disease) [10]. Our colleagues investigated the association between each of the seven PGC SNPs and GC and/or AG, and found that five PGC SNPs were linked to GC or AG risk, while two (PGC rs6912200 and rs6941539) had no significant association with cancer risk [11, 12]. We therefore hypothesized that the former may be optimal candidates for investigating potential SNP–SNP interactions for miRNA SNPs-PGC SNPs at two or more genetic loci. It was unclear whether there were interactions among these SNPs and whether detecting combinations of them could enhance the risk prediction for GC or AG.
Gastric carcinogenesis may occur via a network of molecular changes caused by both environmental and hereditary factors. Helicobacter pylori is the most important environmental factor; H. pylori infection can cause AG, intestinal metaplasia, or GC, and also has a non-negligible interaction with hereditary factors to increase host susceptibility [12]. H. pylori infection might promote the progression from normal gastric mucosa to AG, and to GC. Thus, there may be a three-way interaction between specific miRNA and target gene SNPs and H. pylori infection. Identifying such an interaction may provide a reliable predicting biomarker for gastric cancer development [14], and may could help to comprehend how miRNA, target gene and H. pylori infection together regulate gastric carcinogenesis.
This study was based on previous a case–control study in a Chinese population (unpublished data) and investigated two- and three-dimensional interactions between miRNA SNPs, SNPs in its predicted target gene PGC, and H. pylori infection status. It may identify combination biomarkers for early GC.
RESULTS
Demographic and geographic characteristics
The demographic and geographic characteristics of study participants are shown in Supplementary Table S1 (including age, sex, and H. pylori infection status). There was no significant difference in the age and sex distribution among the GC, AG, and control groups.
Relationship between single SNPs and GC/AG risk
We previously investigated associations of three miRNA polymorphisms with seven PGC polymorphisms affecting the risk of GC and AG in a Chinese population (unpublished data). We found no significant association of let-7e rs8111742, miR-365b rs121224, and miR-4795 rs1002765 with GC and/or AG risk (P > 0.05). The PGC rs4711690 CG+CC genotype, rs6458238 GA+AA genotype, and rs3789210 CG+GG genotype were associated with a decreased AG risk (P = 0.008, OR = 0.78; P = 0.015, OR = 0.73; and P = 0.048, OR = 0.78, respectively). The PGC rs6939861 AG+AA genotype was linked to an increased risk of GC and AG (GC risk P = 0.015, OR = 1.32; AG risk P = 0.014, OR = 1.30). Furthermore, the PGC rs9471643 GC genotype was associated with a significantly decreased GC risk compared with the CC+GG genotype (P = 0.025, OR = 0.79). However, there was no significant link between the PGC rs6912200 and rs6941539 polymorphisms and the risk of both GC and AG (P > 0.05) [11, 12].
Pairwise interactions between miRNA and PGC SNPs
To further investigate the interaction of three miRNA SNPs and SNPs of their predicted target gene PGC, we first analyzed pairwise interaction effects using significant effect models in the main effect analysis (Table 1). MiRNA SNPs all used a recessive model, and all PGC SNPs except for rs9471643 and rs6912200 used a dominant model. In addition, PGC rs9471643 used a complete overdominant model, while PGC rs6912200 used a recessive model based on previous data [15]. We found four pairwise combinations that influenced AG risk: one combination negatively interacted with the AG risk, while the other three all positively interacted with the AG risk. The let-7e rs8111742 – PGC rs6458238, miR-365b rs121224 – PGC rs691220, miR-4795 rs1002765 – PGC rs9471643 pairwise combinations positively interacted with the AG risk (Pinteraction = 0.025, interaction index = 4.89; Pinteraction = 0.022, interaction index = 2.02; and Pinteraction = 0.006, interaction index = 2.23, respectively). The let-7e rs8111742 – PGC rs6941539 combination had a negative pairwise interaction in AG risk (Pinteraction = 0.034, interaction index = 0.40). However, none of the miRNA SNP – PGC SNP combinations had a significant interaction (P > 0.05) with the GC risk.
Table 1: The interaction of three miRNA polymorphisms with PGC polymorphisms in the risk of gastric cancer/atrophic gastritisa
let-7e rs8111742 |
miR-365b rs121224 |
miR-4795 rs1002765 |
|||||
|---|---|---|---|---|---|---|---|
GA+GG |
AA |
CG+CC |
GG |
GA+GG |
AA |
||
AG vs CON (n=862 Vs. 862) |
|||||||
PGC rs4711690 |
|||||||
CG+GG |
Case/Control |
296/357 |
22/30 |
249/315 |
69/72 |
264/324 |
54/63 |
OR(95%CI) |
1(Ref) |
0.88 (0.50-1.56) |
1(Ref) |
1.21 (0.84-1.75) |
1(Ref) |
0.58 (0.23-1.47) |
|
CC |
Case/Control |
449/439 |
35/30 |
387/377 |
97/92 |
408/397 |
76/72 |
OR(95%CI) |
1.24 (1.01-1.52) |
1.40 (0.84-2.34) |
1.31 (1.05-1.62) |
1.33 (0.96-1.85) |
0.60 (0.25-1.44) |
0.60 (0.26-1.40) |
|
Pinteraction=0.699 |
Pinteraction=0.908 |
Pinteraction=0.555 |
|||||
interaction index=1.17 |
interaction index=0.97 |
interaction index=1.19 |
|||||
PGC rs6458238 |
|||||||
GA+AA |
Case/Control |
108/135 |
3/14 |
94/120 |
17/29 |
92/125 |
19/24 |
OR(95%CI) |
1(Ref) |
0.27(0.07-0.95) |
1(Ref) |
0.74(0.39-1.43) |
1(Ref) |
0.94(0.49-1.81) |
|
GG |
Case/Control |
638/659 |
54/46 |
542/571 |
150/134 |
579/594 |
113/111 |
OR(95%CI) |
1.21(0.92-1.59) |
1.46(0.91-2.33) |
1.21(0.90-1.62) |
1.42(0.99-2.03) |
1.31(0.68-2.53) |
1.23(0.67-2.28) |
|
Pinteraction=0.025 |
Pinteraction=0.304 |
Pinteraction=0.751 |
|||||
interaction index=4.89 |
interaction index=1.48 |
interaction index=0.88 |
|||||
PGC rs9471643 |
|||||||
GC |
Case/Control |
273/312 |
19/22 |
217/262 |
75/72 |
247/268 |
45/66 |
OR(95%CI) |
1(Ref) |
0.99(0.52-1.86) |
1(Ref) |
1.26(0.87-1.82) |
1(Ref) |
0.74(0.49-1.12) |
|
GG+CC |
Case/Control |
469/484 |
38/39 |
415/433 |
92/90 |
420/455 |
87/68 |
OR(95%CI) |
1.12(0.91-1.37) |
1.11(0.69-1.79) |
1.17(0.93-1.46) |
1.23(0.88-1.74) |
1.01(0.81-1.25) |
1.43(0.99-2.06) |
|
Pinteraction=0.773 |
Pinteraction=0.960 |
Pinteraction=0.006 |
|||||
interaction index=0.89 |
interaction index=1.01 |
interaction index=2.23 |
|||||
PGC rs3789210 |
|||||||
GG+CC |
Case/Control |
172/201 |
13/11 |
144/176 |
41/36 |
157/171 |
28/41 |
OR(95%CI) |
1(Ref) |
1.38(0.60-3.16) |
1(Ref) |
1.39(0.85-2.29) |
1(Ref) |
0.74(0.44-1.26) |
|
GC |
Case/Control |
629/599 |
48/51 |
541/522 |
136/128 |
563/556 |
114/94 |
OR(95%CI) |
1.24(0.98-1.72) |
1.10(0.71-1.71) |
1.28(0.99-1.64) |
1.30(0.94-1.80) |
1.11(0.87-1.42) |
1.35(0.95-1.92) |
|
Pinteraction=0.392 |
Pinteraction=0.307 |
Pinteraction=0.131 |
|||||
interaction index=0.65 |
interaction index=0.73 |
interaction index=1.64 |
|||||
PGC rs6912200 |
|||||||
TC+CC |
Case/Control |
602/592 |
43/52 |
514/512 |
131/132 |
533/540 |
112/104 |
OR(95%CI) |
1(Ref) |
0.81(0.53-1.23) |
1(Ref) |
0.98(0.75-1.29) |
1(Ref) |
1.11(0.83-1.49) |
|
TT |
Case/Control |
196/204 |
18/10 |
169/184 |
45/30 |
185/183 |
29/31 |
OR(95%CI) |
0.95(0.75-1.19) |
1.76(0.81-3.85) |
0.92(0.72-1.17) |
1.49(0.92-2.40) |
1.03(0.81-1.30) |
0.95(0.56-1.59) |
|
Pinteraction=0.205 |
Pinteraction=0.022 |
Pinteraction=0.907 |
|||||
interaction index=1.84 |
interaction index=2.02 |
interaction index=0.96 |
|||||
PGC rs6939861 |
|||||||
GG |
Case/Control |
310/354 |
25/19 |
264/298 |
71/75 |
278/316 |
57/57 |
OR(95%CI) |
1(Ref) |
1.50(0.81-2.78) |
1(Ref) |
1.07(0.74-1.54) |
1(Ref) |
1.14(0.76-1.70) |
|
GA+AA |
Case/Control |
467/408 |
34/40 |
400/369 |
101/79 |
422/375 |
79/73 |
OR(95%CI) |
1.32(1.08-1.62) |
0.97(0.60-1.57) |
1.24(1.00-1.54) |
1.44(1.03-2.02) |
1.29(1.04-1.59) |
1.27(0.88-1.81) |
|
Pinteraction=0.050 |
Pinteraction=0.923 |
Pinteraction=0.414 |
|||||
interaction index=0.44 |
interaction index=1.03 |
interaction index=0.79 |
|||||
PGC rs6941539 |
|||||||
CC |
Case/Control |
555/586 |
45/38 |
474/512 |
122/112 |
506/522 |
90/102 |
OR(95%CI) |
1(Ref) |
1.26(0.80-1.96) |
1(Ref) |
1.17(0.88-1.56) |
1(Ref) |
0.92(0.67-1.25) |
|
CT+TT |
Case/Control |
244/209 |
15/24 |
206/182 |
53/51 |
210/200 |
49/33 |
OR(95%CI) |
1.25(1.00-1.56) |
0.66(0.34-1.28) |
1.23(0.97-1.56) |
1.12(0.75-1.68) |
1.09(0.86-1.37) |
1.58(0.99-2.50) |
|
Pinteraction=0.034 |
Pinteraction=0.269 |
Pinteraction=0.121 |
|||||
interaction index=0.40 |
interaction index=0.74 |
interaction index=1.62 |
|||||
GC vs CON (n=724 Vs. 729) |
|||||||
PGC rs4711690 |
|||||||
CG+GG |
Case/Control |
195/296 |
19/26 |
174/262 |
40/60 |
181/274 |
33/48 |
OR(95%CI) |
1(Ref) |
1.11(0.60-2.05) |
1(Ref) |
1.00(0.64-1.56) |
1(Ref) |
1.06(0.66-1.72) |
|
CC |
Case/Control |
280/377 |
25/27 |
256/326 |
49/78 |
342/264 |
41/62 |
OR(95%CI) |
1.13(0.89-1.44) |
1.40(0.79-2.49) |
1.19(0.92-1.53) |
0.94(0.63-1.41) |
1.18(0.92-1.51) |
1.02(0.66-1.58) |
|
Pinteraction=0.376 |
Pinteraction=0.625 |
Pinteraction=0.563 |
|||||
interaction index=1.48 |
interaction index=0.86 |
interaction index=0.82 |
|||||
PGC rs6458238 |
|||||||
GA+AA |
Case/Control |
81/117 |
9/11 |
70/103 |
20/25 |
75/108 |
15/20 |
OR(95%CI) |
1(Ref) |
1.17(0.46-2.96) |
1(Ref) |
1.17(0.60-2.26) |
1(Ref) |
1.07(0.52-2.22) |
|
GG |
Case/Control |
392/552 |
35/42 |
358/482 |
69/112 |
369/504 |
58/90 |
OR(95%CI) |
1.02(0.75-1.40) |
1.19(0.70-2.03) |
1.09(0.78-1.52) |
0.90(0.59-1.38) |
1.05(0.76-1.45) |
0.94(0.60-1.47) |
|
Pinteraction=0.561 |
Pinteraction=0.202 |
Pinteraction=0.802 |
|||||
interaction index=0.73 |
interaction index=0.61 |
interaction index=0.90 |
|||||
PGC rs9471643 |
|||||||
GC |
Case/Control |
162/254 |
13/20 |
140/210 |
35/64 |
152/220 |
23/54 |
OR(95%CI) |
1(Ref) |
1.02(0.49-2.11) |
1(Ref) |
0.82(0.52-1.31) |
1(Ref) |
0.62(0.36-1.05) |
|
GG+CC |
Case/Control |
311/416 |
31/34 |
288/378 |
54/72 |
292/395 |
50/55 |
OR(95%CI) |
1.18(0.93-1.51) |
1.43(0.85-2.42) |
1.16(0.89-1.50) |
1.13(0.75-1.70) |
1.08(0.83-1.39) |
1.37(0.88-2.12) |
|
Pinteraction=0.547 |
Pinteraction=0.295 |
Pinteraction=0.062 |
|||||
interaction index=1.33 |
interaction index=1.40 |
interaction index=1.94 |
|||||
PGC rs3789210 |
|||||||
CG+GG |
Case/Control |
165/164 |
17/10 |
148/149 |
34/25 |
159/140 |
23/34 |
OR(95%CI) |
1(Ref) |
1.69(0.75-3.80) |
1(Ref) |
1.37(0.78-2.41) |
1(Ref) |
0.60(0.34-1.06) |
|
CC |
Case/Control |
501/510 |
41/45 |
449/442 |
93/113 |
462/479 |
80/76 |
OR(95%CI) |
0.98(0.77-1.26) |
0.91(0.56-1.46) |
1.03(0.78-1.34) |
0.83(0.58-1.18) |
0.85(0.66-1.11) |
0.95(0.65-1.41) |
|
Pinteraction=0.249 |
Pinteraction=0.091 |
Pinteraction=0.099 |
|||||
interaction index=0.57 |
interaction index=0.57 |
interaction index=1.79 |
|||||
PGC rs6912200 |
|||||||
TC+CC |
Case/Control |
498/495 |
41/45 |
444/433 |
95/107 |
459/455 |
80/85 |
OR(95%CI) |
1(Ref) |
0.90(0.58-1.40) |
1(Ref) |
0.86(0.63-1.17) |
1(Ref) |
0.95(0.68-1.33) |
|
TT |
Case/Control |
164/175 |
17/10 |
149/156 |
32/29 |
158/160 |
23/25 |
OR(95%CI) |
0.93(0.73-1.19) |
1.68(0.76-3.70) |
0.93(0.72-1.21) |
1.07(0.64-1.80) |
0.98(0.76-1.27) |
0.91(0.51-1.63) |
|
Pinteraction=0.158 |
Pinteraction=0.227 |
Pinteraction=0.814 |
|||||
interaction index=1.98 |
interaction index=1.49 |
interaction index=1.09 |
|||||
PGC rs6939861 |
|||||||
GG |
Case/Control |
262/301 |
18/16 |
233/251 |
47/66 |
516/548 |
90/97 |
OR(95%CI) |
1(Ref) |
1.29(0.65-2.59) |
1(Ref) |
0.77(0.51-1.16) |
1(Ref) |
0.84(0.53-1.35) |
|
GA+AA |
Case/Control |
364/345 |
36/36 |
326/317 |
74/64 |
68/43 |
6/10 |
OR(95%CI) |
1.23(0.98-1.53) |
1.15(0.70-1.88) |
1.12(0.89-1.42) |
1.25(0.85-1.82) |
1.18(0.94-1.49) |
1.14(0.77-1.70) |
|
Pinteraction=0.426 |
Pinteraction=0.231 |
Pinteraction=0.940 |
|||||
interaction index=0.70 |
interaction index=1.42 |
interaction index=1.02 |
|||||
PGC rs6941539 |
|||||||
CC |
Case/Control |
491/496 |
44/33 |
438/432 |
97/97 |
465/445 |
70/84 |
OR(95%CI) |
1(Ref) |
1.34(0.84-2.14) |
1(Ref) |
0.98(0.72-1.34) |
1(Ref) |
0.81(0.57-1.14) |
|
CT+TT |
Case/Control |
174/173 |
13/22 |
158/155 |
29/40 |
154/169 |
33/26 |
OR(95%CI) |
1.02(0.80-1.31) |
0.60(0.30-1.19) |
1.01(0.78-1.31) |
0.71(0.43-1.17) |
0.88(0.68-1.13) |
1.26(0.74-2.15) |
|
Pinteraction=0.061 |
Pinteraction=0.454 |
Pinteraction=0.189 |
|||||
interaction index=0.43 |
interaction index=0.79 |
interaction index=1.58 |
|||||
Note: a, P for interaction was used Logistic Regession adjusted by gender, age and H. pylori infection status; CON: controls; AG: atrophic gastritis; GC: gastric cancer.
Epistatic effects of two-way miRNA SNP – PGC SNP interactions
Among the four pairwise interactions involving three miRNA SNPs and 4 PGC SNPs, there was no significant association between the three miRNA SNPs and thePGC rs6912200 and PGC rs6941539 polymorphisms in the main effect analysis [12]. We therefore investigated epistatic effects between the pairs of interacting SNPs (Table 2). Regarding miR-365b rs121224 and PGC rs6912200, the rs121224 GG genotype and the rs6912200 TT genotype were both associated with an increased risk of AG (OR = 2.28 and 1.75, respectively), but only if they were both present. Regarding miR-4795 rs1002765, the AA genotype was associated with an increased risk of AG (OR = 1.49), but only in the presence of the PGC rs9471643 GG+CC genotype. Regarding PGC rs6941539, the CT+TT genotype was associated with a decreased risk of GC (OR = 0.38), but only in the presence of the let-7e rs8111742 AA genotype. Other polymorphisms such as PGC rs6458238 were found to be associated with an increased AG risk in our previous study, but showed a stronger interaction with AG risk (OR = 6.95) in the presence of the let-7e rs8111742 AA genotype in the present study. The PGC rs9471643 SNP was also associated with a decreased risk of GC risk in our previous study. However, in this study it was found to be linked to a reduced GC risk and reduced AG risk (OR = 0.46 and 0.45, respectively). These observations suggest that miR-365b rs121224, miR-4795 rs1002765, and both PGC rs6912200 and rs6941539 SNPs have no effect individually but demonstrate pairwise epistatic interactions.
Table 2: Epistatic effect of pair-wise interacting factors on the risks of gastric cancer and atrophic gastritis
Interacted pair-wise SNPs |
Comparison |
Subset |
AG vs. CON |
GC vs. CON |
||
|---|---|---|---|---|---|---|
P |
OR(95%CI) |
P |
OR(95%CI) |
|||
let-7e rs8111742 interacted with PGC rs6458238 |
let7-e rs8111742 AA vs. GA+GG |
PGC rs6458238 GA+AA |
0.056 |
0.28(0.08-1.04) |
0.457 |
1.44(0.55-3.75) |
PGC rs6458238 GG |
0.248 |
1.29(0.84-1.99) |
0.757 |
1.08(0.66-1.76) |
||
PGC rs6458238 GG vs. GA+AA |
let-7e rs8111742 GA+GG |
0.198 |
1.21(0.91-1.62) |
0.709 |
1.06(0.77-1.47) |
|
let-7e rs8111742 AA |
0.008 |
6.95(1.65-29.24) |
0.168 |
0.43(0.13-1.43) |
||
let-7e rs8111742 interacted with PGC rs6941539 |
let-7e rs8111742 AA vs. GA+GG |
PGC rs6941539 CC |
0.062 |
0.52(0.26-1.04) |
0.107 |
0.54(0.26-1.14) |
PGC rs6941539 CT+TT |
0.270 |
1.31(0.81-2.10) |
0.267 |
1.32(0.81-2.14) |
||
PGC rs6941539 CT+TT vs. CC |
let-7e rs8111742 GA+GG |
0.061 |
1.25(0.99-1.57) |
0.890 |
1.02(0.79-1.31) |
|
let-7e rs8111742 AA |
0.089 |
0.48(0.21-1.12) |
0.042 |
0.38(0.15-0.97) |
||
miR-4795 rs1002765 interacted with PGC rs9471643 |
miR-4795 rs1002765 AA vs. GA+GG |
PGC rs9471643 GG+CC |
0.033 |
1.49(1.03-2.16) |
0.361 |
1.22(0.79-1.89) |
PGC rs9471643 GC |
0.059 |
0.65(0.42-1.02) |
0.124 |
0.65(0.38-1.12) |
||
PGC rs9471643 GC vs. GG+CC |
miR-4795 rs1002765 GA+GG |
0.691 |
0.95(0.76-1.20) |
0.436 |
0.90(0.69-1.18) |
|
miR-4795 rs1002765 AA |
0.003 |
0.45(0.27-0.76) |
0.016 |
0.46(0.25-0.87) |
||
miR-365b rs121224 interacted with PGC rs6912200 |
miR-365b rs121224 GG vs. CG+CC |
PGC rs6912200 TC+CC |
0.821 |
0.97(0.73-1.28) |
0.346 |
0.86(0.63-1.18) |
PGC rs6912200 TT |
0.004 |
2.28(1.29-4.00) |
0.385 |
1.29(0.73-2.31) |
||
PGC rs6912200 TT vs. TC+CC |
miR-365b rs121224 CG+CC |
0.398 |
0.90(0.69-1.16) |
0.672 |
0.94(0.72-1.24) |
|
miR-365b rs121224 GG |
0.045 |
1.75(1.01-3.03) |
0.254 |
1.41(0.78-2.56) |
||
Note: All tests were adjusted by age, sex and H. pylori infection. Statistically significant associations were highlighted in bold (P values <0.05). Note: GC, gastric cancer; AG, atrophic gastritis; CON, controls.
Pairwise interactions between individual miRNA SNPs
We also investigated interactions between different miRNA SNPs but found no significant interaction with either the GC or AG risk (P > 0.05; Supplementary Table S2).
Multidimensional analysis of SNP–SNP interactions between miRNA and PGC with H. pylori status
We analyzed the four two-way interaction combinations stratified by H. pylori status, and found that in the H. pylori (+) subgroup, the let-7e rs8111742 – PGC rs6941539 combination showed negative interactions with both GC and AG risk (interaction index = 0.23 and 0.16). Moreover, the miR-365b rs121224 – PGC rs691220 and miR-4795 rs1002765 – PGC rs9471643 pairwise combinations demonstrated positive interactions with AG risk in the H. pylori (−) subgroup (interaction index = 2.16 and 4.10, respectively, Table 3).
Table 3: The interaction of miRNA SNP-PGC SNP stratified by H. pylori infection in the risk of atrophic gastritisa
SNP genotypes |
AG vs. CON |
GC vs. CON |
|||
|---|---|---|---|---|---|
P |
OR(95%CI) |
P |
OR(95%CI) |
||
H. pylori (-) |
|||||
let-7e rs8111742-PGC rs6458238 |
|||||
GA+GG |
GA+AA |
1(Ref) |
1(Ref) |
||
GA+GG |
GG |
0.772 |
1.06(0.72-1.55) |
0.857 |
1.04(0.68-1.59) |
AA |
GA+AA |
0.128 |
0.20(0.03-1.59) |
0.362 |
1.64(0.57-4.73) |
AA |
GG |
0.518 |
1.23(0.66-2.30) |
0.059 |
0.42(0.17-1.03) |
Pinteraction=0.112 |
Pinteraction=0.049 |
||||
interaction index=5.76 |
interaction index=0.26 |
||||
let-7e rs8111742-PGC rs6941539 |
|||||
GA+GG |
CC |
1(Ref) |
1(Ref) |
||
GA+GG |
CT+TT |
0.074 |
1.31(0.97-1.77) |
0.800 |
1.04(0.76-1.44) |
AA |
CC |
0.928 |
1.03(0.56-1.90) |
0.381 |
0.75(0.39-1.43) |
AA |
CT+TT |
0.668 |
0.82(0.33-2.02) |
0.266 |
0.58(0.22-1.52) |
Pinteraction=0.366 |
Pinteraction=0.593 |
||||
interaction index=0.60 |
interaction index=0.73 |
||||
miR-4795 rs1002765-PGC rs9471643 |
|||||
GA+GG |
GC |
1(Ref) |
1(Ref) |
||
GA+GG |
GG+CC |
0.656 |
0.93(0.69-1.27) |
0.695 |
0.93(0.66-1.32) |
AA |
GC |
0.001 |
0.53(0.27-1.05) |
0.476 |
0.78(0.40-1.54) |
AA |
GG+CC |
0.096 |
1.99(1.23-3.22) |
0.092 |
1.64(0.92-2.92) |
Pinteraction=0.001 |
Pinteraction=0.075 |
||||
interaction index=4.10 |
interaction index=2.21 |
||||
miR-365b rs121224-PGC rs6912200 |
|||||
CG+CC |
TC+CC |
1(Ref) |
1(Ref) |
||
CG+CC |
TT |
0.023 |
0.67(0.47-0.95) |
0.339 |
0.85(0.60-1.19) |
GG |
TC+CC |
1.000 |
1.00(0.69-1.46) |
0.962 |
0.99(0.66-1.48) |
GG |
TT |
0.216 |
1.45(0.81-2.60) |
0.935 |
1.03(0.55-1.93) |
Pinteraction=0.042 |
Pinteraction=0.604 |
||||
interaction index=2.16 |
interaction index=1.23 |
||||
H. pylori (+) |
|||||
let-7e rs8111742-PGC rs6458238 |
|||||
GA+GG |
GA+AA |
1(Ref) |
1(Ref) |
||
GA+GG |
GG |
0.109 |
1.43(0.92-2.20) |
0.735 |
1.09(0.67-1.78) |
AA |
GA+AA |
0.220 |
0.34(0.06-1.92) |
0.862 |
0.84(0.11-6.24) |
AA |
GG |
0.050 |
2.32(1.00-5.37) |
0.012 |
3.35(1.31-8.57) |
Pinteraction=0.112 |
Pinteraction=0.248 |
||||
interaction index=4.68 |
interaction index=3.64 |
||||
let-7e rs8111742-PGC rs6941539 |
|||||
GA+GG |
CC |
1(Ref) |
1(Ref) |
||
GA+GG |
CT+TT |
0.393 |
1.17(0.82-1.67) |
0.883 |
0.97(0.65-1.46) |
AA |
CC |
0.113 |
1.99(0.85-4.65) |
0.010 |
4.04(1.39-11.74) |
AA |
CT+TT |
0.170 |
0.50(0.18-1.35) |
0.284 |
0.56(0.19-1.62) |
Pinteraction=0.028 |
Pinteraction=0.018 |
||||
interaction index=0.23 |
interaction index=0.16 |
||||
miR-4795 rs1002765-PGC rs9471643 |
|||||
GA+GG |
GG+CC |
1(Ref) |
1(Ref) |
||
GA+GG |
GC |
0.254 |
1.23(0.86-1.75) |
0.088 |
1.44(0.95-2.17) |
AA |
GG+CC |
0.442 |
0.78(0.43-1.41) |
0.076 |
0.46(0.19-1.09) |
AA |
GC |
0.119 |
0.99(0.56-1.76) |
0.912 |
1.44(0.95-2.17) |
Pinteraction=0.981 |
Pinteraction=0.486 |
||||
interaction index=1.01 |
interaction index=1.48 |
||||
miR-365b rs121224-PGC rs6912200 |
|||||
CG+CC |
TC+CC |
1(Ref) |
1(Ref) |
||
CG+CC |
TT |
0.177 |
1.32(0.88-1.98) |
0.560 |
1.14(0.73-1.79) |
GG |
TC+CC |
0.690 |
0.92(0.60-1.40) |
0.137 |
0.69(0.42-1.13) |
GG |
TT |
0.064 |
2.79(0.94-8.24) |
0.278 |
1.87(0.60-5.81) |
Pinteraction=0.171 |
Pinteraction=0.196 |
||||
interaction index=2.32 |
interaction index=2.33 |
||||
Note:a, P for interaction was used Logistic Regession adjusted by gender and age. CON, controls; AG, atrophic gastritis; GC, gastric cancer; NA, not available.
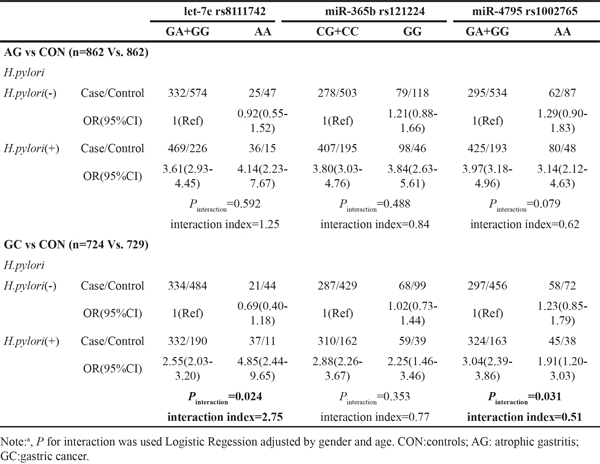
The stratified analyses prompted us to further analyze the interaction between miRNA polymorphisms and H. pylori positivity. We found that the let-7e rs8111742 and H. pylori (+) interaction and the miR-4795 rs1002765 and H. pylori (+) interaction had effects on GC risk (Pinteraction = 0.024, interaction index = 2.75; Pinteraction = 0.031, interaction index = 0.51, respectively; Table 4).
Table 4: The interaction of three miRNA polymorphisms with H. pylori infection status in the risk of gastric cancer/atrophic gastritisa
As both let-7e and miR-4795 SNPs had two-way interactions with H. pylori positivity, we next investigated three-way interactions of let-7e and miR-4795 SNPs with H. pylori infection. We found that the let-7e rs8111742 – PGC rs6458238 – H. pylori three-way combination had a positive interaction with GC risk (Pinteraction = 0.036, interaction index = 15.69), while the miR-4795 rs1002765 – PGC rs9471643 – H. pylori three-way combination had a positive interaction with AG risk (Pinteraction = 0.027, interaction index = 4.02; Table 5).
Table 5: The three dimensions interactions of the miRNA SNP-PGC SNP-H. pylori infection status with the risk of atrophic gastritis/gastric cancera
SNP genotypes |
AG vs. CON |
GC vs. CON |
||||
|---|---|---|---|---|---|---|
P |
OR(95%CI) |
P |
OR(95%CI) |
|||
let-7e rs8111742-PGC rs6458238-H. pylori |
||||||
GA+GG |
GA+AA |
(-) |
1(Ref) |
1(Ref) |
||
GA+GG |
GA+AA |
(+) |
<0.001 |
2.94(1.74-5.00) |
0.002 |
2.52(1.40-4.53) |
GA+GG |
GG |
(-) |
0.772 |
1.05(0.72-1.55) |
0.857 |
1.04(0.68-1.59) |
GA+GG |
GG |
(+) |
<0.001 |
4.20(2.83-6.22) |
<0.001 |
2.74(1.76-4.25) |
AA |
GA+AA |
(-) |
0.128 |
0.20(0.03-1.59) |
0.362 |
1.64(0.57-4.73) |
AA |
GA+AA |
(+) |
0.990 |
0.99(0.18-5.60) |
0.465 |
2.11(0.29-15.52) |
AA |
GG |
(-) |
0.518 |
1.23(0.66-2.30) |
0.059 |
0.42(1.17-1.03) |
AA |
GG |
(+) |
<0.001 |
6.82(3.00-15.49) |
<0.001 |
8.42(3.38-21.00) |
Pinteraction=0.900 |
Pinteraction=0.036 |
|||||
interaction index=0.83 |
interaction index=15.69 |
|||||
let-7e rs8111742-PGC rs6941539-H. pylori |
||||||
GA+GG |
CC |
(-) |
1(Ref) |
1(Ref) |
||
GA+GG |
CC |
(+) |
<0.001 |
3.77(2.94-4.84) |
<0.001 |
2.60(2.00-3.39) |
GA+GG |
CT+TT |
(-) |
0.074 |
1.31(0.97-1.77) |
0.800 |
1.04(0.76-1.44) |
GA+GG |
CT+TT |
(+) |
<0.001 |
4.41(3.13-6.21) |
<0.001 |
2.52(1.72-3.70) |
AA |
CC |
(-) |
0.928 |
1.03(0.56-1.90) |
0.381 |
0.75(0.39-1.43) |
AA |
CC |
(+) |
<0.001 |
7.50(3.23-17.45) |
<0.001 |
10.51(3.65-30.27) |
AA |
CT+TT |
(-) |
0.668 |
0.82(0.33-2.02) |
0.266 |
0.58(0.22-1.51) |
AA |
CT+TT |
(+) |
0.215 |
1.88(0.70-5.06) |
0.493 |
1.45(0.50-4.18) |
Pinteraction=0.265 |
Pinteraction=0.099 |
|||||
interaction index=0.37 |
interaction index=0.20 |
|||||
miR-4795 rs1002765-PGC rs9471643-H. pylori |
||||||
GA+GG |
GG+CC |
(-) |
1(Ref) |
1(Ref) |
||
GA+GG |
GG+CC |
(+) |
<0.001 |
4.62(3.46-6.18) |
<0.001 |
3.70(2.67-5.13) |
GA+GG |
GC |
(-) |
NA |
NA |
NA |
NA |
GA+GG |
GC |
(+) |
<0.001 |
3.51(2.44-5.06) |
<0.001 |
2.41(1.57-3.70) |
AA |
GG+CC |
(-) |
NA |
NA |
NA |
NA |
AA |
GG+CC |
(+) |
<0.001 |
1.75(0.90-3.37) |
0.296 |
1.52(0.69-3.36) |
AA |
GC |
(-) |
NA |
NA |
NA |
NA |
AA |
GC |
(+) |
<0.001 |
5.14(2.24-11.82) |
0.517 |
1.40(0.51-3.86) |
Pinteraction=0.019 |
Pinteraction=0.641 |
|||||
interaction index=4.02 |
interaction index=1.40 |
|||||
Note:a, P for interaction was used Logistic Regession adjusted by gender and age. CON: controls; AG: atrophic gastritis; GC: gastric cancer; NA, not available.
We further analyzed the ORs of the three-way interactions [let-7e rs8111742 – PGC rs6458238 – H. pylori (+) and miR-4795 rs1002765 – PGC rs9471643 –H. pylori (+)] by dividing samples into four subgroups based on the number of the interacting genotypes (Table 6). A significant dose–effect relationship was observed for the let-7e rs8111742 – PGC rs6458238 – H. pylori (+) combination: an increasing number of risk genotypes was associated with an increased risk of GC (Ptrend < 0.001). A similar result was found for the miR-4795 rs1002765 – PGC rs9471643 – H. pylori (+) combination with an increased risk of AG (Ptrend < 0.001).
Table 6: Cumulative effect of the three interacting factors of miRNA SNP-PGC SNP-HP infection on the gastric disease risk
No. of interacting genotypes |
Total population |
||
|---|---|---|---|
Cases/controls |
Pa |
OR(95%CI) |
|
let-7e rs8111742-PGC rs6458238-H. pylori on GC risk |
|||
0 |
38/81 |
1(ref) |
|
1 |
247/445 |
0.444 |
1.18(0.78-1.79) |
2 |
204/189 |
<0.001 |
2.31(1.50-3.57) |
3 |
28/7 |
<0.001 |
8.63(3.45-21.56) |
P trend<0.001 |
|||
miR-4795 rs1002765-PGC rs9471643-H. pylori on AG risk |
|||
0 |
99/188 |
1(ref) |
|
1 |
328/467 |
0.043 |
1.34(1.10-1.77) |
2 |
330/177 |
<0.001 |
3.57(2.63-4.84) |
3 |
42/25 |
<0.001 |
3.51(2.00-6.17) |
P trend<0.001 |
|||
Note: a, adjusted by sex and age.
Gene-gene interaction models tested using MDR
In order to test all the above pairwises of interaction models composed of the miRNA SNPs and PGC SNPs, we used MDR software to verify the best model for the positive interaction which showed in Table 1. The pairwises let-7e rs8111742 – PGC rs6458238 and miR-4795 rs1002765-PGC rs9471643 combination were verified by MDR, which yielded the highest testing accuracy of 0.5288 and 0.5266, and the maximal CV consistency of 9/10 and 10/10, respectively(significant test P = 0.0107, and P for permutation test = 0.0020–0.0025 and 0.0015-0.0020, respectively). But the pairwises miR-365b rs121224-PGC rs6912200 and let-7e rs8111742–PGC rs6941539 combination were not verified by MDR, which suggested a result not stable (Supplemental Table S3).
We further verified all the three-way interaction models composed of the miRNA SNPs, PGC SNPs and H. pylori, and found they were all verified by MDR (all: significant test P = 0.0010, and P for permutation test = 0.0000–0.0005, Supplemental Table S3).
DISCUSSION
Recently, several association studies about miRNA SNPs in gastric cancer risk have been published, including SNPs for miR-146a, miR-196a-2, miR-499, miR-149, miR-27a and miR-34b/c [16, 17]. But there is still no report about other miRNA SNPs, especially the interaction with its targeted gene SNPs. In this study, we reported for the first time about the interaction of three new miRNA SNPs and their target gene SNPs. A series of miRNA SNPs (let-7e rs8111742, miR-365b rs121224, and miR-4795 rs1002765), PGC target gene SNPs (rs4711690, rs6458238, rs9471643, rs3789210, rs6912200, rs6939861 and rs6941539), and H. pylori infection were candidate factors in first a two-way interaction and then a three-way interaction analysis. The analysis showed that two pairwise miRNA SNP – PGC SNP combinations contribute to AG risk. miR-365b rs121224 and PGC rs6912200 polymorphisms had no effect individually but an epistatic interaction for AG risk was noted when they were present together. Furthermore, two-way interactions and the addition of H. pylori infection as a risk factor demonstrated three-way interaction contributing to the GC and AG risks. This result suggests that the combined detection of miRNA SNPs, PGC SNPs, and H. pylori positivity is a significantly better method of detecting GC and AG risk compared with a single factor.
The effect of a single SNP on disease risk is usually reported to be weak (OR < 1.5), but combination of factors had a moderate (OR ≥ 1.5) or strong effect (OR ≥ 2) [18, 19]. Individually, all three miRNA SNPs and PGC SNPs had weak or no effect in the previous study: PGC rs4711690, rs6458238, rs3789210, and rs9471643 had weak protective effects against AG risk (OR = 0.78, 0.73, 0.78, and 0.79), and rs6939861 had a weak effect on the risk of both AG and GC (OR = 1.30 and 1.32) [11, 12]. Furthermore, the individual PGC rs6912200 and rs6941539 and three miRNA polymorphisms (let-7e rs8111742, miR-365b rs121224, and miR-4795 rs1002765; unpublished data) had no effect on the risk of AG or GC (i.e. did not reach statistical significance). However, in this study, these polymorphisms interacted with one another or were epistatic in the GC and AG risk. In the two-way interaction analysis, the pairwise let-7e rs8111742 – PGC rs6458238 combination had an OR for the interaction of 4.89 for the AG risk; this was greater than their individual effects (0.27 and 1.21, respectively). In addition, the pairwise miR-4795 rs1002765 – PGC rs9471643 combination had an OR for their interaction of 2.19 on AG risk; again, this was greater than their individual effects (0.80 and 0.95, respectively).
So far, several studies have shown an association between epistatic effects and cancer risk [20–22]. We also found individual SNPs at single loci that had previously shown no effect on disease risk caused epistasis when combined [23]. In this study, the strongest epistatic interaction was the pairwise miR-365b rs121224 – PGC rs6912200 combination. Both the rs121224 GG genotype and the rs6912200 TT genotype were associated with an increased risk of AG, but only in combination. Another two pairs of factors with epistatic effects were identified: the miR-4795 rs1002765 AA genotype was associated with a decreased risk of AG, but only in the presence of the PGC rs9471643 GC+CC genotype; and PGC rs6941539 CT+TT genotype was associated with a decreased risk of GC, but only in the presence of the let-7e rs8111742 AA genotype. These epistatic effects demonstrate that miR-365b rs121224, miR-4795 rs1002765, and the PGC rs6912200 and rs6941539 polymorphisms contribute to gastric carcinogenesis in a pairwise pattern. In all, this evidence suggests that the combination of miRNA SNPs and PGC SNPs could have a synergistic effect on gastric carcinogenesis. Concerning the possible mechanism for this SNP-SNP interaction, as miRNA could combine the 3’-untranslated region of the targeted gene, PGC protein could protect the mucosal epithelial cell [10], thus, individuals carrying the dual variation in miRNA and PGC gene might cause the decreasing protection function to gastric mucosa and thus increase the risk of gastric cancer. Anyway, the molecular mechanism was not clear now and further functional study would be required.
In this study, we also analyzed the interaction effect of miRNA SNPs and H. pylori infection on disease risk and found that two-way interactions between let-7e or miR-4795 polymorphism and H. pylori infection. We further analyzed the three-way interaction of miRNA SNPs, PGC SNPs, and H. pylori infection, and found that the miR-4795 rs1002765 – PGC rs9471643 – H. pylori (+) combination was positively associated with AG risk and the let-7e rs8111742 – PGC rs6458238 – H. pylori (+) combination was positively associated with GC risk. We reported that PGC SNPs interact with H. pylori infection [12], as did miRNA SNPs. This suggested that in the case of H. pylori infection, these specific SNPs may comprise the variant genotype associated with gastric carcinogenesis in the presence of H. pylori. We further analyzed the dose–effect relationship for disease risk and confirmed that the same three-way combinations were associated with GC or AG risk (Ptrend < 0.001). The interaction analysis used logistic regression, and dose effects suggested that H. pylori infection may co-operate with miRNA SNP – PGC SNP to increase the disease risk. It was previously reported that PGC protein expression may be stimulated by lipopolysaccharides of the CagA (+) strain of H. pylori [24], supporting our evidence that any two of the three factors (i.e. miRNA SNPs, PGC SNPs, and H. pylori infection) have interaction effects; thus, our evidence suggested a biological basis for the three-way interaction. Individuals carrying these risk genotypes may be at a high risk of GC or precancerous disease; therefore, H. pylori should be eliminated and they should be promptly tested for the multiple risk factors to monitor gastric carcinogenesis [25].
Our study has several limitations. First, although this research already contained a relative large sample, the sample size still needs to be enlarged to confirm the interaction effect results, especially for rare genotypes. And also an independent replication is urgently encouraged for verification of our present study in the further. Second, other environmental factors and clinical pathological parameters should be included so that potential interactions between SNPs and other factors such as smoking and drinking can be analyzed.
In summary, this study found that two pairwise interacting miRNA SNP – PGC SNP combinations were associated with increased AG risk (let-7e rs8111742 – PGC rs6458238 and miR-4795 rs1002765 – PGC rs9471643), which were consistently identified by two different statistical approaches: multi-logistic regression and MDR analyses. In addition, the miR-365b rs121224 and PGC rs6912200 polymorphisms had no effect but demonstrated an epistatic effect when present together on the AG risk. Three-way interaction analysis showed that miR-4795 rs1002765 – PGC rs9471643 – H. pylori (+) had a positive interaction in AG risk and let-7e rs8111742 – PGC rs6458238 – H. pylori (+) had positive interaction in GC risk. These three-way interactions both had dose–effect correspondence. In conclusion, the miRNAs SNPs (let-7e rs8111742 and miR-4795 rs1002765) might have more superior efficiency when combined with PGC SNPs and/or H. pylori for GC or AG risk than a single SNP on its own.
MATERIALS AND METHODS
Patients
This study was approved by the Ethics Committee of the First Affiliated Hospital of China Medical University, Shenyang, Liaoning. The demographic and geographic characteristics of study participants are shown in Supplementary Table S1, which relates previously published data [12]. A total of 2448 individuals were recruited in this case–control study: 862 AG patients and 862 healthy individuals matched by age and sex (control group); and 724 GC patients. For GC risk analysis, 729 individuals in the control group matched by age and sex were selected to compare with the GC group. Healthy control and AG tissue samples were selected from a GC screening program that took place in the Zhuanghe area of Liaoning Province between 1997 and 2008. GC patients were recruited individuals who underwent surgery at the First Affiliated Hospital of China Medical University. Informed consent was obtained from all participants and medical information (included age, sex) was collected by questionnaire survey or interview. Peripheral venous blood samples were taken from all participants, and all underwent gastroscopic examination and biopsy collection; disease was confirmed by a histopathological diagnosis by two independent pathologists. The diagnosis for the control group was normal or slight superficial gastritis and AG was diagnosed used the Sydney classification [26, 27]. The inclusion criterion for the AG group was histologically confirmed medium or severe AG [28].
SNP genotyping
Genomic DNA was extracted from venous blood as previously described [29]. The DNA concentration was adjusted to 20 ng/μl. SNP genotyping was performed using Matrix assisted laser desorption/ionization time of flight mass spectrometry, as previously described [12]. Ten percent of all samples were re-analyzed to verify the result: the consistency rate was higher than 99%.
Detection of the serum H. pylori IgG titer
We tested the serum H. pylori immunoglobulin G (IgG) antibody titer by enzyme-linked immunosorbent assay (Helicobacter pylori IgG kit; Biohit, Helsinki, Finland) according to a previously described method [30, 31]. Patients with a serum titer > 34 IU were diagnosed as H. pylori positive.
Statistical analysis
This study defined the heterozygote plus rare homozygote compared with the wild-type genotype as the dominant model, the mutant genotype compared with the wild-type genotype plus the heterozygote as the recessive model, and the heterozygote compared with the wild-type plus the mutant genotype as the complete overdominant model [15]. The distribution of demographic characteristics and the genotype in case and control groups was tested using χ2 test. Multivariate logistic regression analysis adjusted by age, sex, and H. pylori status was used to assess the OR and 95% confidence interval for the GC and AG risks. The log likelihood ratio test was used for the interaction analysis between miRNA SNP, PGC SNP, and H. pylori status. The Cochrane–Armitage test for linear trends was used to judge the dose–effect relationship between GC/AG risk and an increasing number of risk genotypes. All the risk factors including miRNA SNPs, PGC SNPs and H. pylori identified in the best models of gene–gene interactions were calculated using MDR software (version 3.0.2) and MDR permutation testing software (version 1.0 beta 2) [32] in order to confirm the multivariate logistic regression results. All statistical tests were performed using PASW Statistics for Windows, Version 18.0 (SPSS Inc., Chicago, IL, USA) and Stata version 11.0 (StataCorp, College Station, TX, USA). All tests were two sided and statistical significance was set at P < 0.05.
FUNDING
This work is supported by grants from the National Key Basic Research Program of China (973 Program ref no. 2010CB529304), the National Natural Science Foundation of China (Ref No. 31200968) and Science Project of Liaoning Province (Ref [2008]621).
CONFLICTS OF INTEREST
The authors declared no potential conflicts of interest.
REFERENCES
1. Altmuller J, Palmer LJ, Fischer G, Scherb H, Wjst M. Genomewide scans of complex human diseases: true linkage is hard to find. American journal of human genetics. 2001; 69:936-50. doi: 10.1086/324069.
2. Hirschhorn JN, Lohmueller K, Byrne E, Hirschhorn K. A comprehensive review of genetic association studies. Genet Med. 2002; 4:45-61. doi: 10.1097/00125817-200203000-00002.
3. Moore JH, Williams SM. New strategies for identifying gene-gene interactions in hypertension. Annals of medicine. 2002; 34:88-95. doi: 10.1080/07853890252953473.
4. Cordell HJ. Detecting gene-gene interactions that underlie human diseases. Nature reviews. 2009; 10:392-404. doi: 10.1038/nrg2579.
5. Moore JH. The ubiquitous nature of epistasis in determining susceptibility to common human diseases. Human heredity. 2003; 56:73-82. doi: 10.1159/000073735.
6. Sapkota Y, Mackey JR, Lai R, Franco-Villalobos C, Lupichuk S, Robson PJ, Kopciuk K, Cass CE, Yasui Y, Damaraju S. Assessing SNP-SNP interactions among DNA repair, modification and metabolism related pathway genes in breast cancer susceptibility. PloS one. 2013; 8:e64896. doi: 10.1371/journal.pone.0064896.
7. He C, Tu H, Sun L, Xu Q, Gong Y, Jing J, Dong N, Yuan Y. SNP interactions of Helicobacter pylori-related host genes PGC, PTPN11, IL1B, and TLR4 in susceptibility to gastric carcinogenesis. Oncotarget. 2015; 6:19017-26. doi: 10.18632/oncotarget.4231.
8. Heo I, Joo C, Cho J, Ha M, Han J, Kim VN. Lin28 mediates the terminal uridylation of let-7 precursor MicroRNA. Molecular cell. 2008; 32:276-84. doi: 10.1016/j.molcel.2008.09.014.
9. Farzan SF, Karagas MR, Christensen BC, Li Z, Kuriger JK, Nelson HH, New Hampshire Skin Cancer S. RNASEL and MIR146A SNP-SNP interaction as a susceptibility factor for non-melanoma skin cancer. PloS one. 2014; 9:e93602. doi: 10.1371/journal.pone.0093602.
10. Ning PF, Liu HJ, Yuan Y. Dynamic expression of pepsinogen C in gastric cancer, precancerous lesions and Helicobacter pylori associated gastric diseases. World J Gastroenterol. 2005; 11:2545-8. doi: 10.3748/wjg.v11.i17.2545.
11. He C, Tu H, Sun L, Xu Q, Li P, Gong Y, Dong N, Yuan Y. Helicobacter pylori-related host gene polymorphisms associated with susceptibility of gastric carcinogenesis: a two-stage case-control study in Chinese. Carcinogenesis. 2013; 34:1450-7. doi: 10.1093/carcin/bgt079.
12. He CY, Sun LP, Xu Q, Liu JW, Jiang JY, Dong NN, Yuan Y. PGC TagSNP and its interaction with H. pylori and relation with gene expression in susceptibility to gastric carcinogenesis. PloS one. 2014; 9:e115955. doi: 10.1371/journal.pone.0115955.
13. Correa P. Human gastric carcinogenesis: a multistep and multifactorial process--First American Cancer Society Award Lecture on Cancer Epidemiology and Prevention. Cancer research. 1992; 52:6735-40.
14. Link A, Kupcinskas J, Wex T, Malfertheiner P. Macro-role of microRNA in gastric cancer. Digestive diseases (Basel, Switzerland). 2012; 30:255-67. doi: 10.1159/000336919.
15. He C, Xu Q, Tu H, Sun L, Gong Y, Liu J, Yuan Y. Polymorphic rs9471643 and rs6458238 upregulate PGC transcription and protein expression in overdominant or dominant models. Molecular carcinogenesis. 2015. doi: 10.1002/mc.22305.
16. Pan XM, Sun RF, Li ZH, Guo XM, Qin HJ, Gao LB. Pri-miR-34b/c rs4938723 polymorphism is associated with a decreased risk of gastric cancer. Genetic testing and molecular biomarkers. 2015; 19:198-202. doi: 10.1089/gtmb.2014.0287.
17. Xu Q, Liu JW, Yuan Y. Comprehensive assessment of the association between miRNA polymorphisms and gastric cancer risk. Mutation research Reviews in mutation research. 2015; 763:148-60. doi: 10.1016/j.mrrev.2014.09.004.
18. Bedard PL, Krzyzanowska MK, Pintilie M, Tannock IF. Statistical power of negative randomized controlled trials presented at American Society for Clinical Oncology annual meetings. J Clin Oncol. 2007; 25:3482-7. doi: 10.1200/JCO.2007.11.3670.
19. Lin HY, Amankwah EK, Tseng TS, Qu X, Chen DT, Park JY. SNP-SNP interaction network in angiogenesis genes associated with prostate cancer aggressiveness. PloS one. 2013; 8:e59688. doi: 10.1371/journal.pone.0059688.
20. Aminimoghaddam S, Shahrabi-Farahani M, Mohajeri-Tehrani M, Amiri P, Fereidooni F, Larijani B, Shafiee G, Amoli MM. Epistatic interaction between adiponectin and survivin gene polymorphisms in endometrial carcinoma. Pathology, research and practice. 2015; 211:293-7. doi: 10.1016/j.prp.2014.11.012.
21. Chen LS, Fann JC, Chiu SY, Yen AM, Wahlfors T, Tammela TL, Chen HH, Auvinen A, Schleutker J. Assessing interactions of two loci (rs4242382 and rs10486567) in familial prostate cancer: statistical evaluation of epistasis. PloS one. 2014; 9:e89508. doi: 10.1371/journal.pone.0089508.
22. Chu M, Zhang R, Zhao Y, Wu C, Guo H, Zhou B, Lu J, Shi Y, Dai J, Jin G, Ma H, Dong J, Wei Y, et al. A genome-wide gene-gene interaction analysis identifies an epistatic gene pair for lung cancer susceptibility in Han Chinese. Carcinogenesis. 2014; 35:572-7. doi: 10.1093/carcin/bgt400.
23. Carlborg O, Haley CS. Epistasis: too often neglected in complex trait studies? Nature reviews. 2004; 5:618-25. doi: 10.1038/nrg1407.
24. Young GO, Brown S, Stemmet N, Lastovica AJ, Marks IN, Modlin IM, Kidd M. The pepsinogen releasing effect of Helicobacter pylori lipopolysaccharide. Helicobacter. 2002; 7:30-8. doi: 10.1046/j.1523-5378.2002.00053.x
25. Fuccio L, Zagari RM, Minardi ME, Bazzoli F. Systematic review: Helicobacter pylori eradication for the prevention of gastric cancer. Alimentary pharmacology & therapeutics. 2007; 25:133-41. doi: 10.1111/j.1365-2036.2006.03183.x
26. Dixon MF, Genta RM, Yardley JH, Correa P. Classification and grading of gastritis. The updated Sydney System. International Workshop on the Histopathology of Gastritis, Houston 1994. The American journal of surgical pathology. 1996; 20:1161-81. doi: 10.1097/00000478-199610000-00001.
27. Stolte M, Meining A. The updated Sydney system: classification and grading of gastritis as the basis of diagnosis and treatment. Canadian journal of gastroenterology. 2001; 15:591-8.
28. Uemura N, Okamoto S, Yamamoto S, Matsumura N, Yamaguchi S, Yamakido M, Taniyama K, Sasaki N, Schlemper RJ. Helicobacter pylori infection and the development of gastric cancer. The New England journal of medicine. 2001; 345:784-9. doi: 10.1056/NEJMoa001999.
29. Xu Q, Yuan Y, Sun LP, Gong YH, Xu Y, Yu XW, Dong NN, Lin GD, Smith PN, Li RW. Risk of gastric cancer is associated with the MUC1 568 A/G polymorphism. International journal of oncology. 2009; 35:1313-20. doi: 10.3892/ijo_00000449.
30. Gong YH, Sun LP, Jin SG, Yuan Y. Comparative study of serology and histology based detection of Helicobacter pylori infections: a large population-based study of 7,241 subjects from China. Eur J Clin Microbiol Infect Dis. 2010; 29:907-11. doi: 10.1007/s10096-010-0944-9.
31. Xu Q, Dong Q, He C, Liu W, Sun L, Liu J, Xing C, Li X, Wang B, Yuan Y. A New Polymorphism Biomarker rs629367 Associated with Increased Risk and Poor Survival of Gastric Cancer in Chinese by Up-Regulated miRNA-let-7a Expression. PloS one. 2014; 9:e95249. doi: 10.1371/journal.pone.0095249.
32. Hahn LW, Ritchie MD, Moore JH. Multifactor dimensionality reduction software for detecting gene-gene and gene-environment interactions. Bioinformatics. 2003; 19:376-82. doi: 10.1093/bioinformatics/btf869.