
INTRODUCTION
Thyroid hormone receptors (TRs) are ligand-dependent transcription factors that mediate biological activities, such as cell growth, development and differentiation of the thyroid hormone (TH) [1-4]. Human TRs belong to a superfamily of nuclear receptors, and are encoded by THRA and THRB genes located on human chromosomes 17 and 3, respectively [5]. The two functional receptor isoforms, TRα1 and TRβ1, are expressed at different levels across various tissues and bind T3. TR binds as a monomer, homodimer, or heterodimer with retinoid X receptor (RXR) at thyroid hormone response elements (TREs) to regulate target gene transcription [6-8]. In T3-depleted conditions, TRs recruit nuclear corepressors for transcriptional repression of genes positively regulated by T3. Conversely, T3-bound TR undergoes conformational changes that result in release of co-repressors, allowing recruitment of nuclear receptor coactivators to facilitate transcriptional activation [9, 10]. A number of recent studies have attempted to characterize the functions and mechanisms underlying the positive or negative transcriptional regulation of TRβ1 [11-13]. However, limited information is available on genes directly regulated by TRα1 that are involved in critical pathways.
While several TRα1-regulated target genes have been identified in liver, their regulatory mechanisms and functional effects have not been reported to date [14]. A previous microarray study did not address whether these effects are directly or indirectly regulated by TRα1. Recently, the TRα1 and TRβ1 cistromes were analyzed in a neural cell line using overexpressed, tagged receptors, revealing that the two receptor isoforms share some overlap in binding sites but also have unique targets [15]. However, it remains to be established whether T3 can directly and specifically regulate TRα1–binding genes in hepatoma cell lines.
To characterize the TRα1 binding sites in a hepatoma cell line, we performed chromatin affinity precipitation coupled with microarray under T3 treatment conditions. Notably, T3 treatment enhanced TRα1 binding both positively and negatively at distinct genomic sites, and these changes were strongly correlated with those in the expression of associated genes. These results support a specific mechanism underlying the regulation of target genes by TRα1 whereby transcriptional changes are effected by T3 dictating differential binding of TRα1 through preferred motifs.
The E26 transformation-specific (ETS) family has been increasingly recognized as key regulators of cell differentiation, hormone responses and tumorigenesis in target tissues [16, 17]. The ETS family of genes is highly diverse, consisting of both transcriptional activators and repressors that mediate growth factor signaling and regulate gene expression through interactions with multiple protein partners [18]. ELF2, belonging to the ETS family, is associated with cell proliferation [19] and downregulated by T3/TR. In the current study, we focused on the role of ELF2 and mechanisms underlying its regulation by T3/TR in a hepatoma cell line. Based on the collective findings, we propose that T3/TR suppresses cell proliferation through downregulation of ELF2 in HCC.
RESULTS
ChIP-on-chip analysis of gene binding in HepG2-TRα1 cells
A HepG2 cell line stably expressing high levels of wild-type TRα1 (HepG2-TRα1) was established for analyses (Figure 1A, upper panel). Well-known TR-binding genes, such as Furin [21], Glu5 [22] and Dio [23], were employed to determine direct regulation by T3/TR using the ChIP assay. TR proteins were clearly associated with the TRE region within Furin, Glu5 and Dio promoters in vivo (Figure 1A, lower panel and Figure 1B). TRα1 was recruited to the TRE-binding site whereas control IgG produced only background levels. Under similar conditions, the ChIP-on-chip assay was used to assess the global and direct binding genes of T3/TR. Overall, more than two thousand (2913) genes showed direct binding, 481 of which were enriched from ChIP-on-chip coupled with oligonucleotide microarray of genes in hepatoma cultures treated with T3 (5246 genes) (Figure 1C). Among these, 304 up- and 176 down-regulated genes were directly bound and modulated by T3/TR.
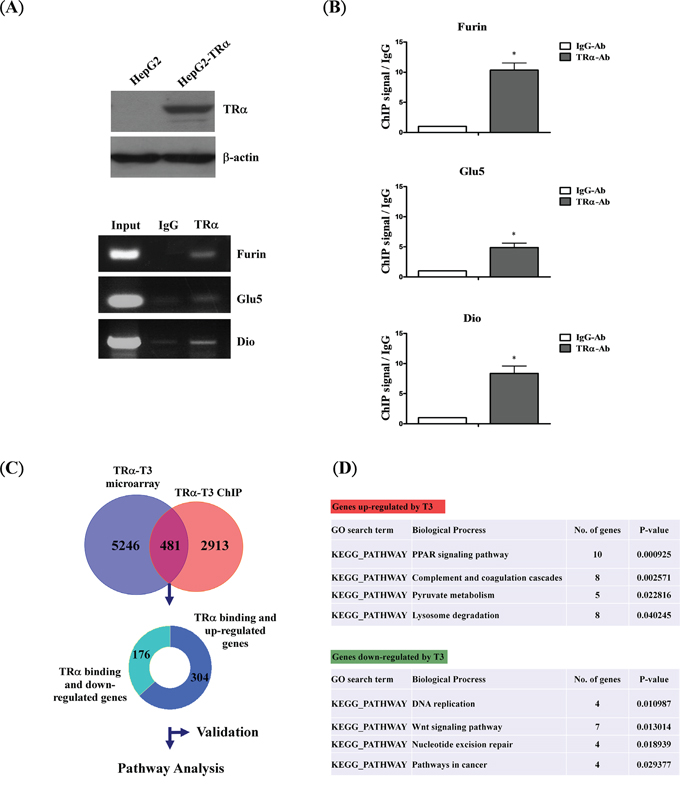
Figure 1: Schematic diagram of ChIP-on-chip analysis. A. Western blot analysis of TR expression in extracts of TRα1-overexpressing cell lines. The positions of 47 kDa TRα1 are indicated. ChIP assay demonstrating that TRα1 is recruited to the TRE regions of positive control genes (FURIN, GLU5 and DIO) using RT-PCR and B. q-RT-PCR, respectively. C. Overlapping genes between ChIP-on-chip and oligonucleotide microarray in T3-treated conditions. D. Functional pathways of genes directly regulated by T3/TR. Differences were analyzed using one-way ANOVA, *P < 0.05.
To determine the functions of the 481 identified genes, bioinformatics pathway analysis (DAVID) was performed. Upregulated genes (304) were involved in cell metabolism pathways, such as PPAR-α signaling, pyruvate metabolism and lysosome degradation, while downregulated genes (176) were linked to cancer-associated pathways, such as Wnt signaling, DNA replication and repair. We additionally validated direct binding and regulation by T3/TR of the two known up- and downregulated genes, PPAR-α [24] and c-MYC [25-27], respectively (Figure S1). Our results support the theory that TRα1 protein binds the promoter regions of these target genes for transcriptional regulation.
Genes directly bound and positively regulated by T3/TR
To validate ChIP-on-chip data, the top 50 ranking genes were selected. Overall, 92% of genes (46/50) that directly interact with TR were verified. However, among these genes, 84.78% (39/46) were truly regulated by T3/TR. Furthermore, 28 of 33 (84.85%) genes were upregulated. Symbolic genes, such as ADOR2A2, CMIP, SELT, FURIN, TPCN1 and TP53I3 directly interacted with and were rapidly and positively regulated by T3/TR (Figure 2A, 2B). Other genes, such as GAS6, KLC2, HGS, FGFR3, PPAR-α and SLC16A6 bound directly and were positively regulated, but at a slower rate (Figure 2C, 2D).
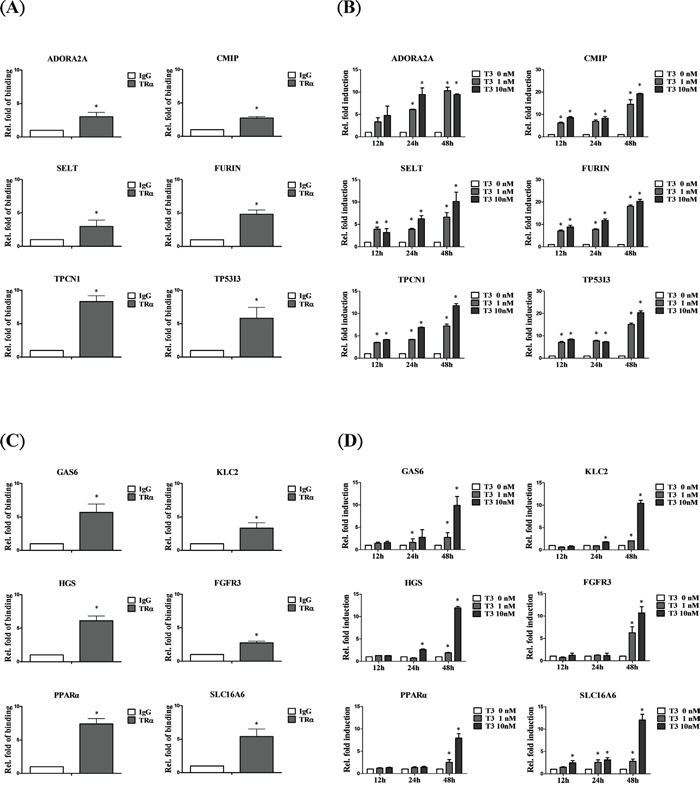
Figure 2: Genes positively regulated by T3/TR. A. Relative binding fold, B. q-RT-PCR assessment of expression of T3/TR-upregulated genes with rapid responses (12-48 h) in the absence or presence of 1 or 10 nM T3 in HepG2-TRα1cells C, D. T3/TR-upregulated genes with delayed responses. Differences were analyzed using one-way ANOVA, *P < 0.05.
Genes directly bound and negatively regulated by T3/TR
According to the ChIP-on-chip database, 11 of 13 (84.85%) genes bound directly and were rapidly downregulated, including SOX9, DDAH2, SF3A2 and RAP2B (Figure 3A, 3B), while WHSC1, HSPA12A, c-MYC, ITIH5, TAF6L and ELF2 bound directly but were negatively regulated at a slower rate (Figure 3C, 3D). Taken together, the results support the high accuracy of our database and confirm the identities of specific genes directly regulated by T3/TR in hepatoma cells.
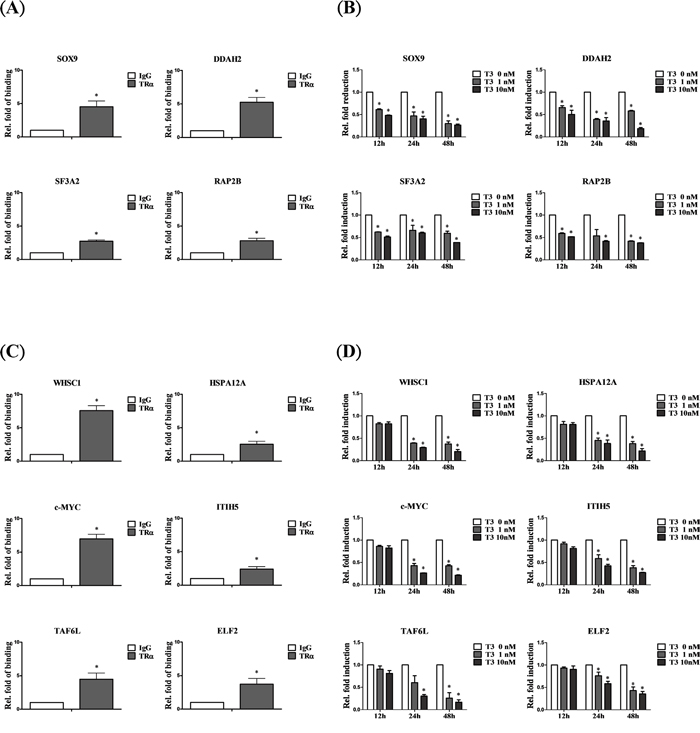
Figure 3: Genes negatively regulated by T3/TR. A. Relative binding fold, B. q-RT-PCR assessment of expression levels of T3/TR- downregulated genes with rapid responses (12-48 h) in the absence or presence of 1 or 10 nM T3 in HepG2-TRα1cells C, D. T3/TR-downregulated genes with delayed responses. Differences were analyzed using one-way ANOVA, *P < 0.05.
T3/TR supresses cell proliferation in vitro and in vivo
Pathway analysis suggested that T3/TR suppresses the proliferation of cancer cells. To further examine this theory, HepG2 and J7 cell lines stably expressing high levels of wild-type TRα1 (HepG2-TRα1 and J7-TRα1, respectively) were established. Notably, the proliferation ability of HepG2-TRα1 and J7-TRα1 cells was significantly suppressed upon T3 stimulation (Figure 4A, 4B left panel). Moreover, the cell cycle of HepG2-TRα1 and J7-TRα1 cells was arrested at the G1 phase following T3 treatment (Figure 4A, 4B right panel). To verify whether the in vitro effect of T3/TR can be replicated in vivo, nude mice were injected with J7-TRα1 cells following by T3 stimulation. Higher T3 levels (hyperthyroid conditions) induced suppression of tumor weight and volume, compared to that in control mice (euthyroid conditions) (Figure 4C). Both our in vitro and in vivo findings support the potential utility of T3/TR as a target for effective suppression of cancer cell proliferation.
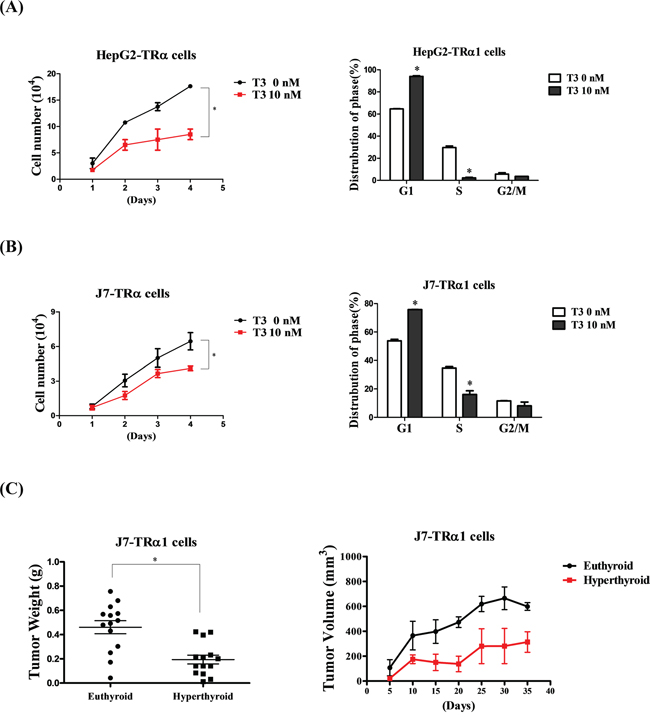
Figure 4: T3/TR suppresses cell proliferation and the cell cycle in vitro and in vivo. Cell growth ability and cell cycle were analyzed in two TRα1-overexpressing A. HepG2 and B. J7 cell lines in the absence or presence of 10 nM T3. The number of cells was counted to determine proliferation activity. The cell cycle stage was detected via flow cytometry. C. Tumor weights and volumes of nude mice injected with J7-TRα1 cells treated with high levels of T3 (hyperthyroid) and administered normal drinking water (euthyroid). Differences were analyzed using one-way ANOVA, *P < 0.05.
T3/TR suppresses cell growth via downregulation of ELF2
ELF2 is a transcription factor that promotes cancer cell proliferation [28]. According to our database, ELF2 is directly bound and downregulated by T3/TR (Figure 5A). To determine the mechanism underlying the association of T3/TR with ELF2 function in proliferation, ELF2 was overexpressed in J7 and HepG2-TRα1 cell lines. J7 cells overexpressing ELF2 displayed significantly increased proliferation, compared with control cells (Figure 5B), along with markedly decreased expression levels of two cell growth inhibitory genes, p21 [29, 30] and p27 [31, 32] (~0.4 to 0.6 and ~0.3 to 0.5-fold, respectively) (Figure 5D). Moreover, both p21 and p27 were downregulated by T3/TR (Figure 5E). Notably, the proliferative ability of HepG2-TRα1 control cells (T3 0 nM, pcDNA3.0) was markedly suppressed under T3 stimulation (T3 10 nM, pcDNA3.0), but restored upon ELF2 re-expression (HepG2-TRα1-ELF2) (Figure 5C). The observed T3-induced inhibition of cancer cell growth and ELF2 expression supports the hypothesis that T3/TR suppresses tumor proliferation via ELF2 regulation.
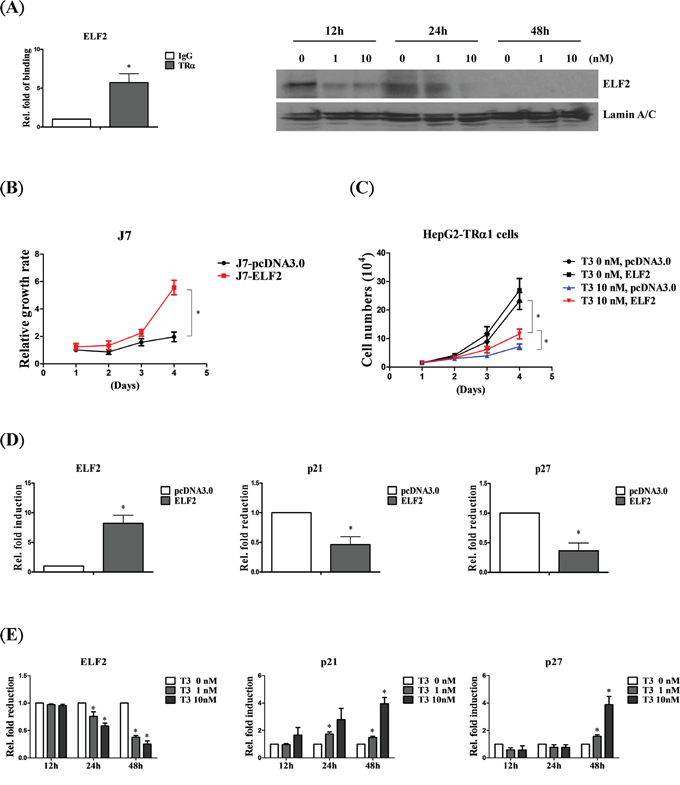
Figure 5: ELF2 is negatively regulated by T3/TR to suppress cell proliferation. A. ChIP assay demonstrating that TRα1 is recruited to the ELF2 TRE (left panel). Western blot analysis of ELF2 protein expression in stable HepG2-TRα1 cell lines at 12-48 h in the absence or presence of 1 and 10 nM T3 (right panel). B. Cell proliferation analysis via cell counting in ELF2-overexpressing and control J7 cell lines. C. ELF2 overexpression rescues the proliferation activity of HepG2-TRα1 cells at 48 h in the absence or presence of 10 nM T3. q-RT-PCR detection of p21 and p27 in ELF2-overexpressing, compared to vector control-expressing D. J7 cells or E. HepG2-TRα1 cells in similar T3 conditions. Differences were analyzed using one-way ANOVA, *P < 0.05.
ELF2 depletion suppresses cell growth through p21 and p27 signaling
To determine the consequences of ELF2 depletion, SK-HEP1 control cell lines and shLuc and ELF2 knockdown lines (shELF2#1 and shELF2#2) were established (Figure 6A, upper panel). After depletion of ELF2, proliferation of SK-HEP1 cells was decreased, compared with control cells (Figure 6C, upper panel), confirming the ability of ELF2 to accelerate tumor cell growth. Moreover, ELF2-depleted cells were arrested at the G1 phase, consistent with the effects of T3 (Figure 6C, lower panel). Accordingly, we further examined whether p21 and p27 activation are implicated in ELF2-depleted phenotypes. Marked upregulation of p21 and p27 was observed in ELF2-depleted cells (shELF2#1 and shELF2#2), compared with control cells (shLuc) (Figure 6A, 6B). Our findings suggest that stimulation of p21 and p27 in hepatoma cells is mediated via ELF2 repression. Based on the collective data, we conclude that T3/TR-mediated downregulation of ELF2 suppresses cell proliferation via activation of p21 and p27 (Figure 6D).
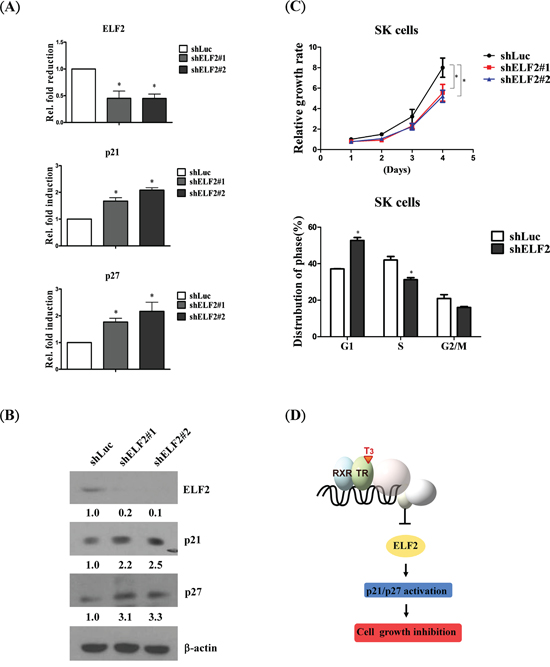
Figure 6: ELF2 depletion suppresses cell proliferation via p21 and p27 activation. Detection of ELF2, p21 and p27 expression in ELF2-depleted (shELF2#1, shELF2#2) and control (shLuc) SK-Hep1 cells using A. q-RT-PCR and B. western blot, respectively. C. Cell proliferation analysis in ELF2-depleted (shELF2#1, shELF2#2) and control (shLuc) SK-Hep1 cells (upper panel). Cell cycle stages of ELF2-depleted (shELF) and control (shLuc) SK-Hep1 cells detected via flow cytometry (lower panel). D. Schematic diagram showing that T3/TR negatively regulates ELF2 to suppress cell proliferation via p21/p27 activation. Differences were analyzed using one-way ANOVA, *P < 0.05.
DISCUSSION
Our ChIP-on-chip experiments demonstrated that TRα1 binds to multiple regions across the hepatoma genome, with a high percentage of binding sites located within genes. Examination of differential TRα1 binding in hyperthyroid conditions revealed that many sites are bound with increased affinity, depending on the presence of ligand. Importantly, integration with microarray data showed that TRα1 binding significantly correlated with expression patterns of target genes transcriptionally regulated by T3. In this study, we identified TRα1 binding sites associated with 50 genes in HepG2-TRα1 cells. Binding sites may be located in different genomic contexts (both upstream and downstream of the gene and within introns) and may not adhere to conventional sequence motifs (Supplementary Table). Our findings support the notion that the thyroid hormone can regulate several genes through direct binding by TR.
The Ets family of proteins consists of a number of transcription factors that share a conserved winged helix-turn-helix DNA binding domain (Ets domain). Ets factors are critical mediators of a variety of cellular processes, including development, differentiation, growth, and transformation [18]. Some Ets genes may be involved in specific chromosomal translocations in different cancer types [33], suggesting an oncogenic role. Indeed, overexpression of several Ets genes has been reported in cancers of the thyroid, pancreas, liver, colon, lung, and leukemia [34]. ELF2 belongs to the Elf subfamily of Ets transcription factors together with ELF1 and myeloid elf-1-like factor (MEF), and regulates a set of genes in B cells and myeloid cells [35]. Moreover, ELF2 physically interacts with acute myeloid leukemia 1 (AML1), a frequent target for chromosomal translocations in leukemia [36]. ELF2 expression is increased in endothelial cells in response to hypoxia and angiopoietin-1 [37]. While these findings suggest an oncogenic role of ELF2, its precise role in tumorigenesis has not been clarified as yet. In the current study, we showed that ELF2 is modulated by T3 at both mRNA and protein levels. Our experiments confirmed that T3 regulates ELF2 at the transcriptional level and TR proteins directly bind TRE of the ELF2 promoter region. Notably, cell lines overexpressing ELF2 displayed higher proliferation. Moreover, T3-mediated suppression of ELF2 occurred via p21 and p27 activation, leading to inhibition of cancer cell progression.
The liver is a typical target organ of thyroid hormones (THs). Equal amounts of TRα1 and TRβ1 proteins are expressed in human hepatocytes. Recent studies have suggested that long-term hypothyroidism is associated with HCC, independent of other major HCC risk factors [38]. Hypothyroidism is characterized by insufficient production of THs and inappropriate TR action and is a possible risk factor in human cancers. However, no results directly showing that thyroid status is associated with tumor progression have been reported as yet. Earlier studies demonstrated that liver function abnormalities return to normal once primary thyroid pathology is recognized and treated [39]. Subsequently, T3 was shown to mediate apoptosis and accelerate necrosis in liver cells [40]. These results suggest that hypothyroidism increases the risk of liver cancer through decreased apoptosis in the liver lesion process. Another group showed that hypothyroidism is associated with high risk of HCC in women [38]. However, the mechanisms linking hypothyroidism with HCC need to be clarified with further studies on different population groups.
In conclusion, T3 induces an increase in TRα1 binding, leading to either positive or negative regulation of target genes. The results of this study provide new insights into the mechanisms of transcriptional regulation by TRα1: T3-mediated negative regulation of ELF2 may contribute to reduction of hepatoma cell growth through subsequent activation of the cell cycle checkpoint.
MATERIALS AND METHODS
Cell culture
Human hepatoma cells, HepG2, SK-Hep1 and J7, were routinely cultured at 37°C in a humidified atmosphere of 95% air and 5% CO2 in Dulbecco’s modified Eagle’s medium (DMEM) supplemented with 10% fetal bovine serum (FBS). HepG2 and J7 cell lines were stably transfected with TRα1 (HepG2-TRα1 and J7-TRα1).
Chromatin immunoprecipitation (ChIP) assay
HepG2-TRα1 cells treated with 10 nM T3 for 24 h or left untreated were harvested and cross-linked with 1% formaldehyde for 10 min at room temperature in DMEM. Reactions were terminated with the addition of 0.125 M glycine. Subsequently, cell lysates were washed three times with PBS and resuspended in lysis buffer (150 mM NaCl, 5 mM EDTA, 50 mM Tris (pH 8.0), 0.1% SDS and 0.1% sodium deoxycholate) containing three protease inhibitors (1 mM PMSF, aprotinin, and leupeptin). Cell lysates were sonicated with a Misonix Sonicator 3000 Homogenizer (Mandel Scientific Company Inc., Guelph, ON, Canada) to disrupt chromatin. Sonicated DNA was between 200 and 1000 bp in length. Products were precleared with 60 μl protein A/G agarose (Sigma Chemicals, St. Louis, MO) for 2 h at 4°C. Complexes were immunoprecipitated with anti-TR (kindly provided by the laboratory of Dr. S-Y Cheng at the National Cancer Institute) and anti-IgG antibodies (R&D Systems, Inc., Minneapolis, MN). Enriched targets were hybridized to promoter microarrays (Welgene Biotech, ChIP-on-chip microarray) spanning -8 kb to +2 kb of the transcription start site (TSS) of 35000 genes. The promoter fragments of target gene containing the TRE region were detected via q-RT-PCR. All of primers were listed at Supplementary Table.
Cloning of ELF2
cDNA was synthesized from total RNA (1 μg) using Superscript II reverse transcriptase (Invitrogen, Carlsbad, CA) and oligo (dT) primers. ELF2 was amplified from cDNA by polymerase chain reaction (PCR) using the primer pair 5’-ATG GCG ACG TCT CTG CAT GAG GGA C-3’ (forward) and 5’-TTA TTT CTC ACA TGT CAC TAG TCC T-3’ (reverse), and the following thermocycling conditions: 30 cycles at 95°C for 1 min, 58°C for 1 min, and 72°C for 2 min. The ELF2 open reading frame was ligated into the pcDNA 3.0 expression vector, and the resulting construct was sequenced to confirm the presence of the gene.
Establishing J7 cell lines stably overexpressing ELF2
The J7 cell line, grown in 10-cm cell culture dishes, was transfected with the ELF2 expression plasmid using the Lipofectamine reagent (Invitrogen). After 24 h, transformants were selected from transfected cells by growing in medium containing the antibiotic G418 (400 μg/ml). Expression of ELF2 protein in the selected clones was detected using Western blot analysis.
shRNA-mediated ELF2 knockdown
Short hairpin RNA (shRNA) sequences targeting ELF2 were purchased from the National RNAi Core Facility (Institute of Molecular Biology, Academia Sinica, Taiwan). The SK-HEP1 line was transiently transfected with shRNA targeting the endogenous ELF2 gene using the Turbofect reagent (Invitrogen). ELF2 repression was confirmed by Western blot analysis.
Immunoblot analysis
Total cell lysates were prepared, and protein concentrations determined with the Bradford assay kit (Pierce Biotechnology, Rockford, IL). Equivalent amounts of proteins were fractionated on a 10% sodium dodecyl sulfate (SDS)-polyacrylamide gel. Separated proteins were transferred to nitrocellulose membrane (pH 7.9, Amersham Biosciences Inc., Piscataway, NJ), blocked with 5% non-fat powdered milk, and incubated with specific anti-ELF2 (GeneTex; GTX104851), anti-p21 (abcam; ab109520), anti-p27 (abcam; ab32034), anti-c-MYC (GeneTex; GTX103436) and anti-PPARα (GeneTex; GTX101098) primary antibodies at -20 °C overnight. After washing, membranes were incubated with HRP-conjugated anti-mouse, anti-rabbit or anti-goat IgG secondary antibody, as appropriate, for 1 h at room temperature. Immune complexes were visualized using an enhanced chemiluminescence (ECL) detection kit (Amersham) and Fuji X-ray film.
In vitro proliferation assays
The influence of ELF2 on the cell proliferation abilities of J7-ELF2 and SK-HEP1-ELF2-depleted cells were determined. The proliferation abilities under T3 (10nM) condition in HepG2-TRα1 cells and restored by ELF2 expression were identified in vitro as described previously [20]. Briefly, cell density was adjusted to 106 cells/ml, and 100 μl of the suspension seeded on 24 well plate. The medium was DMEM with 10% fetal bovine serum (FBS). After incubation for 1-4 days at 37°C, cells harvested were examined via MTT assay or cell counting. Experiments were performed at least three times.
In vivo proliferation assays
Similar conditions were employed with nude mice containing various T3 levels induced via injection of J7-TRα1 cells [7]. Mice were divided into two groups, specifically, Group A (euthyroid) comprising control mice given normal drinking water and Group B (hyperthyroid) administered drinking water augmented with T3 (2 mg/L) (Sigma Chem. Co., St. Louis, MO) after inoculation of tumor cells. Mice were sacrificed about 1 month after injection, their livers and lungs removed for tumor biopsy, and the T3 and TSH levels determined. The T3 and TSH levels in sera of euthyroid mice (Group A) were 45.5 ng/dl and 0.246 mIU/ml, while those in sera of hyperthyroid mice (Group B) were 619 ng/dl and 0.008 mIU/ml, respectively. Tumor volume was calculated using the following equation: length × height × width. All procedures were performed under sterile conditions in a laminar flow hood. Animal experiments were performed in accordance with the United States National Institutes of Health guidelines and Chang-Gung Institutional Animal Care and Use Committee Guide for the Care and Use of Laboratory Animals.
Cell cycle assay
For detection of cell cycle phases, HepG2-TRα1 cells were starved in serum-free medium for 24 h, followed by incubation in medium with or without T3. After 24 h, cells were harvested with trypsin and washed twice with cold phosphate-buffered saline. SK-HEP1 control and SK-HEP1-ELF2-depleted cells were harvested without T3 condition. Subsequently, cells were fixed with 70% ethanol for 1 h at -20°C and incubated in 0.5% Triton X-100/phosphate-buffered saline containing 0.05% DNase-free RNase for 1 h at 37°C. Nuclei were stained with propidium iodide (50 μg/ml) after treatment with 0.5% Triton X-100/PBS containing 0.05% DNase-free RNase, and the DNA content was analyzed by flow cytometry using the fluorescence-activated cell sorting Aria cell sorting system (Becton Dickinson). The percentage of cells in each phase of the cell cycle was determined using the Modfit LT program (Verity Software House).
Statistical analysis
Data are expressed as mean values ± SEM of at least three experiments. Statistical analysis was performed using Student’s t test and one-way ANOVA. P values < 0.05 were considered statistically significant.
ACKNOWLEDGMENTS
This work is supported by grants from the Ministry of Science and Technology (MOST104-2320-B-182-029-MY3 to B.C.T., MOST103-2320-B182-018-MY3, MOST102-2321-B182-003, MOST101-2321-B182-003, MOST100-2321-B182-005 and MOST100-2320-B-182-029-MY3 to K.H.L.), National Health Research Institute (NHRI-EX105-10321SI to B.C.T.), and Chang Gung Memorial Hospital (CMRPG3D1512 to H.L., CMRPD3E0152, CMRPD1C0843 to B.C.T., CMRPD1C0271, CMRPD 1C0272 and CMRPD 1C0273 to K.H.L.).
CONFLICTS OF INTEREST
The authors declare no conflicts of interest.
REFERENCES
1. Munoz A, Bernal J. Biological activities of thyroid hormone receptors. Eur J Endocrinol. 1997; 137:433-445.
2. Cohen K, Flint N, Shalev S, Erez D, Baharal T, Davis PJ, Hercbergs A, Ellis M, Ashur-Fabian O. Thyroid hormone regulates adhesion, migration and matrix metalloproteinase 9 activity via alphavbeta3 integrin in myeloma cells. Oncotarget. 2014; 5:6312-6322. doi: 10.18632/oncotarget.2205
3. Fabian ID, Rosner M, Fabian I, Vishnevskia-Dai V, Zloto O, Shinderman Maman E, Cohen K, Ellis M, Lin HY, Hercbergs A, Davis PJ, Ashur-Fabian O. Low thyroid hormone levels improve survival in murine model for ocular melanoma. Oncotarget. 2015; 6:11038-11046. doi: 10.18632/oncotarget.3566
4. Lin HY, Glinsky GV, Mousa SA, Davis PJ. Thyroid hormone and anti-apoptosis in tumor cells. Oncotarget. 2015; 6:14735-14743. doi: 10.18632/oncotarget.4023
5. Cheng SY. Multiple mechanisms for regulation of the transcriptional activity of thyroid hormone receptors. Rev Endocr Metab Disord. 2000; 1:9-18.
6. Chen CY, Chung IH, Tsai MM, Tseng YH, Chi HC, Tsai CY, Lin YH, Wang YC, Chen CP, Wu TI, Yeh CT, Tai DI, Lin KH. Thyroid hormone enhanced human hepatoma cell motility involves brain-specific serine protease 4 activation via ERK signaling. Mol Cancer. 2014; 13:162.
7. Chung IH, Chen CY, Lin YH, Chi HC, Huang YH, Tai PJ, Liao CJ, Tsai CY, Lin SL, Wu MH, Lin KH. Thyroid hormone-mediated regulation of lipocalin 2 through the Met/FAK pathway in liver cancer. Oncotarget. 2015; 6:15050-15064. doi: 10.18632/oncotarget.3670
8. Davis FB, Tang HY, Shih A, Keating T, Lansing L, Hercbergs A, Fenstermaker RA, Mousa A, Mousa SA, Davis PJ, Lin HY. Acting via a cell surface receptor, thyroid hormone is a growth factor for glioma cells. Cancer Res. 2006; 66:7270-7275.
9. Dayan CM, Panicker V. Novel insights into thyroid hormones from the study of common genetic variation. Nat Rev Endocrinol. 2009; 5:211-218.
10. Ruiz-Llorente L, Ardila-Gonzalez S, Fanjul LF, Martinez-Iglesias O, Aranda A. microRNAs 424 and 503 are mediators of the anti-proliferative and anti-invasive action of the thyroid hormone receptor beta. Oncotarget. 2014; 5:2918-2933. doi: 10.18632/oncotarget.1577
11. Park JW, Zhao L, Webb P, Cheng SY. Src-dependent phosphorylation at Y406 on the thyroid hormone receptor beta confers the tumor suppressor activity. Oncotarget. 2014; 5:10002-10016. doi: 10.18632/oncotarget.2487
12. Park JW, Zhao L, Willingham M, Cheng SY. Oncogenic mutations of thyroid hormone receptor beta. Oncotarget. 2015; 6:8115-8131. doi: 10.18632/oncotarget.3466
13. Ramadoss P, Abraham BJ, Tsai L, Zhou Y, Costa-e-Sousa RH, Ye F, Bilban M, Zhao K, Hollenberg AN. Novel mechanism of positive versus negative regulation by thyroid hormone receptor beta1 (TRbeta1) identified by genome-wide profiling of binding sites in mouse liver. J Biol Chem. 2014; 289:1313-1328.
14. Moran C, Chatterjee K. Resistance to thyroid hormone due to defective thyroid receptor alpha. Best Pract Res Clin Endocrinol Metab. 2015; 29:647-657.
15. Chatonnet F, Guyot R, Benoit G, Flamant F. Genome-wide analysis of thyroid hormone receptors shared and specific functions in neural cells. Proc Natl Acad Sci U S A. 2013; 110:E766-775.
16. Kawagoe H, Potter M, Ellis J, Grosveld GC. TEL2, an ETS factor expressed in human leukemia, regulates monocytic differentiation of U937 Cells and blocks the inhibitory effect of TEL1 on ras-induced cellular transformation. Cancer Res. 2004; 64:6091-6100.
17. Li D, Bi FF, Cao JM, Cao C, Li CY, Liu B, Yang Q. Poly (ADP-ribose) polymerase 1 transcriptional regulation: a novel crosstalk between histone modification H3K9ac and ETS1 motif hypomethylation in BRCA1-mutated ovarian cancer. Oncotarget. 2014; 5:291-297. doi: 10.18632/oncotarget.1549
18. Hsu T, Trojanowska M, Watson DK. Ets proteins in biological control and cancer. J Cell Biochem. 2004; 91:896-903.
19. Qiu Y, Morii E, Zhang B, Tomita Y, Aozasa K. E74-like factor 2 transactivates valosin-containing protein gene, a gene involved in cancer growth. Exp Mol Pathol. 2008; 84:226-229.
20. Lin YH, Huang YH, Wu MH, Wu SM, Chi HC, Liao CJ, Chen CY, Tseng YH, Tsai CY, Tsai MM, Lin KH. Thyroid hormone suppresses cell proliferation through endoglin-mediated promotion of p21 stability. Oncogene. 2013; 32:3904-3914.
21. Chen RN, Huang YH, Lin YC, Yeh CT, Liang Y, Chen SL, Lin KH. Thyroid hormone promotes cell invasion through activation of furin expression in human hepatoma cell lines. Endocrinology. 2008; 149:3817-3831.
22. Matosin-Matekalo M, Mesonero JE, Laroche TJ, Lacasa M, Brot-Laroche E. Glucose and thyroid hormone co-regulate the expression of the intestinal fructose transporter GLUT5. Biochem J. 1999; 339:233-239.
23. Johnson KM, Lema SC. Tissue-specific thyroid hormone regulation of gene transcripts encoding iodothyronine deiodinases and thyroid hormone receptors in striped parrotfish (Scarus iseri). Gen Comp Endocrinol. 2011; 172:505-517.
24. Zhang N, Chu ES, Zhang J, Li X, Liang Q, Chen J, Chen M, Teoh N, Farrell G, Sung JJ, Yu J. Peroxisome proliferator activated receptor alpha inhibits hepatocarcinogenesis through mediating NF-kappaB signaling pathway. Oncotarget. 2014; 5:8330-8340. doi: 10.18632/oncotarget.2212
25. Jackstadt R, Hermeking H. AP4 is required for mitogen- and c-MYC-induced cell cycle progression. Oncotarget. 2014; 5:7316-7327. doi: 10.18632/oncotarget.2348
26. Raffeiner P, Rock R, Schraffl A, Hartl M, Hart JR, Janda KD, Vogt PK, Stefan E, Bister K. In vivo quantification and perturbation of Myc-Max interactions and the impact on oncogenic potential. Oncotarget. 2014; 5:8869-8878. doi: 10.18632/oncotarget.2588
27. Yao Y, Li C, Zhou X, Zhang Y, Lu Y, Chen J, Zheng X, Tao D, Liu Y, Ma Y. PIWIL2 induces c-Myc expression by interacting with NME2 and regulates c-Myc-mediated tumor cell proliferation. Oncotarget. 2014; 5:8466-8477. doi: 10.18632/oncotarget.2327
28. Zhang B, Tomita Y, Qiu Y, He J, Morii E, Noguchi S, Aozasa K. E74-like factor 2 regulates valosin-containing protein expression. Biochem Biophys Res Commun. 2007; 356:536-541.
29. Liu X, Yang WT, Zheng PS. Msi1 promotes tumor growth and cell proliferation by targeting cell cycle checkpoint proteins p21, p27 and p53 in cervical carcinomas. Oncotarget. 2014; 5:10870-10885. doi: 10.18632/oncotarget.2539
30. Popovics P, Schally AV, Szalontay L, Block NL, Rick FG. Targeted cytotoxic analog of luteinizing hormone-releasing hormone (LHRH), AEZS-108 (AN-152), inhibits the growth of DU-145 human castration-resistant prostate cancer in vivo and in vitro through elevating p21 and ROS levels. Oncotarget. 2014; 5:4567-4578. doi: 10.18632/oncotarget.2146
31. Jezkova J, Williams JS, Jones-Hutchins F, Sammut SJ, Gollins S, Cree I, Coupland S, McFarlane RJ, Wakeman JA. Brachyury regulates proliferation of cancer cells via a p27Kip1-dependent pathway. Oncotarget. 2014; 5:3813-3822. doi: 10.18632/oncotarget.1999
32. Zhao H, Faltermeier CM, Mendelsohn L, Porter PL, Clurman BE, Roberts JM. Mislocalization of p27 to the cytoplasm of breast cancer cells confers resistance to anti-HER2 targeted therapy. Oncotarget. 2014; 5:12704-12714. doi: 10.18632/oncotarget.2871
33. Annala M, Kivinummi K, Tuominen J, Karakurt S, Granberg K, Latonen L, Ylipaa A, Sjoblom L, Ruusuvuori P, Saramaki O, Kaukoniemi KM, Yli-Harja O, Vessella RL, et al. Recurrent SKIL-activating rearrangements in ETS-negative prostate cancer. Oncotarget. 2015; 6:6235-6250. doi: 10.18632/oncotarget.3359
34. Seth A, Watson DK. ETS transcription factors and their emerging roles in human cancer. Eur J Cancer. 2005; 41:2462-2478.
35. Oettgen P, Akbarali Y, Boltax J, Best J, Kunsch C, Libermann TA. Characterization of NERF, a novel transcription factor related to the Ets factor ELF-1. Mol Cell Biol. 1996; 16:5091-5106.
36. Cho JY, Akbarali Y, Zerbini LF, Gu X, Boltax J, Wang Y, Oettgen P, Zhang DE, Libermann TA. Isoforms of the Ets transcription factor NERF/ELF-2 physically interact with AML1 and mediate opposing effects on AML1-mediated transcription of the B cell-specific blk gene. J Biol Chem. 2004; 279:19512-19522.
37. Christensen RA, Fujikawa K, Madore R, Oettgen P, Varticovski L. NERF2, a member of the Ets family of transcription factors, is increased in response to hypoxia and angiopoietin-1: a potential mechanism for Tie2 regulation during hypoxia. J Cell Biochem. 2002; 85:505-515.
38. Hassan MM, Kaseb A, Li D, Patt YZ, Vauthey JN, Thomas MB, Curley SA, Spitz MR, Sherman SI, Abdalla EK, Davila M, Lozano RD, Hassan DM, Chan W, Brown TD, Abbruzzese JL. Association between hypothyroidism and hepatocellular carcinoma: a case-control study in the United States. Hepatology. 2009; 49:1563-1570.
39. Bayraktar M, Van Thiel DH. Abnormalities in measures of liver function and injury in thyroid disorders. Hepatogastroenterology. 1997; 44:1614-1618.
40. Upadhyay G, Singh R, Kumar A, Kumar S, Kapoor A, Godbole MM. Severe hyperthyroidism induces mitochondria-mediated apoptosis in rat liver. Hepatology. 2004; 39:1120-1130.