
INTRODUCTION
Esophagogastric junction (EGJ) adenocarcinoma has rapidly increased worldwide [1–3] along with its risk factors; namely, obesity and gastro-esophageal reflux disease (GERD) [4, 5]. The prognosis of EGJ tumors remains poor [6], despite the development of multidisciplinary treatments using cytotoxic agents [7, 8]. Molecular-targeted therapy is an attractive option in the management of gastrointestinal cancer. Trastuzumab, a monoclonal antibody that interferes with HER2/neu, is effective against EGJ adenocarcinoma when combined with chemotherapy [9]. Recently, ramucirumab has emerged as an effective monoclonal antibody targeting VEGFR-2 [10, 11]. However, further molecular targets are necessary to improve the survival rates of this cancer.
Recently, next-generation sequencing technologies have revealed frequent oncogenic amplification as an important genetic alteration in the carcinogenesis of esophageal adenocarcinomas, including EGJ adenocarcinoma [12–15]. We previously identified FGFR2 amplification in esophageal adenocarcinoma [15]. FGFR2 exerts an oncogenic effect when stimulated by fibroblast growth factors (FGFs) or FGFR2 alterations [16, 17]. FGFR2 is highly expressed in pancreatic and colorectal cancer, leading to cell proliferation [18, 19]. Based on this evidence, we hypothesized that FGFR2 amplification is associated with FGFR2 expression, resulting in aggressive tumors and poorer patient outcomes. We also examined FGFR2 as a potentially therapeutic target for EGJ adenocarcinoma.
Therefore, we here investigate the relationships between FGFR2 amplification and FGFR2 expression, and examine whether FGFR2 expression plays an oncogenic role in EGJ adenocarcinoma. For this purpose, we accessed a database of 176 patients with EGJ adenocarcinoma. Our findings suggest that FGFR2 can be a substantial therapeutic target as well as a biomarker for FGFR targeting therapy, in EGJ adenocarcinoma.
RESULTS
The associations among FGFR2 amplification, FGFR2 mRNA, and FGFR2 expression in EGJ adenocarcinoma cell lines
We examined whether FGFR2 amplification correlates with FGFR2 mRNA and FGFR2 expression in the five kinds of human EGJ adenocarcinoma cell lines, namely OACM5.1C, OE19, OE33, SK-GT-4 and FLO-1. The correlation was found in three of the cell lines (OACM5.1C, SK-GT-4, and FLO-1) (Figure 1A–1C), but not in OE19 and OE33.
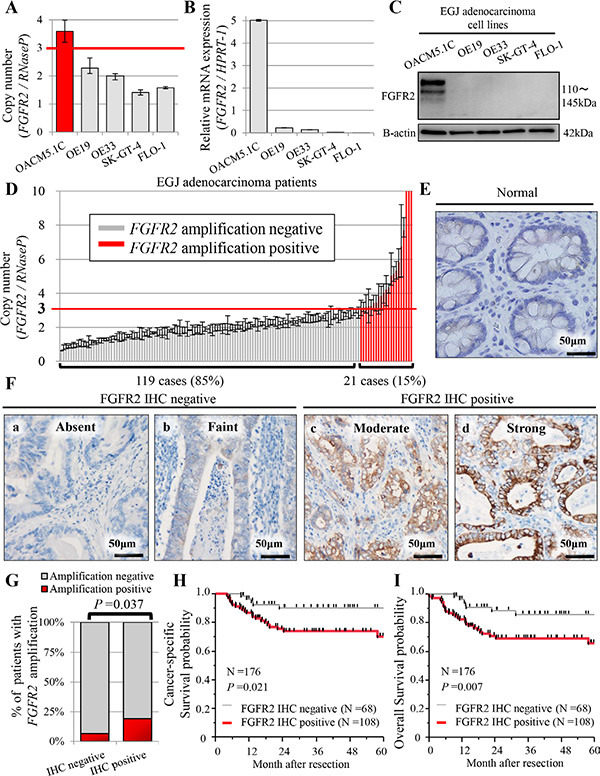
Figure 1: Profiles of FGFR2 status in five human EGJ adenocarcinoma cell lines (A–C), and in patients with EGJ adenocarcinoma (N = 176) (D–I). (A) FGFR2 copy number obtained in real-time PCR assay; (B) mRNA expression by qRT-PCR assay; (C) FGFR2 expression by western blot analysis; (D) Distributions of FGFR2 copy number (N = 140). For FGFR2 amplification, the copy number gain must exceed 3.0 copies. FGFR2 amplification was observed in 21 cases (21/140 = 15%); (E) FGFR2 was not expressed in normal glandular epithelium; (F) (a, b) Cases with absent or faint FGFR2 staining were assessed as FGFR2 IHC-negative; (c, d) cases with moderate or strong FGFR2 staining were FGFR2 IHC-positive; (G) Association between FGFR2 IHC positivity and FGFR2 amplification; (H) Cancer-specific survival in positive and negative FGFR2 IHC cases; (I) Overall survival in positive and negative FGFR2 IHC cases.
The FGFR2 copy number exceeded 2 in OACM5.1C (copy number 3.59 ± 0.39) and OE19 (copy number 2.28 ± 0.27). In OACM5.1C cells only, FGFR2 amplification was correlated with high FGFR2 expression and with FGFR2 mRNA (Figure 1A–1C). Although the FGFR2 copy number was relatively high in the OE19 cell line, it was not associated with FGFR2 mRNA or FGFR2 expression (Figure 1A–1C). Based on these findings, we set the cut-off value for FGFR2 amplification as 3.0. In the other cell lines, the FGFR2 copy number was 2 or lower; namely, OE33 (copy number 2.00 ± 0.11), SK-GT-4 (copy number 1.41 ± 0.09), and FLO-1 (copy number 1.58 ± 0.04), correlating with low levels of FGFR2 mRNA and FGFR2 expression (Figure 1A–1C). Therefore, for investigating the oncogenic effect of FGFR2 in EGJ adenocarcinoma cell lines, we adopted OACM 5.1C and FLO-1 as high and low expressers of FGFR2, respectively.
Clinicopathological factors and statuses of FGFR2 amplification and FGFR2 IHC
We successfully extracted the tumor DNA from 145 cases with sufficient tumor area on the slides (145/176 = 82%), and assayed the FGFR2 copy number in 140 cases (140/145 = 97%) (Supplementary Figure 1). Twenty-one (21/140 = 15%) of these assays tested positive for amplification (> 3.0 copies, Figure 1D, Table 1). FGFR2 amplification by real-time PCR based method was concordant with that by FISH, in the two selected cases (Figure 2). FGFR2 amplification was not associated with any clinicopathological factors (Table 1).
Table 1: Associations between FGFR2 positivity and clinicopathological factors in EGJ adenocarcinoma patients with tumor resection
|
FGFR2 amplification |
FGFR2 IHC |
||||
|---|---|---|---|---|---|---|
Negative |
Positive |
P value |
Negative |
Positive |
P value |
|
No. patients (%) |
119 (85%) |
21 (15%) |
|
68 (39%) |
108 (61%) |
|
Age |
|
|
0.971 |
|
|
0.520 |
Mean ± SD |
68 ± 12 |
67 ± 12 |
|
67 ± 11 |
69 ± 12 |
|
Sex |
|
|
1.000 |
|
|
0.308 |
Male |
96 (81%) |
17 (81%) |
|
51 (75%) |
88 (81%) |
|
Female |
23 (19%) |
4 (19%) |
|
17 (25%) |
20 (19%) |
|
Siewert classification |
|
|
0.945 |
|
|
0.025 |
I |
20 (17%) |
4 (19%) |
|
5 (7%) |
24 (22%) |
|
II |
25 (21%) |
4 (19%) |
|
18 (27%) |
23 (21%) |
|
III |
74 (62%) |
13 (62%) |
|
45 (66%) |
61 (57%) |
|
Tumor depth |
|
|
0.689 |
|
|
< 0.001 |
T1 |
37 (31%) |
6 (29%) |
|
42 (62%) |
23 (21%) |
|
T2 |
19 (16%) |
2 (9%) |
|
13 (19%) |
10 (9%) |
|
T3 |
46 (39%) |
8 (38%) |
|
9 (13%) |
52 (48%) |
|
T4 |
17 (14%) |
5 (24%) |
|
4 (6%) |
23 (22%) |
|
Tumor size (mm) |
|
|
0.919 |
|
|
0.110 |
Mean ± SD |
54 ± 7 |
56 ± 16 |
|
45 ± 10 |
67 ± 8 |
|
Lymph node metastasis |
|
|
0.286 |
|
|
< 0.001 |
Negative |
66 (55%) |
9 (43%) |
|
53 (78%) |
49 (45%) |
|
Positive |
53 (45%) |
12 (57%) |
|
15 (22%) |
59 (55%) |
|
Distant metastasis |
|
|
0.990 |
|
|
0.030 |
Negative |
108 (91%) |
19 (90%) |
|
66 (97%) |
94 (87%) |
|
Positive |
11 (9%) |
2 (10%) |
|
2 (3%) |
14 (13%) |
|
Histopathological types |
|
|
0.305 |
|
|
0.235 |
Well-moderate |
80 (67%) |
17 (81%) |
|
52 (76%) |
73 (68%) |
|
Poorly |
39 (33%) |
4 (19%) |
|
16 (24%) |
35 (32%) |
|
In multiple-hypothesis testing, the significant P value was adjusted to P = 0.05/16 = 0.003. Thus, a P value between 0.05 and 0.003 should be regarded as borderline significant.
EGJ, esophagogastric junction; FGFR2, fibroblast growth factor receptor 2; IHC, immunohistochemistry; SD, standard deviation. N = 176.
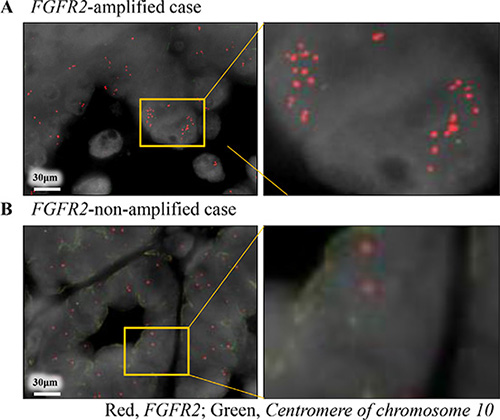
Figure 2: Dual-color fluorescence in situ hybridization coincided with the results of copy number assay by real-time PCR reaction. Red and green signals indicate FGFR2 gene and centromere of chromosome 10 probes, respectively. (A) FGFR2-amplified case obtained by real-time PCR reaction; (B) FGFR2-non-amplified case obtained by real-time PCR reaction.
FGFR2 expression was investigated by IHC staining of all cases (N = 176). FGFR2 was expressed heterogeneously in the membranes of tumor cells, but not in that of normal epithelial cells (Figure 1E, 1F, Supplementary Figure 2). The FGFR2 IHC assay was positive in 108 cases (108/176 = 61%), and significantly associated with FGFR2 amplification (P = 0.037) (Figure 1G). In 108 FGFR2-positive cases, the mean percentage of FGFR2-positivity was 57 ± 22% of the tumor (range, 5% to 100%), indicating heterogeneous FGFR2 expression in EGJ adenocarcinoma (Supplementary Figure 2). In 21 cases with FGFR2 amplification, 16 cases (16/21 = 76.2%) were positive for FGFR2 IHC. FGFR2 IHC positivity was also significantly associated with tumor depth and lymph node metastasis (all P < 0.001, Table 1) [Bonferroni-corrected P < 0.003 (= 0.05/16)]. Notably, tumor depth was significantly related to FGFR2 IHC positivity in the multivariate logistic analysis (multivariate odds ratio = 4.57; 95% confidence interval 1.99-11.02; P < 0.001, Table 2) [Bonferroni-corrected P < 0.004 (= 0.05/14)]. There was no association between FGFR2 amplification status and clinicopathological factors (Supplementary Table 2).
Table 2: Univariate and multivariate logistic analysis of FGFR2 IHC status in EGJ adenocarcinoma patients with tumor resection
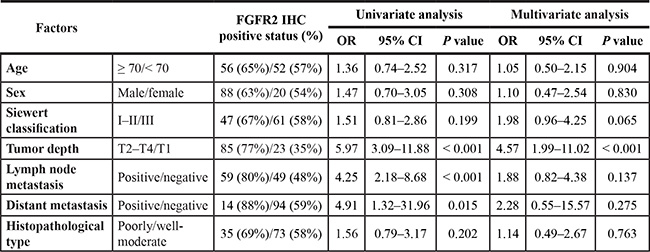
In multiple-hypothesis testing, the significant P-value was adjusted to P = 0.05/14 = 0.004. Thus, a P value between 0.05 and 0.004 should be regarded as borderline significant.
CI, confidence interval; EGJ, esophagogastric junction; FGFR2, fibroblast growth factor receptor 2; OR, odds ratio. N = 176.
FGFR2 amplification status, FGFR2 IHC status, and patient outcome
The 5-year CSS probabilities were 81.7% and 81.1% in cases testing positive and negative for FGFR2 amplification, respectively. The respective 5-year OS probabilities were 71.4% and 75.9%. FGFR2 amplification status was not associated with patient outcome (Supplementary Figure 3).
The 5-year CSS probabilities were 70.1% and 90.2% in FGFR2 IHC-positive and negative cases, respectively, with corresponding 5-year OS probabilities of 65.7% and 85.8%. The CSS was poorer in patients with FGFR2 IHC-positive tumors, but the significance was borderline (P =0.021, Figure 1H). The OS, however, was considerably worse in patients with positive FGFR2 IHC tumors than in their negative-testing counterparts (P = 0.007; significant at the P = 0.0125 (0.05/4) level; Figure 1I). In the survival analysis according to combinations of FGFR2 amplification and FGFR2 expression, the patients with FGFR2-amplified/FGFR2-IHC-positive tumor seemed to experience worse outcomes compared to the other groups, but there was no significant difference (Supplementary Figure 4).
Proliferation, cell cycle and apoptosis assays of FGFR2 knockdown cell line
Given the significant relationship between FGFR2 IHC positivity and tumor depth, we hypothesized that FGFR2 expression accelerates tumor cell proliferation. To test this hypothesis, we assayed the cell proliferation by RNA interference. Both of the synthetic siRNAs targeting FGFR2 effectively suppressed FGFR2 expression in the OACM5.1C cell line (Figure 3A). In this cell line, which overexpresses FGFR2, the siRNA-mediated knockdown of FGFR2 significantly suppressed the cell proliferation in a time-dependent manner (Figure 3B). Because PI3K-AKT and RAS-ERK are major downstream pathways of FGFR2, de-phosphorylation of AKT and ERK was examined under FGFR2 knockdown. Compared with the control siRNA, phosphorylated-AKT and phosphorylated-ERK were suppressed by FGFR2 knockdown in OACM5.1C (Figure 3A). These results suggest that de-phosphorylation of ERK and AKT governs the strong association between FGFR2 expression and tumor cell proliferation. To investigate the underlying mechanism of FGFR2-mediated proliferation, we examined the effect of FGFR2 on cell cycle and apoptosis. According to the cell cycle analysis at 72 h after FGFR2 knockdown by siRNAs, the FGFR2-overexpressing OACM5.1C tumor cells were significantly accumulated in the G0/G1 phase population (P < 0.05), and concomitantly decreased in the G2/M phase population (P < 0.05) (Figure 3C, 3D). At the same time point, the number of apoptotic cells had significantly increased (P < 0.05, Figure 3E, 3F), thereby increasing the sub-G1 phase population (P < 0.05, Figure 3G).
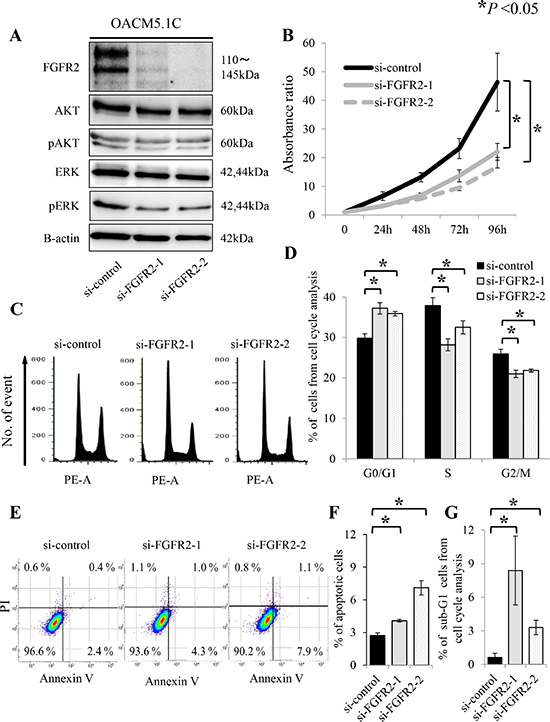
Figure 3: FGFR2 knockdown induces de-phosphorylation of AKT and ERK, and suppresses cell proliferation, through anti-apoptosis and cell cycle arrest in the FGFR2-expressing cell line OACM5.1C. (A) De-phosphorylation of AKT and ERK after FGFR2 knockdown by siRNAs targeting FGFR2 (si-FGFR2); (B) Cell proliferation after transfection with si-control or si-FGFR2s; (C) Distributions of cell cycle populations; (D) Proportions (%) of G0/G1, S, and G2/M cells in the cell cycle distribution; (E) Distributions of apoptotic cells; (F) Apoptotic cells, identified as positive for Annexin V and negative for propidium iodide (PI); (G) Proportions (%) of sub-G1 cells in the cell cycle distribution. Panels (D), (F) and (G) show the results at 72 h after transfection with si-control or si-FGFR2s. *P < 0.05.
Proliferation, cell cycle and apoptosis assays of FGFR2-stable transfected cell line
To examine the effects of FGFR2 overexpression, FGFR2IIIb-AcGFP1 coding vectors were transfected into the FLO-1 cell line, which neither amplifies FGFR2 nor expresses FGFR2. FGFR2-stable transfectants were validated by their GFP expression (Figure 4A). FGFR2 overexpression was confirmed by western blot analysis (Figure 4B).
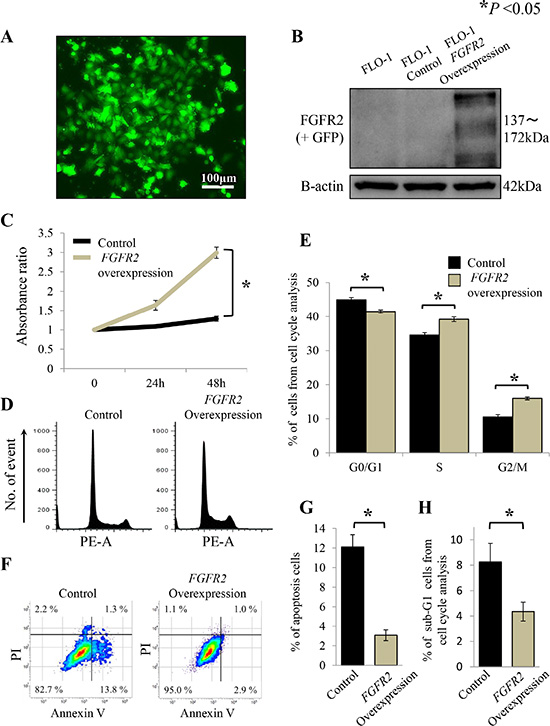
Figure 4: FGFR2 overexpression promotes cell proliferation through cell cycle progression and anti-apoptosis in FLO-1 cells stably transfected with FGFR2. (A) FLO-1 cells stably transfected with FGFR2 were confirmed by GFP expression; (B) FGFR2 overexpression was confirmed by western blot analysis; (C) Cell proliferation of FGFR2 overexpressing cells; (D) Distributions of cell cycle populations; (E) Proportions (%) of G0/G1, S, and G2/M in the cell cycle distribution; (F) Distributions of apoptotic cells; (G)Apoptotic cells, identified as positive for Annexin V and negative for propidium iodide (PI); (H) Proportions (%) of sub-G1 cells in the cell cycle distribution. *P < 0.05.
In the proliferation assay, FGFR2-overexpressing FLO-1 cells exhibited significantly higher growth over time than cells not transfected with FGFR2 (P < 0.05, Figure 4C). Moreover, in the cell cycle analysis, the G0/G1 phase population of the FGFR2-overexpressing cells was significantly decreased, while the G2/M phase population significantly accumulated (P < 0.05, Figure 4D, 4E), relative to the non-transfected control cells. FGFR2 overexpression was also inversely associated with cell apoptosis (P < 0.05, Figure 4F, 4G), thereby decreasing the sub-G1 phase population (P < 0.05, Figure 4H).
Anti-proliferative effects of a pan-FGFR inhibitor AZD4547
We next investigated whether pan-FGFR inhibitor AZD4547 can therapeutically target the EGJ adenocarcinoma cell line OACM5.1C, which overexpresses FGFR2. For this purpose, we altered the phosphorylated-AKT and phosphorylated-ERK expressions in OACM5.1C cells, and assayed the cell proliferation. Because OACM5.1C cells express low basal levels of phosphorylated-AKT (Figure 3A), these assays were also performed under FGFR2 activation stimulated by FGF7.
In the proliferation assay, AZD4547 significantly suppressed the tumor cell growth (P < 0.05, Figure 5A). FGF7 stimulation yielded a similar result (P < 0.05, Figure 5A). AZD4547 treatment clearly de-phosphorylated the ERK, regardless of FGF7 stimulation. However, the change in the de-phosphorylated AKT was more evident under FGF7 stimulation than under no stimulation (Figure 5B). Importantly, selective inhibition of FGFR2 by siRNAs yielded similar results (Figure 5C, 5D).
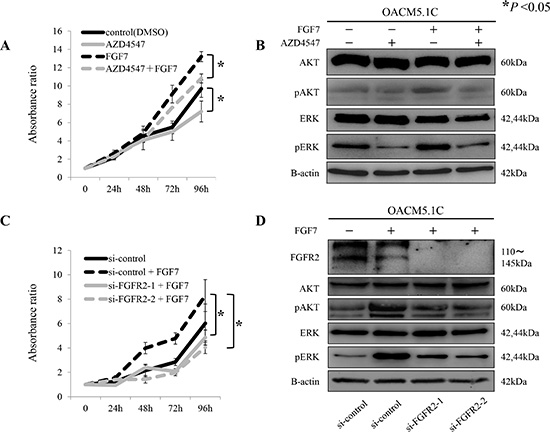
Figure 5: Proliferative inhibition of tumor cells by the pan-FGFR inhibitor AZD4547, and by siRNAs targeting FGFR2, through de-phosphorylation of AKT and ERK. (A) Proliferation assay of tumor cells exposed to AZD4547 with and without FGF7 stimulation; (B) De-phosphorylation of AKT and ERK by AZD4547, with and without FGF7 stimulation; (C) Proliferation assay using siRNAs targeted against FGFR2 (si-FGFR2), with and without FGF7 stimulation; (D) De-phosphorylation of AKT and ERK after FGFR2 knockdown by si-FGFR2, with and without FGF7 stimulation. *P < 0.05.
DISCUSSION
This study examined the relationship between FGFR2 amplification and FGFR2 expression. FGFR2 copy number was amplified in 21 (15%) of the 140 assayed EGJ adenocarcinoma cases, and FGFR2 expression was elevated in 108 cases (61%) of the 176 cases assayed by IHC. Although FGFR2 amplification was correlated with FGFR2 expression, only the latter was strongly correlated with tumor depth and patient outcome. Supporting these clinical findings, FGFR2 expression was associated with tumor cell proliferation, and also with cell cycle progression and anti-apoptosis. In addition, the pan-FGFR inhibitor AZD4547 suppressed EGJ adenocarcinoma growth through de-phosphorylation of AKT and ERK. Similar results were obtained in FGFR2 inhibition by a selective siRNA technique. These findings support FGFR2 as a therapeutic target for EGJ adenocarcinoma.
Genomic aberrations of FGFR2 reportedly lead to tumorigenicity through the FGF-FGFR2 signaling axis, and are strongly correlated with patient outcomes [20, 21]. Although FGFR2 amplification has been examined in diffuse-type gastric cancer [16, 22], its relation to clinicopathological factors and patient outcomes in EGJ adenocarcinoma has not been clarified. FGFR2 amplification may play different roles in distal gastric cancer and EGJ adenocarcinoma, as the two cancers exhibit different biology. First, GERD is more closely associated with EGJ adenocarcinoma than with distal gastric cancer. EGJ adenocarcinoma often arises from excessive gastric acid exposure through esophageal reflux, and is not associated with Helicobacter pylori infection [23]. Gastric cancer, however, arises in an atrophic gastritis setting, with reduced output of gastric acid. Second, diffuse histology is much less common in EGJ tumors than in distal gastric cancer. Finally, the prognosis is worse in EGJ adenocarcinoma than in distal gastric cancer [24, 25]. Our study found no association between FGFR2 amplification and histological tumor type or patient outcome in EGJ adenocarcinoma. These results contrast with the reported characteristics of FGFR2 amplification in gastric cancer.
FGFR2 amplification has been reported in 4.1–7.2% of gastric cancer cases [16, 22, 26], and in 4.0% of triple-negative breast cancer cases [27]. In the present study, FGFR2 was amplified in 15% (21/140) of the investigated EGJ adenocarcinoma cases, higher than in previous reports. These differences may have arisen from our use of a single reference (RNaseP) in the copy number assay. Nonetheless, in our copy number assay, FGFR2 amplification status and FGFR2 expression status in the five tested cell lines correlated well with the clinical features of EGJ adenocarcinoma. In addition, our measured PCR-based copy numbers were concordant with FISH [28, 29], and are clinically useful [22, 30, 31].
Although FGFR2 amplification was associated with FGFR2 IHC positivity, FGFR2 IHC positivity, but not FGFR2 amplification, strongly correlated with tumor aggressiveness, and patient outcome in this study. This discrepancy may be explained by the epigenetic or transcriptional regulation of FGFR2 expression. In thyroid cancer, FGFR2 expression is controlled by methylation of the DNA promoter [32]. Some recent reports have shown that microRNAs suppress the expression of RTKs such as HER2 [33]. Specifically, miR125b controls FGFR2 expression in dermatological disease [34]. Considering that miR125b regulates HER2 in gastric cancer [33], we would expect further comprehensive miRNA assays may reveal the underlying mechanism of transcriptional regulation of FGFR2 in EGJ adenocarcinoma. The regulation of FGFR2 expression in EGJ adenocarcinoma requires further investigation.
In the present study, FGFR2 expression was strongly associated with the depth of invading tumor and with poor outcome. Paterson et al. reported the prevalence of FGFR2 overexpression in esophageal adenocarcinoma as 34% (124/367 cases). They found no association between FGFR2 overexpression and patient outcome [35]. Moreover, their proportion of FGFR2 overexpression was far less than ours (34% vs. 61%), although both studies used the same antibody. We attribute this discrepancy to the intra-tumor heterogeneity of FGFR2 expression. Whereas we stained cross-sections in the FGFR2 IHC assay, Paterson et al. stained tissue arrays (diameter 0.6 mm). We suspect that cross-sections more likely represent the overall FGFR2 expression status than tissue array.
According to our experimental data, FGFR2-expressing EGJ adenocarcinoma cell lines were sensitive to a pan-FGFR inhibitor of AZD4547. These results were exactly reproduced by selective FGFR2 inhibition by siRNAs. In EGJ adenocarcinoma, the FGF-FGFR2 signaling axis may be a crucial pathway in tumor progression; thus, this cancer may be adequately managed by an FGFR2-specific inhibitor. Moreover, FGFR2 expression may be a better biomarker of tumor aggressiveness in EGJ adenocarcinoma than FGFR2 amplification. To the best of our knowledge, there is no clinical study examining FGFR-inhibitor focusing on the patients with EGJ adenocarcinoma alone. A recent phase II clinical trial of SHINE study compared AZD 4547 with paclitaxel in previously treated cases of advanced gastric or EGJ cancer. In their study, despite that FGFR2 amplification status has been used to select likely responders to AZD4547 treatment, the clinical responses were not impressive [36]. One possible explanation may be their methodology for FGFR2 amplification, and FGFR2 expression testing. FGFR2 amplification status was 9%, which was confirmed by FISH testing. In those FGFR2 amplified case, FGFR2 expression was observed in only 21%, which was much lower than 76.2% (16/21 cases) that we observed in our study. Further study would be needed for more adequate assays for FGFR2 amplification or FGFR2 expression.
Our study is limited by its retrospective design. Nonetheless, our present experimental results convincingly support the clinical findings. The role of oncogenic amplification in esophageal or EGJ adenocarcinoma has recently received much attention [12–15]. This study focused on the mechanistic role of FGFR2 amplification in EGJ adenocarcinoma. To confirm our findings, we require evidence from large-scale prospective studies.
In conclusion, we found that (i) FGFR2 amplification is associated with FGFR2 expression, and (ii) FGFR2 expression, but not FGFR2 amplification, is associated with depth of tumor invasion and poorer outcomes in EGJ adenocarcinoma. Our data emphasize that FGFR2 can be a therapeutic target for EGJ adenocarcinoma.
MATERIALS AND METHODS
Cell lines and culture
Five EGJ adenocarcinoma cell lines, OACM5.1C, OE19, OE33, SK-GT-4 and FLO-1, were purchased from the European Collection of Cell Cultures (ECACC; Salisbury, UK). FLO-1 was cultured in DMEM (Sigma-Aldrich, St Louis, MO, USA) containing 10% fetal bovine serum (FBS) in a 5% CO2 air-humidified atmosphere at 37°C. The other cell lines (OACM5.1C, OE19, OE33 and SK-GT-4) were cultured in RPMI-1640 (Life Technologies, Carlsbad, CA, USA) under the same conditions, according to the manufacturer’s recommendations.
Patients and study design
The study subjects were 176 consecutive chemotherapy-naive patients with EGJ adenocarcinoma (Siewert type I-III), whose formalin fixed paraffin-embedded (FFPE) archival tissues were available. These patients were treated at Kumamoto University Hospital (Kumamoto, Japan) from February 2000 to March 2014 (N = 112), or at Kyushu University Hospital (Fukuoka, Japan) from April 2005 to February 2014 (N = 64). There were 139 (139/176 = 79%) men and 37 (37/176 = 21%) women. The median age of the patients was 69 (range 36-89 years). Surgical resection and endoscopic submucosal dissection (ESD) was performed in 168 (168/176 = 96%) and eight (8/176 = 4%) cases, respectively. Of the 168 surgically resected cases, 152 (152/168 = 90%) underwent surgery with curative intent, and 16 (16/168 = 10%) with palliative intent. Treatment dates were retrospectively obtained from the patients’ records. Patients were observed until death or 30 January 2015, whichever came first. The mean follow-up time in the survival analysis dataset was 32.1 months (range 1–117 months). Disease staging was based on the Union for International Cancer Control classification (7th edition) of esophageal cancer. Use of the clinical data was approved by the human ethics review committee of the Graduate School of Medicine, Kumamoto University and by Kyushu University (Institutional Review Board numbers; 858 for Kumamoto University and 27–27 for Kyushu University).
DNA extraction
FFPE tissue specimens were collected from each resected case, and the tumor DNA was extracted. Tumor lesions on hematoxylin and eosin-stained slides without coverslips were marked by a pathologist (YI). Each marked area was scraped by the macro-dissection method, and tissue DNA was isolated using an FFPE Kit (Qiagen, Hilden, Germany) [37]. In 31 of the 176 cases, the tumors were too small to be extracted. Finally, tumor DNA was successfully isolated from 145 cases (145/176 = 82%, Supplementary Figure 1). DNA extraction from the cell lines was performed with a QIAmp DNA Mini Kit (Qiagen). The DNA concentration was measured by NanoDrop2000 (Thermo Scientific, Waltham, MA, USA).
Copy number assay for FGFR2
Copy number assay was performed by a real-time PCR reaction. The copy number of FGFR2 was quantified relative to a reference assay using ribonuclease P (RNase P) as previously reported [22,30,31]. Tumor DNA was analyzed with TaqMan Copy Number Assays (Life Technologies) using Hs05182482_cn (intron 14 of FGFR2, amplicon length 80 bp; Life Technologies) as primers. Similarly, the copy number of RNaseP was assayed by TaqMan Copy Number Reference Assays (Life Technologies) [38]. Real-time PCR reaction was performed by the 7900HT Fast Real-Time PCR System (Life Technologies). Into each well, we deposited 5 μl of TaqMan genotyping master mix, 10 ng of genomic DNA and 0.5 μl of each primer (total volume = 10 μl). The PCR conditions consisted of initial denaturing at 95°C for 10 min, 40 cycles of 95°C for 15 s and 60°C for 1 min. The data were analyzed by the software packages SDS 2.4 (Life Technologies) and Copy Caller (Life Technologies).
Fluorescence in situ hybridization
Dual-color FISH analysis was performed on formalin-fixed paraffin-embedded (FFPE) tissue. After deparaffinization and dehydration, the sections of FFPE tissue were digested in 0.1 N HCl for 8–12 min, and then washed in phosphate-buffered saline (PBS) for 5 min at room temperature. FISH FGFR2 probe was labeled with bacterial artificial chromosomes (BACs), RP11-7P17, RP11-984I17, RP11-78A18, RP11-615K11 and RP11-62L18, which were labeled with Cy3 (Chromosomescience laboratory, Sapporo, Japan). FISH chromosome 10 centromere (CEN10) was labeled with BACs RP11-300L24, RP11-178A10, RP11-110L24, and RP11-379D20, which were labeled with FITC (Chromosomescience laboratory, Sapporo, Japan). After dehydration and dry up, each FISH probe was applied to each targeted area, and then the slides were sealed with coverslips. The section was denatured at 90°C for 10 min, followed by overnight hybridization at 37°C in a wet chamber. Hybridized slides were washed in 2x saline-sodium citrate buffer (SSC), and then coverslips were removed gently. The slides were stringently washed in 50% formamide/2x SSC for 20 min at 37°C, and the kept in 1× SSC for 15 min at room temperature. The slides were incubated with anti-FITC-Alexa488 in blocking reagent for 60 min at 37°C. After post-hybridization washing, the slides were counterstained with 4′,6-diamidino-2-phenylindole (DAPI). The FISH images were captured with a fluorescence microscope (BZ-X710, Keyence, Japan).
Quantitative real-time reverse transcription-polymerase chain reaction
The FGFR2-mRNA expression level was measured in triplicate and calculated as the fold change relative to a reference gene using the TaqMan (Life Technologies) primer-probe sets, according to the manufacturer’s protocol. Results were normalized by the relative expression levels of hypoxanthine phosphoribosyltransferase 1 (HPRT-1). All quantitative real-time reverse transcription-polymerase chain reactions (qRT-PCRs) for mRNA were run on the Light Cycler 480 System II (Roche Diagnostics, Basel, Switzerland). The relative amounts of genes were measured by the 2−ΔΔCT method. The sequences of the primers used in this study are listed in Supplementary Table 1.
Western blot analysis
Each protein sample was subjected to sodium dodecyl sulfate-polyacrylamide gel electrophoresis, transferred to a nitrocellulose membrane, and exposed to primary antibodies. Signals were detected by incubation with secondary antibodies labeled using the ECL Detection System (GE Healthcare, Little Chalfont, UK). The primary antibodies, FGFR2 (#11835s), AKT (#9272), phospho-AKT Ser473 (#9271), ERK1/2 (#9102), phospho-ERK1/2 Thr202/Tyr204 (#4376) and Β-actin (#4967s), were purchased from Cell Signaling Technology (Danvers, MA, USA).
Immunohistochemical staining of FGFR2 expression
Immunohistochemical (IHC) staining was performed on 4-μm FFPE sections. Each section was autoclaved in 10 mmol/L citrate buffer (pH 6.0) for 15 min, and endogenous peroxidase activity was blocked by adding 3% hydrogen peroxide for 5 min. The sections were then incubated overnight with 1:1000 (in 0.1 mol/L phosphate-buffered saline) diluted primary mouse monoclonal anti-FGFR2 antibody (ab58201, Abcam, Cambridge, UK) at 4°C, followed by incubation with a biotin-free horseradish peroxidase-labeled polymer (Envision Plus detection system; Dako, Glostrup, Denmark) for 1 h at room temperature. The reaction was visualized by diaminobenzidine solution and hematoxylin counterstaining. Two pathologists (YI and YN, who were blinded to the other data) recorded the membranous and cytoplasmic FGFR2 expression in the cancer cell, scoring absent, faint, moderate, or strong staining, respectively. FGFR2-IHC positive was assigned for the cases with moderate-strong staining, and negative for those with absent or faint staining, which was the same as previously reported [35]. The value of kappa was 0.91 (P < 0.001), indicating almost perfect agreement. For positive cases, we also scored percentage of positivity in the tumor. The concordance between the two observers was measured using kappa statistics.
Chemical compounds
A pan-FGFR inhibitor AZD4547 was purchased from AdooQ BioScience (Irvine, Carlsbad, CA, USA). For in vitro experiments, AZD4547 was prepared in dimethyl sulfoxide (DMSO). FGF7 was purchased from Wako (Osaka, Japan).
Small-interfering RNAs-mediated FGFR2 depletion
Two individual FGFR2-specific small-interfering RNAs (siRNAs) were chemically synthesized to target different regions of FGFR2 (s5174 and s5175, Life Technologies). As the negative control, we used a silencer select RNAi negative control (Life Technologies). Cells were seeded at 1 × 10⁶ cells in a electroporation chamber (CUY 532, 3 mm × 10 mm × 5 mm; Nepagene, Chiba, Japan), and 100 μl of siRNA (10 nmol/L, diluted by Opti-MEM) was added. Electroporation was performed by applying two square pulses (175 V) of 5 ms duration. The pulses were separated by a 50-ms interval, and provided by a pulse generator NEPA21-S (Nepagene), as described previously [39, 40]. After 6 h, the medium for the electroporated cells was replaced with fresh medium. At 72 h after electroporation, the cells were harvested and used in the following assays.
Construction of stable FGFR2 transfectant
The cDNA clone encoding full-length human FGFR2IIIb was obtained using a gene-specific RT primer and a PCR primer from the RNA of MCF7. FGFR2IIIb cDNAs were subcloned into the modified pIRESpuro3 vector containing the AcGFP1 coding sequence at the cut sites Nhe I and Xho I. All sequences were confirmed by direct sequencing. The FGFR2IIIb-AcGFP1 lesion was transfected to the targeted cell by electroporation. The stable transfectants were selected using 1 μg/ml puromycin.
Cell proliferation assay
Cells were seeded at 3000 cells per well in a 96-well plate, and provided with fresh medium each day. After treatment with siRNA or chemicals, the number of viable cells was counted using a Cell Counting Kit-8 (CCK-8; Dojin Laboratories, Kumamoto, Japan) and an automatic microplate reader (Molecular Devices, Sunnyvale, CA, USA) at five time-points: 0, 24, 48, 72, and 96 h after seeding, following the manufacturers’ instructions.
Apoptosis assay, and cell cycle analysis by flow cytometry
Transfected cells were seeded at 1 × 10⁶ cells in 100-mm-diameter dishes. After 72 h incubation, the cells were subjected to apoptosis assay and cell cycle analysis. Phosphatidylserine externalization in the apoptosis assay was detected by Annexin V (Millipore, Billerica, MA, USA) and propidium iodide (PI) (Sigma-Aldrich) staining. Cells in the early phase of apoptosis stained positive for Annexin V and negative for PI. Cell cycles were analyzed by flow cytometry in a BD FACS Verse flow cytometer (BD Biosciences, San Jose, CA, USA). The cells were diluted to 1 × 10⁶/ml, and fixed by overnight immersion in 70% ethanol at -20°C. Subsequently, the cells were pelleted by centrifugation and re-suspended in phosphate-buffered saline containing 1 μg/ml RNase A (Sigma-Aldrich) and 100 μg/ml PI. The distribution of cells in different phases of the cell cycle was calculated by FlowJo software (TOMY Digital Biology, Tokyo, Japan).
Statistical analysis
Statistical analyses were performed by JMP version 10 (SAS Institute Inc., Cary, NC, USA) and Excel 2010 (Microsoft, Redmond, WA, USA) software. All of the above experiments were triplicated, and the continuous data are shown as the mean ± standard deviation (SD). The associations between clinicopathological factors and FGFR2 amplification status (negative vs. positive) or FGFR2 IHC (negative vs. positive) were identified in univariate analyses. Categorical data (sex, tumor location by Siewert classification, tumor depth, lymph node metastasis, distant metastasis, and histopathological types) were analyzed by χ2 test (case number ≥ 5) or Fisher’s exact test (case number < 5); continuous data (age at resection, and tumor size) were analyzed by Student’s t-test. The relationships between clinicopathological factors and FGFR2 expression were assessed by a multivariate logistic regression model. We initially included age (≥ 70 vs. <70), sex (male vs. female), tumor location by Siewert classification (I–II vs. III), tumor depth (T2–T4 vs. T1), lymph node metastasis (positive vs. negative), distant metastasis (positive vs. negative), and histopathological types (poorly moderated vs. well moderate). Survival analysis related to FGFR2 amplification or FGFR2 IHC status was performed by the Kaplan-Meier method and log-rank test.
The correlation between FGFR2 amplification status and FGFR2 IHC status was considered significant at the P = 0.05 level. The association between FGFR2 amplification/FGFR2 IHC status and two kinds of patient prognosis [cancer-specific survival (CSS), and overall survival (OS)] was considered significant at the P = 0.0125 level (= 0.05/4). During multiple hypothesis testing of the associations between FGFR2 amplification/FGFR2 IHC status and the remaining seven clinicopathological factors, we adjusted the significant P value to 0.004 (0.05/14) by Bonferroni correction.
ACKNOWLEDGMENTS
We gratefully thank Yoko Ogata, Naomi Yokoyama, and Hiroko Taniguchi for their technical assistance.
Abbreviations
EGJ, esophagogastric junction; GERD, gastro-esophageal reflux disease; FGFR2, fibroblast growth factor receptor 2; FGF, fibroblast growth factor; FISH, fluorescence in situ hybridization; FFPE, formalin fixed paraffin embedded; ESD, endoscopic submucosal dissection; RNase P, ribonuclease P; qRT-PCR, quantitative real-time reverse transcription-polymerase chain reaction; HPRT-1, hypoxanthine phosphoribosyltransferase 1; IHC, immunohistochemical; DMSO, dimethyl sulfoxide; siRNA, small-interfering RNAs; PI, propidium iodide; SD, standard deviation; CSS, cancer-specific survival; OS, overall survival.
FUNDING
This work was supported by the YOKOYAMA Foundation for Clinical Pharmacology (YRY1310), and the Uehara Memorial Foundation.
CONFLICTS OF INTEREST
The authors have no conflicts of interest to declare.
REFERENCES
1. Edgren G, Adami HO, Weiderpass E, Nyren O. A global assessment of the oesophageal adenocarcinoma epidemic. Gut. 2013; 62:1406–1414.
2. Dikken JL, Lemmens VE, Wouters MW, Wijnhoven BP, Siersema PD, Nieuwenhuijzen GA, van Sandick JW, Cats A, Verheij M, Coebergh JW, van de Velde CJ. Increased incidence and survival for oesophageal cancer but not for gastric cardia cancer in the Netherlands. Eur J Cancer. 2012; 48:1624–1632.
3. Brown LM, Devesa SS, Chow WH. Incidence of adenocarcinoma of the esophagus among white Americans by sex, stage, and age. J Natl Cancer Inst. 2008; 100:1184–1187.
4. Lagergren J, Lagergren P. Recent developments in esophageal adenocarcinoma. CA Cancer J Clin. 2013; 63:232–248.
5. Hur C, Miller M, Kong CY, Dowling EC, Nattinger KJ, Dunn M, Feuer EJ. Trends in esophageal adenocarcinoma incidence and mortality. Cancer. 2013; 119:1149–1158.
6. de Jonge PJ, van Blankenstein M, Grady WM, Kuipers EJ. Barrett’s oesophagus: epidemiology, cancer risk and implications for management. Gut. 2014; 63:191–202.
7. van Hagen P, Hulshof MC, van Lanschot JJ, Steyerberg EW, van Berge Henegouwen MI, Wijnhoven BP, Richel DJ, Nieuwenhuijzen GA, Hospers GA, Bonenkamp JJ, Cuesta MA, Blaisse RJ, et al. Preoperative chemoradiotherapy for esophageal or junctional cancer. N Engl J Med. 2012; 366:2074–2084.
8. Cunningham D, Allum WH, Stenning SP, Thompson JN, Van de Velde CJ, Nicolson M, Scarffe JH, Lofts FJ, Falk SJ, Iveson TJ, Smith DB, Langley RE, et al. Perioperative chemotherapy versus surgery alone for resectable gastroesophageal cancer. N Engl J Med. 2006; 355:11–20.
9. Bang YJ, Van Cutsem E, Feyereislova A, Chung HC, Shen L, Sawaki A, Lordick F, Ohtsu A, Omuro Y, Satoh T, Aprile G, Kulikov E, et al. Trastuzumab in combination with chemotherapy versus chemotherapy alone for treatment of HER2-positive advanced gastric or gastro-oesophageal junction cancer (ToGA): a phase 3, open-label, randomised controlled trial. Lancet. 2010; 376:687–697.
10. Wilke H, Muro K, Van Cutsem E, Oh SC, Bodoky G, Shimada Y, Hironaka S, Sugimoto N, Lipatov O, Kim TY, Cunningham D, Rougier P, et al. Ramucirumab plus paclitaxel versus placebo plus paclitaxel in patients with previously treated advanced gastric or gastro-oesophageal junction adenocarcinoma (RAINBOW): a double-blind, randomised phase 3 trial. Lancet Oncol. 2014; 15:1224–1235.
11. Fuchs CS, Tomasek J, Yong CJ, Dumitru F, Passalacqua R, Goswami C, Safran H, dos Santos LV, Aprile G, Ferry DR, Melichar B, Tehfe M, et al. Ramucirumab monotherapy for previously treated advanced gastric or gastro-oesophageal junction adenocarcinoma (REGARD): an international, randomised, multicentre, placebo-controlled, phase 3 trial. Lancet. 2014; 383:31–39.
12. Stachler MD, Taylor-Weiner A, Peng S, McKenna A, Agoston AT, Odze RD, Davison JM, Nason KS, Loda M, Leshchiner I, Stewart C, Stojanov P, et al. Paired exome analysis of Barrett’s esophagus and adenocarcinoma. Nat Genet. 2015; 47:1047–1055.
13. Ross-Innes CS, Becq J, Warren A, Cheetham RK, Northen H, O’Donovan M, Malhotra S, di Pietro M, Ivakhno S, He M, Weaver JM, Lynch AG, et al. Whole-genome sequencing provides new insights into the clonal architecture of Barrett’s esophagus and esophageal adenocarcinoma. Nat Genet. 2015; 47:1038–1046.
14. Dulak AM, Stojanov P, Peng S, Lawrence MS, Fox C, Stewart C, Bandla S, Imamura Y, Schumacher SE, Shefler E, McKenna A, Carter SL, et al. Exome and whole-genome sequencing of esophageal adenocarcinoma identifies recurrent driver events and mutational complexity. Nat Genet. 2013; 45:478–486.
15. Dulak AM, Schumacher SE, van Lieshout J, Imamura Y, Fox C, Shim B, Ramos AH, Saksena G, Baca SC, Baselga J, Tabernero J, Barretina J, et al. Gastrointestinal adenocarcinomas of the esophagus, stomach, and colon exhibit distinct patterns of genome instability and oncogenesis. Cancer Res. 2012;72:4383–4393.
16. Su X, Zhan P, Gavine PR, Morgan S, Womack C, Ni X, Shen D, Bang YJ, Im SA, Ho Kim W, Jung EJ, Grabsch HI, et al. FGFR2 amplification has prognostic significance in gastric cancer: results from a large international multicentre study. Br J Cancer. 2014; 110:967–975.
17. Brooks AN, Kilgour E, Smith PD. Molecular pathways: fibroblast growth factor signaling: a new therapeutic opportunity in cancer. Clin Cancer Res. 2012; 18:1855–1862.
18. Matsuda Y, Yoshimura H, Suzuki T, Uchida E, Naito Z, Ishiwata T. Inhibition of fibroblast growth factor receptor 2 attenuates proliferation and invasion of pancreatic cancer. Cancer Sci. 2014; 105:1212–1219.
19. Mathur A, Ware C, Davis L, Gazdar A, Pan BS, Lutterbach B. FGFR2 is amplified in the NCI-H716 colorectal cancer cell line and is required for growth and survival. PLoS One. 2014; 9:e98515.
20. Bai A, Meetze K, Vo NY, Kollipara S, Mazsa EK, Winston WM, Weiler S, Poling LL, Chen T, Ismail NS, Jiang J, Lerner L, et al. GP369, an FGFR2-IIIb-specific antibody, exhibits potent antitumor activity against human cancers driven by activated FGFR2 signaling. Cancer Res. 2010; 70:7630–7639.
21. Chang J, Liu X, Wang S, Zhang Z, Wu Z, Zhang X, Li J. Prognostic value of FGFR gene amplification in patients with different types of cancer: a systematic review and meta-analysis. PLoS One. 2014; 9:e105524.
22. Matsumoto K, Arao T, Hamaguchi T, Shimada Y, Kato K, Oda I, Taniguchi H, Koizumi F, Yanagihara K, Sasaki H, Nishio K, Yamada Y. FGFR2 gene amplification and clinicopathological features in gastric cancer. Br J Cancer. 2012; 106:727–732.
23. Mukaisho K, Nakayama T, Hagiwara T, Hattori T, Sugihara H. Two distinct etiologies of gastric cardia adenocarcinoma: interactions among pH, Helicobacter pylori, and bile acids. Front Microbiol. 2015; 6:412.
24. Amini N, Spolverato G, Kim Y, Squires MH, Poultsides GA, Fields R, Schmidt C, Weber SM, Votanopoulos K, Maithel SK, Pawlik TM. Clinicopathological features and prognosis of gastric cardia adenocarcinoma: a multi-institutional US study. J Surg Oncol. 2015; 111:285–292.
25. Saito H, Fukumoto Y, Osaki T, Fukuda K, Tatebe S, Tsujitani S, Ikeguchi M. Distinct recurrence pattern and outcome of adenocarcinoma of the gastric cardia in comparison with carcinoma of other regions of the stomach. World J Surg. 2006; 30:1864–1869.
26. Jung EJ, Min SY, Kim MA, Kim WH. Fibroblast growth factor receptor 2 gene amplification status and its clinicopathologic significance in gastric carcinoma. Hum Pathol. 2012; 43:1559–1566.
27. Turner N, Lambros MB, Horlings HM, Pearson A, Sharpe R, Natrajan R, Geyer FC, van Kouwenhove M, Kreike B, Mackay A, Ashworth A, van de Vijver MJ, et al. Integrative molecular profiling of triple negative breast cancers identifies amplicon drivers and potential therapeutic targets. Oncogene. 2010; 29:2013–2023.
28. D’Haene B, Vandesompele J, Hellemans J. Accurate and objective copy number profiling using real-time quantitative PCR. Methods. 2010; 50:262–270.
29. De Preter K, Speleman F, Combaret V, Lunec J, Laureys G, Eussen BH, Francotte N, Board J, Pearson AD, De Paepe A, Van Roy N, Vandesompele J. Quantification of MYCN, DDX1, and NAG gene copy number in neuroblastoma using a real-time quantitative PCR assay. Mod Pathol. 2002; 15:159–166.
30. Redon R, Ishikawa S, Fitch KR, Feuk L, Perry GH, Andrews TD, Fiegler H, Shapero MH, Carson AR, Chen W, Cho EK, Dallaire S, et al. Global variation in copy number in the human genome. Nature. 2006; 444:444–454.
31. Yu K, Fan J, Ding X, Li C, Wang J, Xiang Y, Wang QS. Association study of a functional copy number variation in the WWOX gene with risk of gliomas among Chinese people. Int J Cancer. 2014; 135:1687–1691.
32. Kondo T, Zheng L, Liu W, Kurebayashi J, Asa SL, Ezzat S. Epigenetically controlled fibroblast growth factor receptor 2 signaling imposes on the RAS/BRAF/mitogen-activated protein kinase pathway to modulate thyroid cancer progression. Cancer Res. 2007; 67:5461–5470.
33. Fassan M, Pizzi M, Realdon S, Balistreri M, Guzzardo V, Zagonel V, Castoro C, Mastracci L, Farinati F, Nitti D, Zaninotto G, Rugge M. The HER2-miR125a5p/miR125b loop in gastric and esophageal carcinogenesis. Hum Pathol. 2013; 44:1804–1810.
34. Xu N, Brodin P, Wei T, Meisgen F, Eidsmo L, Nagy N, Kemeny L, Stahle M, Sonkoly E, Pivarcsi A. MiR-125b, a microRNA downregulated in psoriasis, modulates keratinocyte proliferation by targeting FGFR2. J Invest Dermatol. 2011; 131:1521–1529.
35. Paterson AL, O’Donovan M, Provenzano E, Murray LJ, Coleman HG, Johnson BT, McManus DT, Novelli M, Lovat LB, Fitzgerald RC. Characterization of the timing and prevalence of receptor tyrosine kinase expression changes in oesophageal carcinogenesis. J Pathol. 2013; 230:118–128.
36. Yung-Jue Bang EVC, Wasat Mansoor, Russell D. Petty, Yee Chao, David Cunningham, David Ferry, Donal Landers, Paul Stockman, Neil R. Smith, Catherine Geh, Elaine Kilgour. A randomized, open-label phase II study of AZD4547 (AZD) versus Paclitaxel (P) in previously treated patients with advanced gastric cancer (AGC) with Fibroblast Growth Factor Receptor 2 (FGFR2) polysomy or gene amplification (amp): SHINE study. In 2015 American Society of Clinical Oncology (ASCO) Annual Meeting. 2015; Abstr 4014.
37. Morikawa T, Shima K, Kuchiba A, Yamauchi M, Tanaka N, Imamura Y, Liao X, Qian ZR, Brahmandam M, Longtine JA, Lindeman NI, Fuchs CS, et al. No evidence for interference of h & e staining in DNA testing: usefulness of DNA extraction from H & E-stained archival tissue sections. Am J Clin Pathol. 2012; 138:122–129.
38. Kunii K, Davis L, Gorenstein J, Hatch H, Yashiro M, Di Bacco A, Elbi C, Lutterbach B. FGFR2-amplified gastric cancer cell lines require FGFR2 and Erbb3 signaling for growth and survival. Cancer Res. 2008; 68:2340–2348.
39. Matsuda T, Cepko CL. Electroporation and RNA interference in the rodent retina in vivo and in vitro. Proc Natl Acad Sci U S A. 2004; 101:16–22.
40. Young TL, Cepko CL. A role for ligand-gated ion channels in rod photoreceptor development. Neuron. 2004; 41:867–879.