
INTRODUCTION
Ovarian cancer is the fifth most common cause of cancer-related death in women and the leading cause of death from gynaecological malignancies [1]. Ovarian cancer patients have a very low five-year survival rate (~45%) which is largely attributable to the high proportion of patients presenting with disseminated disease (~60%), for which the survival rate is only ~30% [1, 2]. Epidermal growth factor receptor (EGFR) is overexpressed in a variety of malignancies, including cancers of pancreas, breast, head and neck, lung and ovary [3]. In ovarian cancers, elevated expression of EGFR is correlated with poor prognosis [4-7]. EGFR belongs to the c-erbB receptor tyrosine kinase family, which includes 4 members: EGFR (ERBB1), ERBB2 (HER2), ERBB3 (HER3) and ERBB4 (HER4) [8]. Betacellulin (BTC) is an EGF-like growth factor that binds not only EGFR with high affinity, but also ERBB4 [9]. Overexpression of BTC has been found in many types of human cancers. [10-13]. In breast cancer, up-regulation of BTC is associated with reduced disease free survival [14]. In addition, BTC has been shown to act as an autocrine factor promoting the growth of pancreatic tumors[15]. BTC is an important regulator of ovarian follicle development, and has been shown to stimulate oocyte maturation and cumulus expansion [16]. BTC mRNA has been detected in ovarian tumors [17], however the functional role and clinical significance of BTC in ovarian cancer remains unknown.
E-cadherin, also known as cadherin 1 (CDH1), is a classical transmembrane cell-cell adhesion glycoprotein and a well-known tumor suppressor. E-cadherin plays an important role in maintaining normal epithelial cell polarity and structure [18, 19]. Down-regulation of E-cadherin and up-regulation of N-cadherin, often referred to as cadherin switching, is frequently associated with the process of epithelial-mesenchymal transition (EMT). EMTs involve the conversion of polarized, immotile epithelial cells to mesenchymal cells with a motile/invasive phenotype [20, 21]. In ovarian cancer, reduced total or cell surface E-cadherin expression is associated with poor overall or recurrence-free survival [22-24]. In addition, studies have shown that the expression of E-cadherin is negatively correlated with ovarian cancer cell invasiveness [25].
Our previous studies have shown that EGF induces ovarian cancer cell migration and invasion by down-regulating E-cadherin expression through a variety of signaling pathways [26-29]. Whereas BTC may function similar to EGF in many respects, its unique structure and receptor binding properties could result in unique mechanisms and functional roles. Our results show that BTC down-regulates E-cadherin expression and increases cell migration in an EGFR-dependent manner in two human ovarian cancer cell lines (SKOV3 and OVCAR5). Although BTC induces the expression of both Snail and Slug, two transcriptional repressors of E-cadherin, only Slug mediates its suppressive effects on E-cadherin expression. Moreover, our results show that both MEK-ERK1/2 and PI3K-Akt signaling pathways are involved in the effects of BTC on E-cadherin and cell migration.
RESULTS
BTC down-regulates E-cadherin, but not N-cadherin, via EGFR in ovarian cancer cells
To investigate the potential clinical relevance of BTC in ovarian cancer, we queried 489 ovarian cancers from The Cancer Genome Atlas (TCGA [30]) for up-regulation of BTC mRNA above the median. Kaplan-Meier analysis indicates that elevated levels of BTC mRNA are associated with reduced disease free survival (Log-rank P=0.0502, median 15.54 vs. 18.1 months; Supplementary Figure S1A) but not overall survival (Log-rank P=0.481; Supplementary Figure S1B). These results suggest that BTC could contribute to poor survival in ovarian cancer.
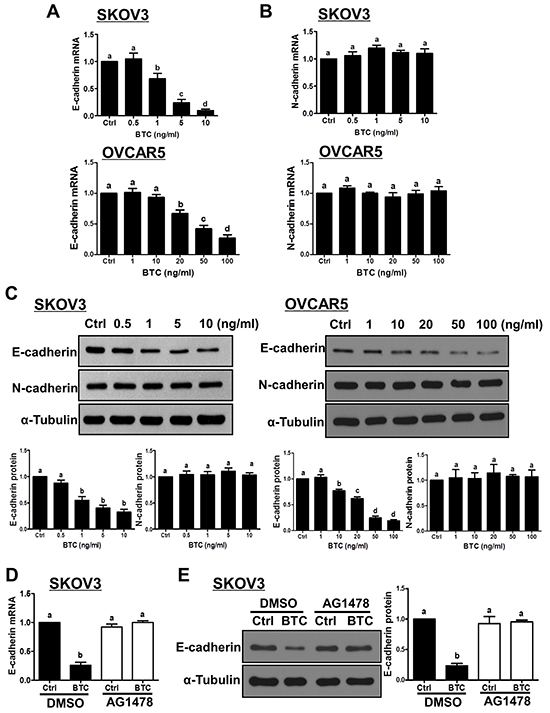
Figure 1: Betacellulin down-regulates E-cadherin, but not N-cadherin, via EGFR in ovarian cancer cells. A–C. Cells were treated for 24 hours without (Ctrl) or with increasing concentrations of betacellulin (BTC: SKOV3, 0.5, 1, 5 or 10 ng/ml; OVCAR5, 1, 10, 20, 50 or 100 ng/ml), and E-cadherin (A) and N-cadherin (B) mRNA levels were examined by RT-qPCR. In addition, E-cadherin and N-cadherin protein levels (C) were examined by Western blot. D–E. SKOV3 cells were pre-treated for 1 hour with vehicle control (DMSO) or 10 μM AG1478 prior to treatment with or without 10 ng/ml BTC for 24 hours. E-cadherin mRNA (D) and protein (E) levels were examined by RT-qPCR and Western blot, respectively. Results are expressed as the mean ± SEM of at least three independent experiments and values without common letters are significantly different (P < 0.05).
Next, we examined the effects of BTC on E-cadherin and N-cadherin expression in two ovarian cancer cell lines (SKOV3 and OVCAR5). As shown in Figure 1A, treatment for 24 hours with varying concentrations of BTC induced concentration-dependent reductions in E-cadherin mRNA levels in both cell lines, with SKOV3 cells displaying greater sensitivity. In contrast, treatment with BTC did not alter N-cadherin mRNA levels at any of the concentrations tested (Figure 1B). Western blot analysis confirmed the suppressive effects of BTC on E-cadherin, but not N-cadherin, protein levels in SKOV3 and OVCAR5 cells (Figure 1C). Next, we used the EGFR-specific inhibitor AG1478 to investigate the involvement of EGFR in BTC-induced E-cadherin down-regulation. As shown in Figure 1D and 1E, pre-treatment of SKOV3 cells with AG1478 completely blocked the down-regulation of E-cadherin mRNA and protein levels by BTC.
BTC suppresses E-cadherin via Slug in ovarian cancer cells
To investigate the involvement of Snail, Slug and/or Twist in BTC-induced E-cadherin down-regulation, we first examined the time-dependent effects of BTC on their mRNA and protein levels in SKOV3 cells. Whereas BTC treatment did not alter Twist mRNA levels (1, 3, 6, 12 or 24 hours; Figure 2A), it rapidly induced the mRNA and protein levels of both Snail and Slug, though the increases in Slug were more pronounced and sustained (Figure 2A and 2B). Consistent with our findings for E-cadherin, these BTC-induced increases in Snail and Slug mRNA and protein levels were abolished by pre-treatment with AG1478 (Figure 2C and 2D). To further confirm whether Snail or Slug mediates the suppression of E-cadherin by BTC, SKOV3 cells were transfected for 48 hours with Snail or Slug siRNA prior to treatment for 24 hours with BTC. RT-qPCR and Western blot analysis showed that whereas siRNA pre-treatment specifically down-regulated either Snail or Slug (Figure 3A and 3B), only knockdown of Slug blocked the suppressive effects of BTC on E-cadherin mRNA (Figure 3A) and protein (Figure 3B) levels.
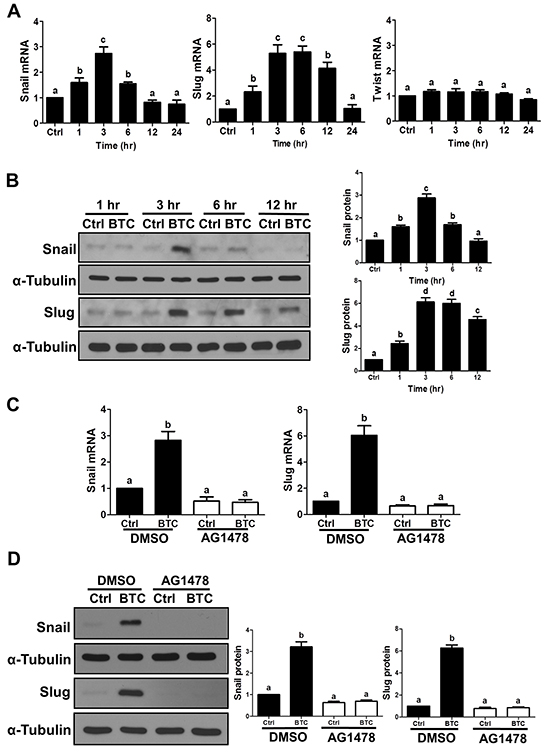
Figure 2: Betacellulin up-regulates Snail and Slug via EGFR in ovarian cancer cells. A–B. SKOV3 cells were treated without (Ctrl) or with betacellulin (BTC: 10 ng/ml) for 1, 3, 6, 12 or 24 hours. A, Snail, Slug and Twist mRNA levels were examined by RT-qPCR. B, Snail and Slug protein levels were examined by Western blot. C–D. SKOV3 cells were pre-treated for 1 hour with vehicle control (DMSO) or 10 μM AG1478 prior to treatment with or without 10 ng/ml BTC for 3 hours. Snail and Slug mRNA (C) and protein (D) levels were examined by RT-qPCR and Western blot, respectively. Results are expressed as the mean ± SEM of at least three independent experiments and values without common letters are significantly different (P < 0.05).
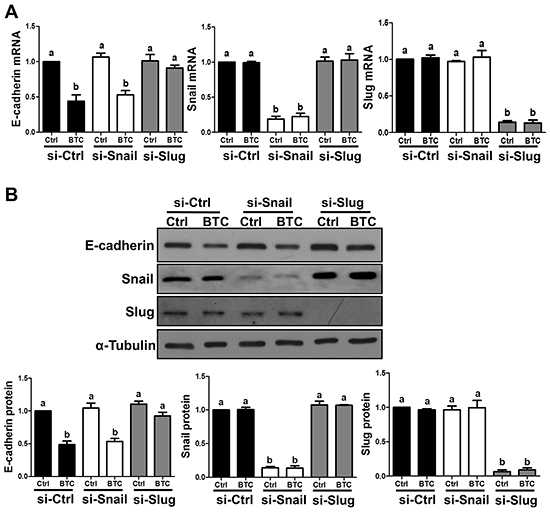
Figure 3: Betacellulin suppresses E-cadherin via Slug in ovarian cancer cells. SKOV3 cells were transfected for 48 hours with 50 nM non-targeting control siRNA (si-Ctrl) or 50 nM siRNA targeting Snail (si-Snail) or Slug (si-Slug) prior to treatment for 24 hours without (Ctrl) or with 10 ng/ml betacellulin (BTC). E-cadherin, Snail and Slug mRNA (A) and protein (B) levels were examined by RT-qPCR and Western blot, respectively. Results are expressed as the mean ± SEM of at least three independent experiments and values without common letters are significantly different (P < 0.05).
MEK-ERK and PI3K-Akt signaling contribute to the effects of BTC on E-cadherin and Slug
To investigate the involvement of MEK-ERK and PI3K-Akt signaling pathways in the effects of BTC on E-cadherin and Slug expression, we first used Western blot to examine their activation following treatment with BTC for 10, 30 or 60 minutes. As shown in Figure 4A, treatment with BTC increased the levels of phosphorylated Akt and ERK1/2 at all time-points in both SKOV3 and OVCAR5 cells. In addition, the effects of BTC on Akt and ERK1/2 phosphorylation were abolished by pre-treatment of SKOV3 cells with AG1478 (Figure 4B). Next, we used the MEK inhibitor U0126 and the PI3K inhibitor LY294002 to investigate the involvement of these two pathways in BTC-induced down-regulation of E-cadherin and up-regulation of Slug. Pre-treatment of SKOV3 cells with U0126 or LY294002 attenuated the suppressive effects of BTC on E-cadherin mRNA and protein levels (Figure 4C). Similarly, the up-regulation of Slug expression by BTC was attenuated by pre-treatment with U0126 or LY294002 (Figure 4D).
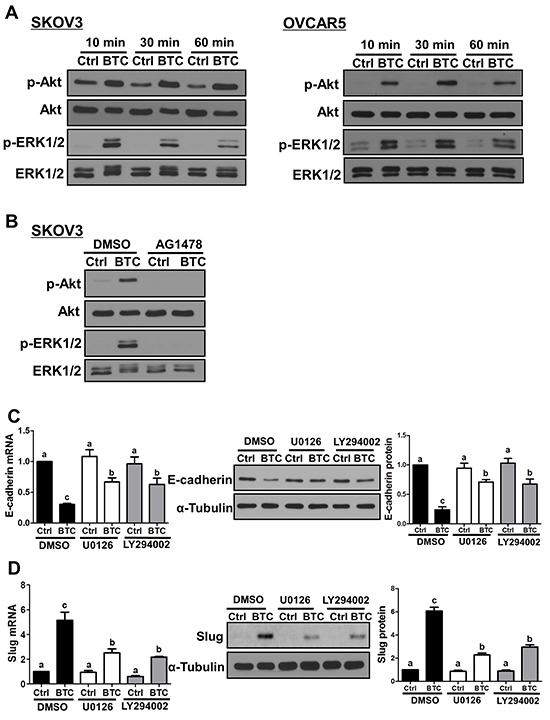
Figure 4: MEK-ERK and PI3K-Akt signaling contribute to the effects of betacellulin on E-cadherin and Slug. A. Cells were treated without (Ctrl) or with betacellulin (BTC: SKOV3, 10 ng/ml; OVCAR5, 50 ng/ml) for 10, 30 or 60 minutes, and Western blot was used to measure the levels of phosphorylated Akt (p-Akt) and ERK1/2 (p-ERK1/2) in relation to their total levels (Akt and ERK1/2, respectively). B. SKOV3 cells were pre-treated for 1 hour with vehicle control (DMSO) or 10 μM AG1478 prior to treatment with or without 10 ng/ml BTC for 30 minutes. Western blot was used to measure the Akt and ERK1/2 phosphorylation/activation. C–D. SKOV3 cells were pre-treated for 1 hour with vehicle control (DMSO), 5 μM U0126 (MEK inhibitor) or 5 μM LY294002 (PI3K inhibitor) prior to treatment with or without 10 ng/ml BTC. E-cadherin (24 hours; C) and Slug (3 hours; D) mRNA and protein levels were examined by RT-qPCR and Western blot. Results are expressed as the mean ± SEM of at least three independent experiments and values without common letters are significantly different (P < 0.05).
BTC-induced ovarian cancer cell migration requires EGFR, MEK-ERK and PI3K-Akt signaling
We have previously shown that loss of E-cadherin contributes to EGF-induced ovarian cancer cell invasiveness [27, 31, 32]. To determine whether BTC induces similar pro-migratory effects, SKOV3 and OVCAR5 cells were treated for 12 hours with BTC and then subjected to transwell migration assays. As shown in Figure 5A, BTC treatment increased the migration of both SKOV3 and OVCAR5 cells, and this effect was almost completely abolished by pre-treatment AG1478. In addition, pre-treatment with U0126 or LY294002 reversed the stimulatory effects of BTC on SKOV3 cell migration (Figure 5B).
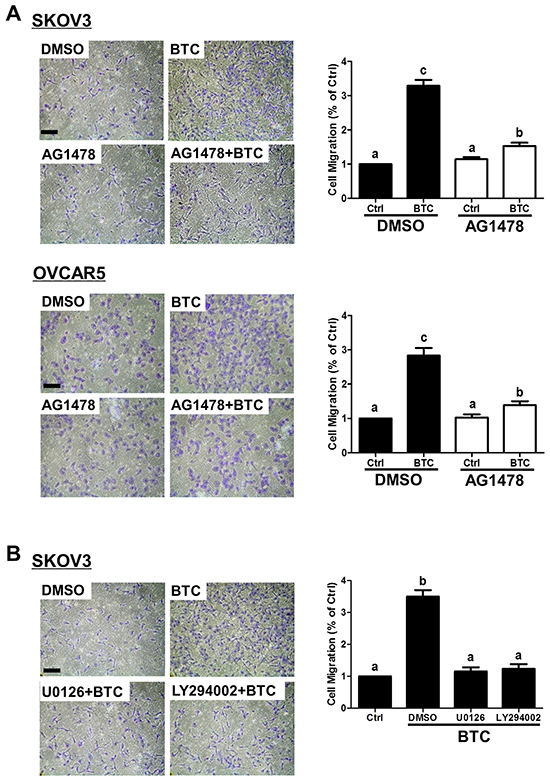
Figure 5: Betacellulin-induced ovarian cancer cell migration requires EGFR, MEK-ERK and PI3K-Akt signaling. A. SKOV3 and OVCAR5 cells were pre-treated for 1 hour with vehicle control (DMSO) or 10 μM AG1478 prior to treatment without (Ctrl) or with betacellulin (BTC: 10 ng/ml for SKOV3, 50 ng/ml for OVCAR5), and cell migration was examined by transwell assay (12 hours). B. SKOV3 cells were pre-treated for 1 hour with or without 5 μM U0126 or 5 μM LY294002 prior to treatment with 10 ng/ml BTC, and cell migration was examined by transwell assay (12 hours). Results are expressed as the mean ± SEM of at least three independent experiments and values without common letters are significantly different (P < 0.05).
DISCUSSION
The fact that most ovarian cancers are diagnosed at advanced stage with widespread peritoneal dissemination is the primary reason for their high mortality, and a persistent therapeutic challenge [1, 33]. EGF-like growth factors have been shown to enhance the invasiveness of ovarian cancer cells by suppressing the expression of E-cadherin [27, 32, 34]. Also a member of this family, BTC has been detected in various human cancers [10-13], where it has been shown to modulate cancer cell growth, invasion and resistance to targeted therapeutics [35-37]. To date, the potential role of BTC in ovarian cancer remains poorly defined. Previous studies by Tanaka et al. failed to show a significant difference in BTC mRNA between normal ovary and ovarian tumors [17], however most ovarian cancers are thought to arise from the fallopian tube epithelium or the ovarian surface epithelium [38, 39], and comparisons of BTC expression to these cell types have not been reported. Interestingly, however, their results did suggest a trend towards increased BTC expression in stage III-IV tumors [17]. These results are in agreement with our findings that BTC treatment promotes ovarian cancer cell motility, and that BTC is associated with reduced disease free survival. Together with previous studies, our results suggest that enhanced BTC signaling may contribute to ovarian cancer progression, though future studies are required to fully characterize its functional roles and molecular determinants.
BTC has been shown to induce head-and-neck squamous carcinoma cell invasion by up-regulating MMP9 [12, 36]. BTC has also been suggested to induce pancreatic islet migration by modulating RAC1 activity [40]. We now report, for the first time, that BTC induces ovarian cancer migration by down-regulating E-cadherin expression. Besides its putative roles in cancer cell migration/invasion, BTC has also been linked to other processes related to the hallmarks of cancer. For example, several groups have demonstrated the pro-proliferative effects of BTC in pancreatic cancer [15, 41, 42]. Moreover, BTC has been implicated in the development of an inflammatory microenvironment in lung cancer [43]. In addition, BTC has been shown to induce the proliferation and migration of vascular smooth muscle and umbilical vein endothelial cells, indicating a potential role for BTC in angiogenesis [44, 45]. Given that BTC could contribute to poor survival in ovarian cancer, future studies investigating the roles of BTC in ovarian cancer cell invasion, proliferation, apoptosis and angiogenesis would be of interest.
EGF-like growth factors elicit their effects by binding to and activating ERBB receptor homo- or heterodimers [46]. BTC has unique receptor binding properties compared to other well-studied EGF-like growth factors that bind exclusively to EGFR (e.g. EGF, transforming growth factor-α, amphiregulin). In particular, BTC can bind to either EGFR or ERBB4 and subsequently activate their respective homodimers or all the possible ERBB heterodimers [9]. Previous studies have used AG1478 and an EGFR-specific antagonistic antibody (ICR-62) to demonstrate the importance of EGFR in mediating BTC-induced cell migration and invasion [36, 45]. Similarly, we found that pre-treatment with AG1478 fully blocked BTC-induced E-cadherin down-regulation, Snail and Slug expression, and ERK1/2 and Akt activation. However, BTC-induced SKOV3 and OVCAR5 cell migration was only partially inhibited by AG1478, suggesting a potential role of ERBB4 in BTC-induced ovarian cancer migration. ERBB4 is the least investigated of all the ERBB family members in ovarian cancer, especially with regards to the effects of BTC. However, several groups have studied the expression and clinical importance of ERBB4 in ovarian tumors [47-50]. Interestingly, mounting evidence suggests that different isoforms of ERBB4 may correlate with different clinical outcomes in ovarian cancer patients [51, 52]. Thus, the roles of BTC and ERBB4 in ovarian cancer are likely complex, and warrant further investigation.
Loss of E-cadherin is a key event in epithelial-mesenchymal transition and is associated with poor overall or recurrence-free survival in ovarian cancer [22-24]. We have previously investigated the roles of several E-cadherin transcriptional repressors in mediating the effects of EGF-like growth factors on E-cadherin expression and invasion in ovarian cancer cells [27, 32, 34]. In particular, whereas both Snail and Slug are involved in EGF- and amphiregulin-induced E-cadherin down-regulation, Snail does not participate in the effects of transforming growth factor-α [34]. Interestingly, we show that, like transforming growth factor-α, BTC-induced E-cadherin down-regulation involves Slug, but not Snail. Thus, many of the EGFR-mediated functions of BTC are likely to be similar to other EGF-like growth factors, however BTC could induce a novel subset of effects via ERBB4. In addition to Snail and Slug, we have recently shown that hypoxia-inducible factor-1α, a key regulator of hypoxic responses [53], also mediates EGF-induced E-cadherin down-regulation and ovarian cancer cell invasion [29]. Interestingly, hypoxia-inducible factor-1α has been shown to participate in BTC-driven mesenchymal stem cell proliferation [54]. Future studies will be required to examine the effects of BTC on hypoxia-inducible factor-1α expression in ovarian cancer cells, and whether it may contribute to adaptation to hypoxia, proliferation and/or metastasis.
In summary, our study demonstrates that BTC signals through EGFR to up-regulate Snail and Slug in a MEK-ERK- and PI3K-Akt-dependent manner. Elevation of Slug, not Snail, is required for the down-regulation of E-cadherin expression which promotes ovarian cancer cell migration.
MATERIALS AND METHODS
Cell culture
SKOV3 and OVCAR5 human epithelial ovarian cancer cell lines were obtained from American Type Culture Collection. Cells were incubated in a 1:1 (vol/vol) mixture of M199/MCDB105 medium (Sigma-Aldrich) supplemented with 10% (vol/vol) fetal bovine serum (FBS; Hyclone Laboratories) and 1% (vol/vol) penicillin/streptomycin (Gibco). Cells were cultured at 37°C in a humidified atmosphere containing 5% CO2 and 95% air, and were serum starved for 24 hours prior to treatment.
Antibodies and reagents
The monoclonal antibodies used in this study were: anti-human E-cadherin (36/E-cadherin, BD Biosciences), anti-human N-cadherin (32/N-cadherin, BD Biosciences), anti-porcine α-tubulin (B-5-1-2, Santa Cruz Biotechnology), anti-human Snail (L70G2, Cell Signaling Technology), and anti-human phospho-ERK1/2 (Thr202/Tyr204) (E10, Cell Signaling Technology), anti-human Slug (C19G7, Cell Signaling Technology). The polyclonal antibodies used were: anti-rat ERK1/2 (9102, Cell Signaling Technology), anti-human phospho-Akt (9271, Cell Signaling Technology), anti-mouse Akt (9272, Cell Signaling Technology). The horseradish peroxidase-conjugated goat anti-mouse IgG and goat anti-rabbit IgG were obtained from Bio-Rad Laboratories. E. coli-derived recombinant human betacellulin (Asp32-Tyr111) was obtained from R&D Systems. Human recombinant epidermal growth factor (E9644), AG1478 and LY294002 were obtained from Sigma-Aldrich. U0126 was obtained from Calbiochem.
Small interfering RNA (siRNA) transfection
To knock down endogenous Snail or Slug, cells were plated at low density, allowed to recover for 24 hours, and then transfected with 50 nM ON-TARGETplusSMARTpool siRNA (Dharmacon) using Lipofectamine RNAiMAX (Invitrogen) according to the manufacturer’s instructions. ON-TARGETplus non-targeting control pool siRNA (50 nM; Dharmacon) was used as a transfection control in all experiments.
Reverse transcription-quantitative real-time PCR (RT-qPCR)
Total RNA was extracted using TRIzol Reagent (Invitrogen) according to the manufacturer’s instructions. Reverse transcription was performed with 3 μg of RNA, random primers, and Moloney murine leukemia virus reverse transcriptase (Promega). SYBR Green RT-qPCR was performed on Applied Biosystems 7300 Real-Time PCR System equipped with 96-well optical reaction plates. Each 20 μl RT-qPCR reaction contained 1×SYBR Green PCR Master Mix (Applied Biosystems), 20 ng cDNA and 150 nM of each specific primer. The primers used were: E-cadherin (CDH1), 5′-ACA GCC CCG CCT TAT GAT T-3′ (sense) and 5′-TCG GAA CCG CTT CCT TCA-3′ (antisense); N-cadherin (CDH2), 5′-GGA CAG TTC CTG AGG GAT CA-3′ (sense) and 5′-GGA TTG CCT TCC ATG TCT GT-3′ (antisense); Snail (SNAI1), 5′-CCCCAATCGGAAGCCTAACT-3′ (sense) and 5′-GCTGGAAGGTAA ACT CTG GAT TAG A-3′ (antisense); Slug (SNAI2), 5′-TTC GGACCC ACA CAT TAC CT-3′ (sense) and 5′-GCAGTGAGGGCAAGA AAA AG-3′ (antisense); Twist (TWIST1), 5′-GGA GTC CGC AGT CTT ACG AG-3′ (sense) and 5′-TCT GGA GGA CCT GGT AGA GG-3′ (antisense); and glyceraldehyde-3-phosphate dehydrogenase (GAPDH), 5′-GAG TCA ACGGAT TTG GTC GT-3′ (sense) and 5′-GAC AAG CTT CCC GTTCTC AG-3′ (antisense). The amplification parameters were 50°C for 2 minutes, 95°C for 10 minutes, and 40 cycles of 95°C for 15 seconds and 60°C for 1 minute. At least three separate experiments were performed on different cultures and each sample was assayed in triplicate. A mean value was used for the determination of mRNA levels by the comparative Cq method (2−ΔΔCq) with GAPDH as the reference gene.
Western blots
Cells were lysed in lysis buffer (Cell Signaling Technology) containing protease inhibitor cocktail (Sigma-Aldrich). Lysates were centrifuged at 20,000×g for 10 minutes at 4°C and supernatant protein concentrations were quantified using the DC Protein Assay (Bio-RadLaboratories) with BSA (A4503, Sigma-Aldrich) as the standard. Equal amounts of protein were separated by SDS-PAGE and transferred to polyvinylidene fluoride membranes. After blocking with Tris-buffered saline containing 5% non-fat dry milk for 1 hour, membranes were incubated overnight at 4°C with primary antibodies E-cadherin (1:3000), N-cadherin (1:3000), α-Tubulin (1:3000), phospho-ERK1/2 (1:3000), ERK1/2 (1:3000), phospho-Akt (1:3000), Akt (1:3000), Snail (1:1000) or Slug (1:1000), followed by incubation with the peroxidase-conjugated secondary antibody (1:5000). Immunoreactive bands were detected with enhanced chemiluminescent or SuperSignal West Femto substrate (Pierce). Membranes were stripped with stripping buffer (50 mM Tris-HCl pH 7.6, 10 mM β-mercaptoethanol and 1% SDS) at 50°C for 30 minutes and reprobed with anti-α-Tubulin, anti-ERK1/2 or anti-Akt as a loading control. Immunoreactive band intensities were quantified by densitometry, normalized to those of the relevant loading control, and the results are expressed as fold change relative to the respective control.
Transwell migration assays
Migration assays were performed in Boyden chambers with minor modifications [55]. Transwell cell culture inserts (24-well, pore size 8 μm; BD Biosciences) were seeded with 1x10⁵ cells in 250 μL of medium with 0.1% FBS. Medium with 10% FBS (750 μl) was added to the lower chamber and served as a chemotactic agent. After 12 hours incubation, non-migrating cells were wiped from the upper side of the membrane and cells on the lower side were fixed in cold methanol (-20°C) and air dried. Cells were stained with Crystal Violet and counted using a light microscope (10× objective) equipped with a digital camera (QImaging) and Northern Eclipse 6.0 software. Five microscopic fields were counted per insert, triplicate inserts were used for each individual experiment, and each experiment was repeated at least three times.
Statistical analysis
Results are presented as the mean ± SEM of at least three independent experiments. PRISM software (GraphPad Software Inc.) was used to perform one-way ANOVA followed by Tukey’s multiple comparison test. Means were considered significantly different if P < 0.05 and are indicated by different letters.
ACKNOWLEDGMENTS
This work was supported by grants from the Canadian Institutes of Health Research to P.C.K.L. P.C.K.L. is a Scientist Level 3 of the Child and Family Research Institute. J.Z. is supported by the China Scholarship Council.
CONFLICTS OF INTEREST
The authors declare no conflict of interest.
GRANT SUPPORT
This work was supported by grants (#143317) from the Canadian Institutes of Health Research to P.C.K.L.
REFERENCES
1. Siegel RL, Miller KD and Jemal A. Cancer statistics, 2015. CA Cancer J Clin. 2015; 65:5-29.
2. Landen CN, Jr., Birrer MJ and Sood AK. Early events in the pathogenesis of epithelial ovarian cancer. J Clin Oncol. 2008; 26:995-1005.
3. Grandis JR and Sok JC. Signaling through the epidermal growth factor receptor during the development of malignancy. Pharmacol Ther. 2004; 102:37-46.
4. Gui T and Shen K. The epidermal growth factor receptor as a therapeutic target in epithelial ovarian cancer. Cancer Epidemiol. 2012; 36:490-496.
5. Fischer-Colbrie J, Witt A, Heinzl H, Speiser P, Czerwenka K, Sevelda P and Zeillinger R. EGFR and steroid receptors in ovarian carcinoma: comparison with prognostic parameters and outcome of patients. Anticancer Res. 1997; 17:613-619.
6. Berchuck A, Rodriguez GC, Kamel A, Dodge RK, Soper JT, Clarke-Pearson DL and Bast RC, Jr. Epidermal growth factor receptor expression in normal ovarian epithelium and ovarian cancer. I. Correlation of receptor expression with prognostic factors in patients with ovarian cancer. Am J Obstet Gynecol. 1991; 164:669-674.
7. Qiu X, Cheng JC, Klausen C, Chang HM, Fan Q and Leung PC. EGF-Induced Connexin43 Negatively Regulates Cell Proliferation in Human Ovarian Cancer. J Cell Physiol. 2016; 231:111-119.
8. Mendelsohn J and Baselga J. Status of epidermal growth factor receptor antagonists in the biology and treatment of cancer. J Clin Oncol. 2003; 21:2787-2799.
9. Dahlhoff M, Wolf E and Schneider MR. The ABC of BTC: structural properties and biological roles of betacellulin. Semin Cell Dev Biol. 2014; 28:42-48.
10. Srinivasan R, Benton E, McCormick F, Thomas H and Gullick WJ. Expression of the c-erbB-3/HER-3 and c-erbB-4/HER-4 growth factor receptors and their ligands, neuregulin-1 alpha, neuregulin-1 beta, and betacellulin, in normal endometrium and endometrial cancer. Clin Cancer Res. 1999; 5:2877-2883.
11. Moon WS, Park HS, Yu KH, Park MY, Kim KR, Jang KY, Kim JS and Cho BH. Expression of betacellulin and epidermal growth factor receptor in hepatocellular carcinoma: implications for angiogenesis. Hum Pathol. 2006; 37:1324-1332.
12. P Oc, Modjtahedi H, Rhys-Evans P, Court WJ, Box GM and Eccles SA. Epidermal growth factor-like ligands differentially up-regulate matrix metalloproteinase 9 in head and neck squamous carcinoma cells. Cancer Res. 2000; 60:1121-1128.
13. Yokoyama M, Funatomi H, Kobrin M, Ebert M, Friess H, Buchler M and Korc M. Betacellulin, a member of the epidermal growth-factor family, is overexpressed in human pancreatic-cancer. Int J Oncol. 1995; 7:825-829.
14. Olsen DA, Bechmann T, Ostergaard B, Wamberg PA, Jakobsen EH and Brandslund I. Increased concentrations of growth factors and activation of the EGFR system in breast cancer. Clin Chem Lab Med. 2012; 50:1809-1818.
15. Kawaguchi M, Hosotani R, Kogire M, Ida J, Doi R, Koshiba T, Miyamoto Y, Tsuji S, Nakajima S, Kobayashi H, Masui T and Imamura M. Auto-induction and growth stimulatory effect of betacellulin in human pancreatic cancer cells. Int J Oncol. 2000; 16:37-41.
16. Hsieh M, Zamah AM and Conti M. Epidermal growth factor-like growth factors in the follicular fluid: role in oocyte development and maturation. Semin Reprod Med. 2009; 27:52-61.
17. Tanaka Y, Miyamoto S, Suzuki SO, Oki E, Yagi H, Sonoda K, Yamazaki A, Mizushima H, Maehara Y, Mekada E and Nakano H. Clinical significance of heparin-binding epidermal growth factor-like growth factor and a disintegrin and metalloprotease 17 expression in human ovarian cancer. Clin Cancer Res. 2005; 11:4783-4792.
18. van Roy F and Berx G. The cell-cell adhesion molecule E-cadherin. Cell Mol Life Sci. 2008; 65:3756-3788.
19. van Roy F. Beyond E-cadherin: roles of other cadherin superfamily members in cancer. Nat Rev Cancer. 2014; 14:121-134.
20. Cavallaro U and Christofori G. Cell adhesion and signalling by cadherins and Ig-CAMs in cancer. Nat Rev Cancer. 2004; 4:118-132.
21. Pecina-Slaus N. Tumor suppressor gene E-cadherin and its role in normal and malignant cells. Cancer Cell Int. 2003; 3:17.
22. Darai E, Scoazec JY, Walker-Combrouze F, Mlika-Cabanne N, Feldmann G, Madelenat P and Potet F. Expression of cadherins in benign, borderline, and malignant ovarian epithelial tumors: a clinicopathologic study of 60 cases. Hum Pathol. 1997; 28:922-928.
23. Voutilainen KA, Anttila MA, Sillanpaa SM, Ropponen KM, Saarikoski SV, Juhola MT and Kosma VM. Prognostic significance of E-cadherin-catenin complex in epithelial ovarian cancer. J Clin Pathol. 2006; 59:460-467.
24. Faleiro-Rodrigues C, Macedo-Pinto I, Pereira D and Lopes CS. Prognostic value of E-cadherin immunoexpression in patients with primary ovarian carcinomas. Ann Oncol. 2004; 15:1535-1542.
25. Veatch AL, Carson LF and Ramakrishnan S. Differential expression of the cell-cell adhesion molecule E-cadherin in ascites and solid human ovarian tumor cells. Int J Cancer. 1994; 58:393-399.
26. Cheng JC, Qiu X, Chang HM and Leung PC. HER2 mediates epidermal growth factor-induced down-regulation of E-cadherin in human ovarian cancer cells. Biochem Biophys Res Commun. 2013; 434:81-86.
27. Cheng JC, Klausen C and Leung PC. Hydrogen peroxide mediates EGF-induced down-regulation of E-cadherin expression via p38 MAPK and snail in human ovarian cancer cells. Mol Endocrinol. 2010; 24:1569-1580.
28. Cheng JC, Auersperg N and Leung PC. EGF-induced EMT and invasiveness in serous borderline ovarian tumor cells: a possible step in the transition to low-grade serous carcinoma cells? PLoS One. 2012; 7:e34071.
29. Cheng JC, Klausen C and Leung PC. Hypoxia-inducible factor 1 alpha mediates epidermal growth factor-induced down-regulation of E-cadherin expression and cell invasion in human ovarian cancer cells. Cancer Lett. 2013; 329:197-206.
30. Cancer Genome Atlas Research N. Integrated genomic analyses of ovarian carcinoma. Nature. 2011; 474:609-615.
31. Cheng JC, Auersperg N and Leung PC. Inhibition of p53 induces invasion of serous borderline ovarian tumor cells by accentuating PI3K/Akt-mediated suppression of E-cadherin. Oncogene. 2011; 30:1020-1031.
32. So WK, Fan Q, Lau MT, Qiu X, Cheng JC and Leung PC. Amphiregulin induces human ovarian cancer cell invasion by down-regulating E-cadherin expression. FEBS Lett. 2014; 588:3998-4007.
33. Bhoola S and Hoskins WJ. Diagnosis and management of epithelial ovarian cancer. Obstet Gynecol. 2006; 107:1399-1410.
34. Qiu X, Cheng JC, Klausen C, Fan Q, Chang HM, So WK and Leung PC. Transforming growth factor-alpha induces human ovarian cancer cell invasion by down-regulating E-cadherin in a Snail-independent manner. Biochem Biophys Res Commun. 2015; 461:128-135.
35. Shing Y, Christofori G, Hanahan D, Ono Y, Sasada R, Igarashi K and Folkman J. Betacellulin: a mitogen from pancreatic beta cell tumors. Science. 1993; 259:1604-1607.
36. P Oc, Wongkajornsilp A, Rhys-Evans PH and Eccles SA. Signaling pathways required for matrix metalloproteinase-9 induction by betacellulin in head-and-neck squamous carcinoma cells. Int J Cancer. 2004; 111:174-183.
37. Carrion-Salip D, Panosa C, Menendez JA, Puig T, Oliveras G, Pandiella A, De Llorens R and Massaguer A. Androgen-independent prostate cancer cells circumvent EGFR inhibition by overexpression of alternative HER receptors and ligands. Int J Oncol. 2012; 41:1128-1138.
38. Kurman RJ. Origin and molecular pathogenesis of ovarian high-grade serous carcinoma. Ann Oncol. 2013; 24 Suppl 10:x16-21.
39. Auersperg N. Ovarian surface epithelium as a source of ovarian cancers: unwarranted speculation or evidence-based hypothesis? Gynecol Oncol. 2013; 130:246-251.
40. Greiner TU, Kesavan G, Stahlberg A and Semb H. Rac1 regulates pancreatic islet morphogenesis. BMC Dev Biol. 2009; 9:2.
41. Oh YS, Shin S, Lee YJ, Kim EH and Jun HS. Betacellulin-induced beta cell proliferation and regeneration is mediated by activation of ErbB-1 and ErbB-2 receptors. PloS one. 2011; 6:e23894.
42. Huotari MA, Palgi J and Otonkoski T. Growth factor-mediated proliferation and differentiation of insulin-producing INS-1 and RINm5F cells: identification of betacellulin as a novel beta-cell mitogen. Endocrinology. 1998; 139:1494-1499.
43. Shi L, Wang L, Wang B, Cretoiu SM, Wang Q, Wang X and Chen C. Regulatory mechanisms of betacellulin in CXCL8 production from lung cancer cells. J Transl Med. 2014; 12:70.
44. Kim HS, Shin HS, Kwak HJ, Cho CH, Lee CO and Koh GY. Betacellulin induces angiogenesis through activation of mitogen-activated protein kinase and phosphatidylinositol 3'-kinase in endothelial cell. FASEB J. 2003; 17:318-320.
45. Mifune M, Ohtsu H, Suzuki H, Frank GD, Inagami T, Utsunomiya H, Dempsey PJ and Eguchi S. Signal transduction of betacellulin in growth and migration of vascular smooth muscle cells. Am J Physiol Cell Physiol. 2004; 287:C807-813.
46. Yarden Y and Pines G. The ERBB network: at last, cancer therapy meets systems biology. Nat Rev Cancer. 2012; 12:553-563.
47. Davies S, Holmes A, Lomo L, Steinkamp MP, Kang H, Muller CY and Wilson BS. High incidence of ErbB3, ErbB4, and MET expression in ovarian cancer. Int J Gynecol Pathol. 2014; 33:402-410.
48. Sheng Q and Liu J. The therapeutic potential of targeting the EGFR family in epithelial ovarian cancer. Br J Cancer. 2011; 104:1241-1245.
49. Gruessner C, Gruessner A, Glaser K, AbuShahin N, Zhou Y, Laughren C, Wright H, Pinkerton S, Yi X, Stoffer J, Azodi M, Zheng W and Chambers SK. Flutamide and biomarkers in women at high risk for ovarian cancer: preclinical and clinical evidence. Cancer Prev Res (Phila). 2014; 7:896-905.
50. Steffensen KD, Waldstrom M, Andersen RF, Olsen DA, Jeppesen U, Knudsen HJ, Brandslund I and Jakobsen A. Protein levels and gene expressions of the epidermal growth factor receptors, HER1, HER2, HER3 and HER4 in benign and malignant ovarian tumors. Int J Oncol. 2008; 33:195-204.
51. Gilmour LM, Macleod KG, McCaig A, Gullick WJ, Smyth JF and Langdon SP. Expression of erbB-4/HER-4 growth factor receptor isoforms in ovarian cancer. Cancer Res. 2001; 61:2169-2176.
52. Paatero I, Lassus H, Junttila TT, Kaskinen M, Butzow R and Elenius K. CYT-1 isoform of ErbB4 is an independent prognostic factor in serous ovarian cancer and selectively promotes ovarian cancer cell growth in vitro. Gynecol Oncol. 2013; 129:179-187.
53. Harris AL. Hypoxia--a key regulatory factor in tumour growth. Nat Rev Cancer. 2002; 2:38-47.
54. Genetos DC, Rao RR and Vidal MA. Betacellulin inhibits osteogenic differentiation and stimulates proliferation through HIF-1alpha. Cell Tissue Res. 2010; 340:81-89.
55. Woo MM, Salamanca CM, Minor A and Auersperg N. An improved assay to quantitate the invasiveness of cells in modified Boyden chambers. In Vitro Cell Dev Biol Anim. 2007; 43:7-9.