
Introduction
Based on the principles of invasion area of lesion and progress, the TNM clinical staging system for NPC divides the severity of carcinomas (termed either “in situ” (Tumor, T), “regional lymph node metastasis” (Node, N) or “distant metastasis” (Metastasis, M)) into several levels, such as T1-4, N0-3 and M0-1. Informed by the prognosis of the three above mentioned degrees of severity, the NPC is divided into four stages, from I to IV stage. The T stage is relevant to the local control rate, while the N stage reflects the risk level of distant metastasis. The intent and significance of clinical staging is as follows: (1) to guide therapeutic planning; (2) to aid prognosis; (3) to evaluate curative effect; (4) to facilitate both information exchange and effect comparison between treatment entities; (5) and to support the continuity of research work on cancer [1]. It is self-evident that the TNM clinical staging system for NPC should be amended when the progress of diagnostic and therapeutic methods allows for finer distinctions or more accurate definitions.
In the past 10 years, NPC diagnostics and therapy have seen dramatic improvements. Firstly, MRI has become the preferred imaging method for detecting NPC. Extensive research has shown that compared to computed tomography (CT), MRI displays the invasion area of the lesions more clearly, which in turn allows for a change in staging [2, 3]. Secondly, IMRT has gradually replaced regular two-dimensional radiotherapy (2D-RT) as the mainstream therapy for NPC [4- 6]. Combination therapy, with IMRT as the primary therapy, has dramatically improved the prognosis of NPC patients, and the 5-year overall survival rate has reached 80% [7-8]. While significantly improving local control rates for carcinoma, this technology also reduces the side effects of radiotherapy [9]. However, the seventh edition of the benchmark staging volume Union for International Cancer Control/American Joint Committee on Cancer (UICC/AJCC), published in 2009, is based on data from regular 2D-RT and thus is not informed by innovations in diagnosis and therapy on staging [10]. A clinical staging standard adaptable to IMRT has not yet been formulated. It is a key task to establish such a standard to make prognosis more accurate and treatment more effective for NPC patients.
In this study, we performed a prospective multicenter clinical trial including 492 NPC patients to establish a new clinical staging standard for NPC based on IMRT.
Materials and Methods
Clinical data
Four hundred and ninety-two NPC patients were selected from six hospitals in Guangxi Zhuang Autonomous Region, China from January 2006 to December 2009. 338 were male and 154 were female. The median age of the group was 45 years old (18-81).All the patients received IMRT. Patients with a Karnofsky performance status of 70 or more, who met criteria for blood counts and other tests (i.e., serum creatinine ≤ 1.6 mg/dl and serum bilirubin ≤ 1.5 mg/dl; white blood cell ≥ 3600/mm3, platelet ≥ 100,000/mm3, and hemoglobin ≥12.0 g/dl for male, ≥ 11.0 g/dl for female) were eligible. Before treatment, all patients underwent a detailed physical examination, a general situation appraisal, a routine blood examination, a nasopharyngeal fiberscope examination, and imaging, such as a chest X-ray or CT, abdominal ultrasound, MRI of nasopharynx and neck. Patients at N2-N3 stage received additional bone scanning. All patients were estaged with according to the criteria of the 7th edition for the current study. Prior written and informed consent was obtained from every patient and the study was approved by the Ethics Review Board of Guangxi Medical University.
Clinical staging method
All patients’ MRI scans were independently reviewed on the PACS system by two physicians. If their diagnoses were dissimilar, the research group defined the stage according to seventh edition of the UICC/AJCC clinical staging standard, incorporating information from patients’ physical examinations, such as cranial nerve palsies and the size of lymph nodes. Lymph nodes were identified according to the 2013 edition of the Radiation Therapy Oncology Group (RTOG)’s identification guidelines for nodal classification in the neck.
MRI scanning method
The MRI was performed with a GE Signa 1.5T Magnetic Resonance Scanner. All cases received conventional and enhanced scanning. Scanning patterns include cross section, sagittal section and coronal section scan T2WI (TR 3000~4000ms, TE102~110ms), T1WI (TR 2200~2400ms, TE77~109ms, TI 750ms) and T1WI enhanced scan with position and parameters the same as those of the T1WI plain scan. The quadrature head coil was adopted with slice thickness 6 mm, slice gap 1 mm and matrix 256 × 192. The cross section scan field ranged from the suprasellar cistern to the bottom edge of the clavicle. Gd-DTPA was used as the contrast agent.
Therapeutic method
The four hundred and ninety-two NPC patients received IMRT throughout the entire process. Adopting the dorsal decubitus position, patients were fixed with a head-and-neck thermoplastic mask and placed under the CT simulated positioning system for the enhanced CT scan. The scan field ranged from the calvarium to 3 cm below the clavicle. The gaps and thicknesses of slices were both 3 mm.
Under the guidance of Report 50 and Report 62 of the International Commission on Radiation Units and Measurements (ICRU), delineation of tumor target volume was made by delineating the target area on CT film slice by slice with MRI plain scan plus enhanced scan. Gross tumor volume (GTV) included the primary site of the carcinoma and its invasion area (GTVnx), metastatic retropharyngeal lymph nodes (GTVrpn), and metastatic cervical lymph nodes that were visible via imaging method and clinical examination. The area of clinical target volume (CTV) was adjusted according to the involved situation. CTV1 included (GTVnx + GTVrpn) + 5~10mm; CTV2 covered CTV1. Additionally, according to the specific carcinoma invasion region and its area, it was necessary to consider whether to include locations such as the postnaris, pterygopalatine fossa, post-maxillary sinus, part of the posterior ethmoidal sinus, the parapharyngeal space, the base of the skull, part of the cervical vertebra and the Basilar clivus. The planning target volume (PTV) included allowances for set-up error and organ movement during the treatment process and was generally extended by 3~5 mm on the basis of GTVs and CTVs. Organs at risk (OAR) were defined as the spinal cord, brain stem, temporal lobe, hypophysis, optic nerve, optic chiasm, optic lens, eyeball, and parotid gland. Prescribed doses were delivered as follows: 68~74Gy for PGTVnx and PTVrpn; 66~70Gy for PTVnd; 60~64Gy for PTV1; 50~56Gy for PTV2; 5 times/week; 30~33 times in total. According to RTOG 0225 protocols, dose restrictions for organs at risk were set as follows: lens ≤ 8Gy; parotid gland D33 ≤ 35Gy; eardrum ≤ 50Gy; brain stem ≤ 54Gy; optic nerve ≤ 54Gy; optic chiasm ≤ 54Gy; hypophysis ≤ 54Gy; spinal cord ≤ 45Gy; temporal lobe ≤ 60Gy; mandibular ≤ 60Gy; temporomandibular joint ≤ 60Gy; and as low an exposure dose as possible for the oral cavity.
Primary sites and the neck were irradiated with coplanar radiation fields. The dose distribution on the target volumes and organs at risk was appraised slice by slice according to dose volume histogram (DVH) and CT film. PTV required that the volume percentage relevant to 100% prescription dose curve be equal to or greater than 95%; the PTV volume percentage relevant to not less than a 110% prescription dose curve be less than 20%; the PTV volume percentage relevant to not less than a 115% prescription dose curve be less than 5%; and the PTV volume percentage relevant to less than a 93% prescription dose curve be less than 1%.
All stages were defined according to the seventh edition of the UICC/AJCC staging standards, Of the 477 patients with Stage II-IVB disease, 93.70%(461/492)received platinum-based chemotherapy. All centers used identical chemotherapy protocols. Of these cases, 51.0% (235/461) received concurrent chemotherapy; 37.09% (171/461) received induction-concurrent chemotherapy; 7.59% (35/461) received concurrent-adjuvant chemotherapy; 4.12% (19/461) received induction-concurrent-adjuvant chemotherapy; and 0.22% (1/461) received induction chemotherapy.
Random follow-ups
Random follow-ups began 3 months after end of treatment. The follow-up period was defined as starting from the date of commencement of treatment to the date of the last random follow-up, or to the time of death. By December 31, 2014, the date of the last random follow-up, the median follow-up period was 64.1 months (6~92 months). A percentage of 96.3% had complete follow-up data for 5 years. Major analytic indexes included overall survival (OS), disease-free survival (DFS), local relapse-free survival (LRFS), nodal relapse-free survival (NRFS) and distant metastasis-free survival (DMFS).
Statistical method
SPSS18.0 software was used for statistical analysis. Kappa analysis, Kaplan-Meier method and Long-rank test were used respectively, to compare the distribution consistency of cases at different stages, to calculate all kinds of survival rates and to interrogate differences in survival rates. P < 0.05 was deemed statistically significant.
Results
Patients’ stages and treatment effect
According to the seventh edition UICC/AJCC staging standards, the proportions of I, II, III, IVa, and IVb were 3.0% (15/492), 14.4% (71/492), 35.8% (176/492), 38.0% (187/492), and 8.7% (43/492), respectively; the proportions of T1, T2, T3, and T4 were 6.7% (33/492), 18.5% (91/492), 33.7% (166/492), and 41.1% (202/492), respectively; the proportions of N0, N1, N2, N3a, and N3b were 13.0% (64/492), 32.3% (159/492), 45.9% (226/492), 2.2% (11/492), and 6.5% (32/492), respectively (Table 1). The 5-year overall survival (OS), disease-free survival (DFS), relapse-free survival (RFS), and distant metastasis-free survival (DMFS) rates for the whole group were 80.5%, 78.6%, 94.1%, and 84.3%, respectively.
Table1: The distribution of T, N stage of 492 nasopharyngeal carcinoma patients (UICC2010 staging systems)
Stage |
N0 |
N1 |
N2 |
N3a |
N3b |
Total |
T1 |
14 |
16 |
3 |
0 |
0 |
33 |
T2 |
25 |
31 |
24 |
4 |
7 |
91 |
T3 |
15 |
64 |
70 |
1 |
16 |
166 |
T4 |
10 |
48 |
129 |
6 |
9 |
202 |
Total |
64 |
159 |
226 |
11 |
32 |
492 |
Comparison of LRFS curves of T stage, DMFS curves of N stage and OS curves of clinical stage (UICC/AJCC staging standard)
According to UICC/AJCC staging standards, the 5-year LRFS curves of T1, T2, T3, and T4 were 100%, 98.2%, 97.9%, and 88.2%, respectively (x2 = 25.916, P < 0.01). The differences of the LRFS curves of T1 and T2 (x2 = 0.379, P > 0.05), T1 and T3 (x2 = 0.687, P > 0.05), T2 and T3 (x2 = 0.285, P > 0.05) were not statistically significant. However, the differences in the LRFS curves between T4 and the other 3 stages were statistically significant: T1 and T4 (x2 = 4.381, P < 0.05); T2 and T4 (x2 = 9.629, P < 0.01); T3 and T4 (x2 = 13.759, P < 0.01) (Figure 1A). LRFS and OS comparisons among the T categories are shown in Table 2. Hazard ratios (HRs) for LRFS and OS between T1 and T2, and between T2 and T3 did not differed significantly (P > 0.05). T4 had significantly higher hazard risk of both LRFS and OS failures compared with other T stages (HR = 7.031 and 3.441, respectively, P < 0.01) (Table 2).
Table 2: Independent significance of T and N-categories by multivariate analyses of 492 nasopharyngeal carcinoma patients
Failure |
Category |
comparison |
Dealth |
|
HR (95% CI) |
P value |
|||
5-yr OS |
T1 |
|||
T2 |
T2 vs T1 |
2.703(0.333-21.979) |
0.352 |
|
T3 |
T3 vs T2 |
1.081(0.703-1.661) |
0.722 |
|
T4 |
T4 vs T3 |
3.441(1.536-7.712) |
0.003 |
|
T1+T2+T3 |
T1 +T2 +T3 vs T4 |
1.657(1.101-2.495) |
0.016 |
|
N0 |
||||
N1 |
N1 vs N0 |
1.592(1.208-2.098) |
0.001 |
|
N2 |
N2 vs N1 |
2.458(1.432-4.219) |
0.001 |
|
N3a |
N3a vs N2 |
2.857(1.225-6.662) |
0.015 |
|
N3b |
N3b vs N3a |
0.847(0.329-2.184) |
0.731 |
|
N3a+ N3b |
N3a+ N3b vs N2 |
2.507(1.508-4.169) |
0.000 |
|
5-yr LRFS |
T1 |
|||
T2 |
T2 vs T1 |
3.339(0.000-3.926) |
0.712 |
|
T3 |
T3 vs T2 |
1.835(0.191-17.653) |
0.599 |
|
T4 |
T4 vs T3 |
7.031(2.11-23.422) |
0.001 |
|
T1+T2+T3 |
T1 +T2 +T3 vs T4 |
9.445(3.265-27.324) |
0.000 |
|
5-yr DMFS |
N0 |
|||
N1 |
N1 vs N0 |
1.750(1.310-2.338) |
0.000 |
|
N2 |
N2 vs N1 |
2.116(1.170-3.824) |
0.014 |
|
N3a |
N3a vs N2 |
3.534(1.499-8.332) |
0.004 |
|
N3b |
N3b vs N3a |
0.821(0.315-2.140) |
0.687 |
|
N3a+ N3b |
N3a+ N3b vs N2 |
2.758(2.012-3.780) |
0.000 |
|
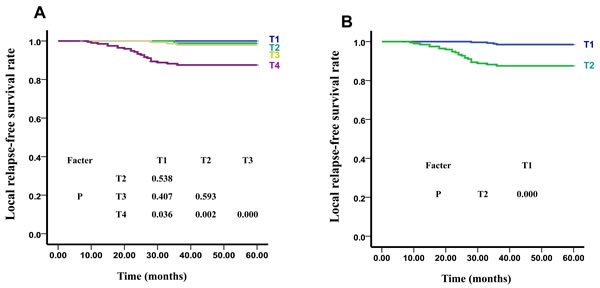
Figure 1: The LRFS Curves of T stage of UICC A. and our New Recommended staging systems B.
As shown in Figure 2A, the 5-year DMFS curves of N0, N1, N2, N3a, and N3b were 98.4%, 90.4%, 81.1%, 45.5%, and 49.3% (x2 = 57.489, P < 0.01) , respectively. The difference between N3a and N3b (x2 = 1.141, P > 0.05) was not statistically significant. However, the differences between N0 and N1 (x2 = 4.325, P < 0.05), N0 and N2 (x2 = 11.197, P < 0.01), N0 and N3a (x2 = 35.224, P < 0.01), N0 and N3b (x2 = 31.973, P < 0.01), N1 and N2 (x2 = 6.491, P < 0.05), N1 and N3a (x2 = 22.421, P < 0.01), N1 and N3b (x2 = 31.427, P < 0.01), N2 and N3a (x2 = 9.797, P < 0.01), and N2 and N3b (x2 = 12.721, P < 0.01) were all statistically significant. HR for DMFS and OS between the N0 and N1, N1 and N2, and N2 and N3a differed significantly, but this was not the case between N3a and N3b. When combining N3a and N3b, the differences in HRs for both DMFS and OS were significant (HR = 2.758 and 2.507, respectively, P < 0.01).
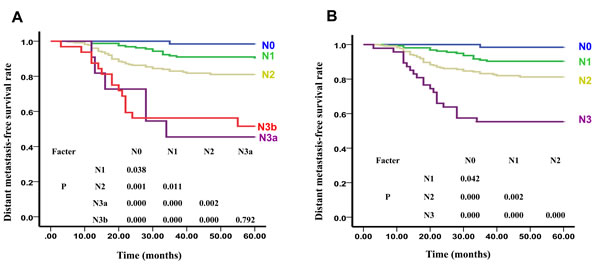
Figure 2: The DMFS Curves of N stage of UICC. A. and our New Recommended staging systems B.
As shown in Figure 3A, the 5-year OS curves of Clinical I, II, III, IVa, and IVb were 98.6%, 93.3%, 81.0%, 79.4%, and 45.5% (x2 = 54.040, P < 0.01), respectively. The differences between I and II (x2 = 1.408, P > 0.05), I and III (x2 = 1.551, P > 0.05), I and IVa (x2 = 1.878, P > 0.05), II and III (x2 = 1.44, P > 0.05), III and IVa (x2 = 0.619, P > 0.05) were not statistically significant. However, the differences between I and IVb (x2 = 8.481, P < 0.01), II and IVa (x2 = 14.652, P < 0.01), II and IVb (x2 = 41.158, P < 0.01), III and IVb (x2 = 27.433, P < 0.01), and also between IVa and IVb (x2 = 18.017, P < 0.01) were all statistically significant. HR for OS were significantly different only in when comparing of stage IVb and IVc with stage I (P < 0.05), and not when stages II, III, and IVa were compared with stage I (P > 0.05) (Table 4).
New recommended staging standard
The above results of LRFS curves of NPC patients showed that there was a statistically significant difference only between T4 and the other 3 stages, which, we suggest, means that T1, T2, and T3 can be combined to form T1 in a new staging system. In addition, the DMFS curves of N3a and N3b were similar, thus N3a and N3b can also be combined as N3 in a new staging system. The prognosis of NPC patients with distant metastases was usually poor. Therefore, we suggest dividing stage IV into IVa and IVb according to our data. Our suggested new clinical NPC staging standard based on MRI and adaptable to IMRT is, then, as follows: T stage (including T1 and T2) and N stage (including N0, N1, N2, and N3). Our suggested clinical staging includes I (T1N0M0), II (T1N1-2M0, T2N0M0), III (T2N1-2M0), IVa (TxN3M0) and IVb (TxNxM1).
Appraisal of the new recommended staging standard survival predictive value
As shown in Figure 1B, there were significant differences between the 5-year LRFS curves of sub-stages in our new recommended T stage: T1:T2 (x2 = 23.723, P = 0.000). The differences between the 5-year DMFS curves of sub-stages in our new recommended N stage were also found to be statistically significant: N0:N1 (x2 = 4.119, P < 0.05), N0:N2 (x2 = 13.537, P < 0.01), N0:N3 (x2 = 34.401, P < 0.01), N1:N2 (x2 = 9.917, P < 0.01), N1:N3 (x2 = 38.127, P < 0.01), N2:N3 (x2 = 13.594, P < 0.01) (Figure 2B). Additionally, statistically significant differences were noted between the 5-year OS curves of our new recommended clinical stages: I:II (x2 = 5.172, P < 0.05), I:III (x2 = 9.950, P < 0.01), I:IVa (x2 = 28.115, P < 0.01), II:III (x2 = 4.547, P < 0.05), II:IVa (x2 = 32.179, P < 0.01), III:IVa (x2 = 12.070, P < 0.01) (Figure 3B).
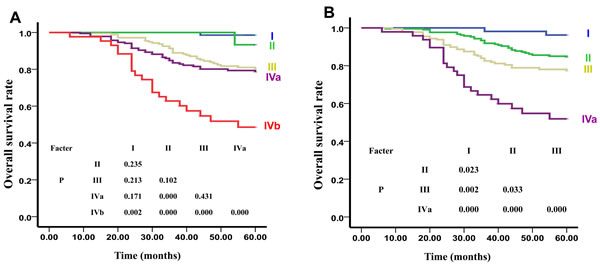
Figure 3: The OS Curve of Clinical Stages of UICC. A. and our New Recommended staging systems B..
Distribution balance
The cases number and ratio of our new recommended staging system and also those of the UICC/AJCC staging system are listed in Table 3. In the UICC/AJCC staging system, the proportions of each T stage were T1 (6.7%), T2 (18.5%), T3 (33.7%), and T4 (41.1%), while in our new recommended staging system T1 and T2 are 58.9% and 41.1% respectively. The case distributions of the N stages in both staging systems were equivalent. Turning to the comparative distribution of the clinical stages, the numbers in the I and II stages of the new system we propose were greater than those of the UICC/AJCC system (10.3%, 40.5% vs. 2.9%, 13.5%, respectively). Overall, the distribution balance of our proposed new staging system is better than that of UICC staging system.
Table 3: Comparison of distribution balance between two staging systems cases (%)
stage |
UICC system |
Proposed system |
|
T stage |
|||
T1 |
33 (6.7) |
290(58.9) |
|
T2 |
91(18.5) |
202(41.1) |
|
T3 |
166(33.7) |
- |
|
T4 |
202(41.1) |
- |
|
N stage |
|||
N0 |
64(13.0) |
64(13.0) |
|
N1 |
159(32.3) |
159(32.3) |
|
N2 |
226(45.9) |
226(45.9) |
|
N3 |
N3a |
11(2.2) |
43(8.7) |
N3b |
32(6.5) |
||
M stage |
|||
M |
34 (6.5) |
34 (6.5) |
|
Clinical stage |
|||
I |
15(2.9) |
54(10.3) |
|
II |
71(13.5) |
213(40.5) |
|
III |
176(33.5) |
177(33.7) |
|
IVa |
187(35.6) |
48(9.1) |
|
IVb |
43(8.2) |
34 (6.5) |
|
IVc |
34(6.5) |
- |
|
Risk difference
The overall survival hazard ratios between our proposed new staging system and that of the UICC/AJCC are set out in Table 4, where stage I is chosen as the benchmark (HR = 1). The risk differentials between each stage of our proposed system are all higher than those of the UICC/AJCC staging system. Moreover, we found significant risk differentials when comparing stage I with other stages in our system , where in the UICC/AJCC staging system they are to be found only when comparing stages IVb and IVc with stage I. We also found that the risk at stage IVb of our proposed system was dramatically higher than that at stage IVc of the UICC/AJCC staging system (91.642 vs. 51.297), even though both consist of M1 patients.
Table 4: Comparison of risk difference between two staging systems
N stage |
N |
Overall survival Hazard ratio(95% CI) |
Proposed system |
||
I |
54(10.3) |
1 |
II |
213(40.5) |
4.151(1.058-18.494)* |
III |
177(33.7) |
7.382(1.777-30.658)* |
IVa |
48(9.1) |
19.508(4.576-83.167)* |
IVb |
34 (6.5) |
91.642 (21.198-396.190)* |
UICC system |
||
I |
15(2.9) |
1 |
II |
71(13.5) |
1.311(0.358-4.810) |
III |
176(33.5) |
3.165(0.432-23.171) |
IVa |
187(35.6) |
3.824(0.524-27.883) |
IVb |
43(8.2) |
11.996(1.611-89.351)* |
IVc |
34(6.5) |
51.297(6.833-385.106)* |
*P < 0.05
Discussion
In the past 10 years, diagnosis and therapy for NPC have dramatically improved. Intensity-modulated radiotherapy (IMRT) has gradually replaced two-dimensional radiotherapy (2D-RT) as the mainstream therapy for NPC [11]. Combination therapy, with IMRT as the lead therapy, has dramatically improved the prognosis of NPC patients and the 5-year overall survival has reached 80% [12-17]. Zong et al. [18] surveyed 1241 nasopharyngeal carcinoma (NPC) patients treated with IMRT, of whom 88.7% received concurrent platinum-based chemotherapy. The rates of 5-year OS, DSS, DMFS, RRFS, and LRFS were 81.1%, 82.6%, 82.6%, 95.4%, and 92.9% respectively. In the present study, the 5-year overall survival (OS), disease-free survival (DFS), relapse-free survival (RFS), and distant metastasis-free survival (DMSF) of the entire cohort are 80.5%, 78.6%, 94.1%, and 84.3%, respectively. This is consistent with other reports.
The TNM staging system is a comprehensive and inclusive system incorporating a host of prognostic factors confirmed by research in clinical epidemiology, and identifying new prognosis factors depends on improvements in diagnosis and therapy, which, because they are ongoing and continuous mean that due to prognosis factors are also changing. This in turn requires the, staging system to be regularly updated. The seventh edition of the UICC/AJCC staging standard the published in 2009 is largely based on the data and results of regular two-dimensional radiotherapy. IMRT, which is more targeted and more accurate than the old two-dimensional method, has been applied more and more frequently in the treatment of NPC. A number of studies have shown that the survival rates between each T stage in nasopharyngeal carcinoma patients were not significantly difference between each T stage after treatment with IMRT [16, 17, 19]. Han, et al. conducted a retrospective analysis on 305 patients who had received IMRT and found that the T stage was no longer the most influential factor in the local regional control rate and the overall survival rate [20] . Lin, et al. have also indicated that the T stage was no longer the factor that most influences outcomes in clinical treatment, but that the N stage was the key prognostic factor influencing distant metastasis-free survival and overall survival rates [9]. The results of one survey group indicated that the differences in local relapse risk ratios between T2b and T1, T2b and T2a, and T2b and T3 were not statistically significant [19] . Studies have showned that differences in overall survival between T1 and T2a, T2b sub-stages were not statistically significant [21-23] , and the prognosis of T2N0 and T1N1 of stage II were similar to that at T1N0 of stage I [23-24] . Additionally there is some disagreement over the utility of having maximum lymph node diameter as the independent prognostic factor, identified through palpation in the N stage of NPC [19, 21 23, 25, 29]. In this study, we observed 492 NPC patients with initial treatment and analyzed the relationship between prognosis and staging. According to the seventh edition of the UICC/AJCC staging system, the differences between T1, T2, and T3 were not statistically significant, while those between T4 and the other 3 stages were all statistically significant. Moreover, there were significant differences between each stage except N3a and N3b. Further, the OS curves of stage I, II, III, and IVa were not significantly different other between each other. These results indicated that the seventh edition of the UICC/AJCC staging system is inappropriate for the staging of patients who have received IMRT.
Lee [30] found, in a study of 985 NPC patients treated with 3D conformal radiotherapy or IMRT, that the difference in LRFS between T2 and T3 was significant (P = 0.043), but not that the difference between the LRFS of T1 and T2 (P = 0.99).Zong et al [18] , meanwhile, performed a retrospective analysis of 1241 newly diagnosed NPC patients without distant metastasis who received IMRT. All MRIs were independently reevaluated and restaged according to the 7th edition UICC/AJCC staging system, and the relationship between prognostic factors and staging were analyzed. They found that the hazard ratios (HRs) for DSS and OS between T2 and T3 as well as between T3 and T4 differed significantly, but not those between T1 and T2. Therefore, they suggested combining T1 and T2 into T1, and changing T3 and T4 to T2 and T3, respectively. Chen et al.[31] conducted a retrospective study of 512 NPC patients treated with IMRT, and reported that the LRFS and DFS of T1 and T2 subjects, calculated using the 7th edition system were significantly different (P = 0.019 and P = 0.009). However, they were not between T2 and T3 (P = 0.874 and P = 0.589) [31] . These reports indicate that local control differences between T1-3 patients will be diminished when treated with 3DCRT or IMRT. In the present study, hazard ratios (HRs) for LRFS and OS between T1 and T2 and between T2 and T3 were not significantly different (P > 0.05). T4 subjects had a significantly higher risk of both LRFS and OS failures compared with other T stages (HR = 7.031 and 3.441, respectively, P < 0.01)(Table 2), suggesting that T1, T2, and T3 can be combined as T1 (T1 + T2 + T3 vs T4, HR = 9.445 and 1.657, respectively, P < 0.05).
Zong [18] found, in a retrospective analysis of 1241 newly diagnosed NPC patients without distant metastases who received IMRT, that the differences in DMFS between N0 and N1 and N1 and N2 were significant. However, no significant difference was found in DMFS between N2 and N3a, or between N2 and N3b. HR for DSS and OS between N0 and N1,and between N1 and N2, differed significantly, but not between N2 and N3a, or N3a and N3b. In this study, there were significant differences in DMFS and OS between each stage except N3a and N3b. The differences in HR for DMFS and OS between N0 and N1, N1 and N2, and N2 and N3a were significant, but not between N3a and N3b. When combining N3a and N3b, the differences in HRs for both DMFS and OS were found to be significant (HR = 2.758 and 2.507, respectively, P < 0.01)(Table 2). Thus we suggest that N3a and N3b could be combined as N3. This notion is consistent with other studies.
In this study, we performed a multi-center prospective clinical trial with a cohort of 492 NPC patients presenting for initial treatment and analyzed the relationship between prognosis and staging. Regardless of the limitation of the number of cases, the results indicated that the 7th edition of the UICC/AJCC staging system still showed superior prognostic value in NPC patients treated with IMRT. Therefore, we propose a new clinical NPC staging standard based on MRI and adaptable to IMRT as follows: T stage (including T1 and T2) and N stage (incorporating N0, N1, N2, and N3). Our adjusted clinical staging is thus: I (T1N0M0), II (T1N1-2M0, T2N0M0), III (T2N1-2M0), IVa (TxN3M0), and IVb (TxNxM1). Compared to the seventh edition of the UICC/AJCC staging system, our proposed staging performs better in risk difference and distribution balance calculations. Furthermore, the differences between the sub-stages in the 5-year curves of LRFS, DMFS, and OS were all statistically significant in our adjusted system. We conclude that our proposed new staging system is better tuned to NPC patients undergoing IMRT and can predict their prognosis more accurately.
Acknowledgements
This work was supported by grants from the Research Foundation of the Health Department of Guangxi Province, China (No.zhong2011074), National Natural Science Foundation of China (No. 81460460, Min Kang), and the Research Foundation of the Science and Technology Department of Guangxi Province, China (No.2014GXNSFBA118114, Min Kang).
conflicts of interest
All authors declare no financial competing interests.
References
1. Sobin LH. TNM: evolution and relation to other prognostic factors. Semin Surg Oncol. 2003; 21:3-7.
2. Ng SH, Chang TC, Ko SF, Yen PS, Wan YL, Tang LM, Tsai MH. Nasopharyngeal carcinoma: MRI and CT assessment. Neuroradiology. 1997; 39:741-6.
3. Liao XB, Mao YP, Liu LZ, Tang LL, Sun Y, Wang Y, Lin AH, Cui CY, Li L, Ma J. How does magnetic resonance imaging influence staging according to AJCC staging system for nasopharyngeal carcinoma compared with computed tomography? Int J Radiat Oncol Biol Phys. 2008;72: 1368-77.
4. Pow EH, Kwong DL, McMillan AS, Wong MC, Sham JS, Leung LH, Leung WK. Xerostomia and quality of life after intensity-modulated radiotherapy vs. conventional radiotherapy for early stage nasopharyngeal carcinoma: initial report on a randomized controlled clinical trial. Int J Radiat Oncol Biol Phys. 2006; 66:981-91.
5. Kam MK, Leung SF, Zee B, Chau RM, Suen JJ, Mo F, Lai M, Ho R, Cheung KY, Yu BK, Chiu SK, Choi PH, Teo PM, et al. Prospective randomized study of intensity modulated radiotherapy on salivary gland function in early-stage nasopharyngeal carcinoma patients. J Clin Oncol. 2007; 25:4873-9.
6. Peng G, Wang T, Yang KY, Zhang S, Zhang T, Li Q, Han J, Wu G. A prospective, randomized study comparing outcomes and toxicities of intensity-modulated radiotherapy vs. conventional two-dimensional radiotherapy for the treatment of nasopharyngeal carcinoma.Radiother Oncol. 2012; 104:286-93.
7. Li AC, Xiao WW, Shen GZ, Wang L, Xu AA, Cao YQ, Huang SM, Lin CG, Han F, Deng XW, Zhao C. Distant metastasis risk and patterns of nasopharyngeal carcinoma in the era of IMRT: long-term results and benefits of chemotherapy. Oncotarget. 2015; 6:24511-21. doi: 10.18632/oncotarget.4312.
8. Zeng L, Guo P, Li JG, Han F, Li Q, Lu Y, Deng XW, Zhang QY, Lu TX. Prognostic score models for survival of nasopharyngeal carcinoma patients treated with intensity-modulated radiotherapy and chemotherapy.Oncotarget. 2015; 6:39373-83. doi: 10.18632/oncotarget.5781.
9. Lin S, Pan J, Han L, Zhang X, Liao X, Lu JJ. Nasopharyngeal carcinoma treated with reduced-volume intensity-modulated radiation therapy: report on the 3-yr outcome of a prospective series. Int J Radiat Oncol Biol Phys. 2009; 75:1071-8.
10. O’Sullivan B, Yu E. Staging of nasopharyngeal carcinoma. In: Lu JJ, Cooper JS, Lee AWM, editors. Nasopharyngeal Cancer-Multidisciplinary Management. Berlin Heidelberg: Springer; 2010; 309-22.
11. Lai SZ, Li WF, Chen L, Luo W, Chen YY, Liu LZ, Sun Y, Lin AH, Liu MZ, Ma J. How does intensity-modulated radiotherapy versusconventional two-dimensional radiotherapy influence the treatment results in nasopharyngeal carcinoma patients? Int J Radiat Oncol Biol Phys. 2011; 80:661-8.
12. Lee AW, Sze WM, Au JS, Leung SF, Leung TW, Chua DT, Zee BC, Law SC, Teo PM, Tung SY, Kwong DL, Lau WH. Treatment results for nasopharyngeal carcinoma in the modern era: the Hong Kong experience. Int J Radiat Oncol Biol Phys. 2005; 61:1107-16.
13. Lee AW, Lin JC, Ng WT. Current management of nasopharyngeal cancer. Semin Radiat Oncol. 2012; 22:233-44.
14. Wong FC, Ng AW, Lee VH, Lui CM, Yuen KK, Sze WK, Leung TW, Tung SY. Whole-field simultaneous integrated-boost intensity-modulated radiotherapy for patients with nasopharyngeal carcinoma. Int J Radiat Oncol Biol Phys. 2010; 76:138-45.
15. Lee N, Harris J, Garden AS, Straube W, Glisson B, Xia P, Bosch W, Morrison WH, Quivey J, Thorstad W, Jones C, Ang KK. Intensity-modulated radiation therapy with or without chemotherapy for nasopharyngeal carcinoma: radiation therapy oncology group phase II trial 0225. J Clin Oncol. 2009; 27:3684-90.
16. Lee N, Xia P, Quivey JM, Sultanem K, Poon I, Akazawa C, Akazawa P, Weinberg V, Fu KK. Intensity-modulated radiotherapy in the treatment of nasopharyngeal carcinoma: an update of the UCSF experience. Int J Radiat Oncol Biol Phys. 2002; 53:12-22.
17. Lee AW, Lau WH, Tung SY, Chua DT, Chappell R, Xu L, Siu L, Sze WM, Leung TW, Sham JS, Ngan RK, Law SC, Yau TK, et al. Preliminary results of a randomized study on therapeutic gain by concurrent chemotherapy for regionally-advanced nasopharyngeal carcinoma: NPC-9901 Trial by the Hong Kong Nasopharyngeal Cancer Study Group. J Clin Oncol. 2005; 23:6966-75.
18. Zong J, Lin S, Lin J, Tang L, Chen B, Zhang M, Zhang Y, Xu L, Chen Y, Xiao Y, Fang Y, Pan J. Impact of intensity-modulated radiotherapy on nasopharyngeal carcinoma: Validation of the 7th edition AJCC staging system.Oral Oncol. 2015; 51:254-9.
19. Mao YP, Xie FY, Liu LZ, Sun Y, Li L, Tang LL, Liao XB, Xu HY, Chen L, Lai SZ, Lin AH, Liu MZ, Ma J. Re-evaluation of 6th edition of AJCC staging system for nasopharyngeal carcinoma and proposed improvement based on magnetic resonance imaging. Int J Radiat Oncol Biol Phys. 2009; 73:1326-34.
20. Han L, Lin SJ, Pan JJ, Chen CB, Zhang Y, Zhang XC, Liao XY, Chen QS. Prognostic factors of 305 nasopharyngeal carcinoma patients treated with intensity-modulated radiotherapy. Chin J Cancer. 2010; 29:145-50.
21. Heng DM, Wee J, Fong KW, Lian LG, Sethi VK, Chua ET, Yang TL, Khoo Tan HS, Lee KS, Lee KM, Tan T, Chua EJ. Prognostic factors in 677 patients in Singapore with nondisseminated nasopharyngeal carcinoma. Cancer. 1999; 86:1912-20.
22. Chua DT, Sham JS, Wei WI, Ho WK, Au GK. The predictive value of the 1997 American Joint Committee on Cancer stage classification in determining failure patterns in nasopharyngeal carcinoma. Cancer. 2001; 92:2845-55.
23. Lee AW, Au JS, Teo PM, Leung TW, Chua DT, Sze WM, Zee BC, Law SC, Leung SF, Tung SY, Kwong DL, Lau WH. Staging of nasopharyngeal carcinoma: suggestions for improving the current UICC/AJCC Staging System. Clin Oncol (R Coll Radiol). 2004; 16:269-76.
24. Lee AW, Foo W, Law SC, Poon YF, O SK, Tung SY, Sze WM, Chappell R, Lau WH, Ho JH. Staging of nasopharyngeal carcinoma: from Ho’s to the new UICC system. Int J Cancer. 1999; 84:179-87.
25. Liu MZ, Tang LL, Zong JF, Huang Y, Sun Y, Mao YP, Liu LZ, Lin AH, Ma J. Evaluation of sixth edition of AJCC staging system for nasopharyngeal carcinoma and proposed improvement. Int J Radiat Oncol Biol Phys. 2008; 70:1115-23.
26. Lin S, Lu JJ, Han L, Chen Q, Pan J. Sequential chemotherapy and intensity-modulated radiation therapy in the management of locoregionally advanced nasopharyngeal carcinoma: experience of 370 consecutive cases. BMC Cancer. 2010; 10:39.
27. Kong F, Ying H, Huang S, Du C, Zhou J, Hu C. Preliminary results of nasopharyngeal carcinoma treated with intensity-modulated radiotherapy: a retrospective study of 364 patients. Eur Arch Otorhinolaryngol. 2014; 271:3283-90.
28. Xu JH, Guo WJ, Bian XH, Wu JF, Jiang XS, Guo YS, He X. A comparative study of locoregionally advanced nasopharyngeal carcinoma treated with intensity modulated irradiation and platinum-based chemotherapy. Cancer Radiother. 2013; 17:297-303.
29. El-Sherbieny E, Rashwan H, Lubis SH, Choi VJ. Prognostic factors in patients with nasopharyngeal carcinoma treated in Hospital Kuala Lumpur. Asian Pac J Cancer Prev. 2011; 12:1739-43.
30. Lee AW, Ng WT, Chan LK, Chan OS, Hung WM, Chan CC, Cheng PT, Sze H, Lam TS, Yau TK.The strength/weakness of the AJCC/UICC staging system (7th edition)opharyngeal cancer and suggestionsfor future improvement.Oral Oncol. 2012 ;48: 1007-13.
31. Chen L, Mao YP, Xie FY, Liu LZ, Sun Y, Tian L, Tang LL, Lin AH, Li L, Ma J.The seventh edition of the UICC/AJCC staging system for nasopharyngeal carcinoma is prognostically useful for patients treated with intensity-modulated radiotherapy from an endemic area in China.Radiother Oncol. 2012; 104:331-7.